Chapter 24. Configuring a Gallery for Reporting Services, Power View, and Excel Services
Before we get into the details of creating some SQL Server Reporting Services reports, Power View reports, and Excel Services, we have a few quick steps to get our SharePoint Site ready.
Note
In this chapter, we assume some previous experience with SharePoint and that you are familiar with the concept of SharePoint features.
SharePoint features are bundles of functionality that can be activated by users with appropriate rights enabling a set of capabilities in the product.
Enabling Required Features
In this case, let’s start by ensuring that a few Site Collection scoped features are enabled. Without these features enabled, SharePoint will not have the components to support the business intelligence scenarios we’ll be walking through during this solution. To enable them, navigate from the Site Actions menu to Site Settings to Site Collection features, as shown in Figure 24-1. Enable the following features:
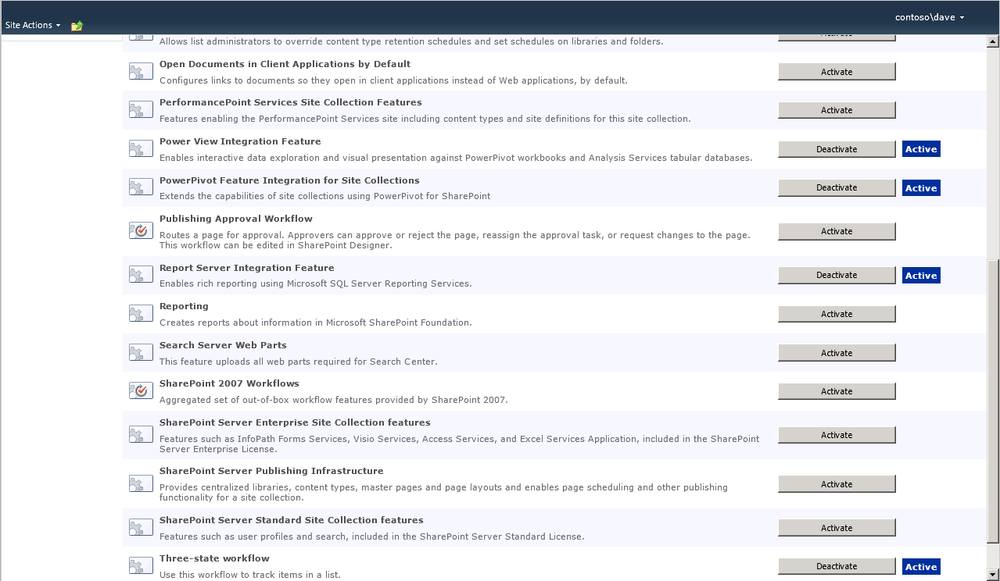
If these features were already enabled, that’s no problem. Different SharePoint site definitions will start with different features enabled; we just want to confirm that they are enabled in order to complete the following tasks.
Creating the PowerPivot Gallery
Our first step is to create a PowerPivot Gallery. The PowerPivot Gallery is a special document library with options designed for browsing and viewing Microsoft BI content. This library was added into SharePoint as a part of the SQL 2012 components for SharePoint and includes a few fancy Silverlight preview views.
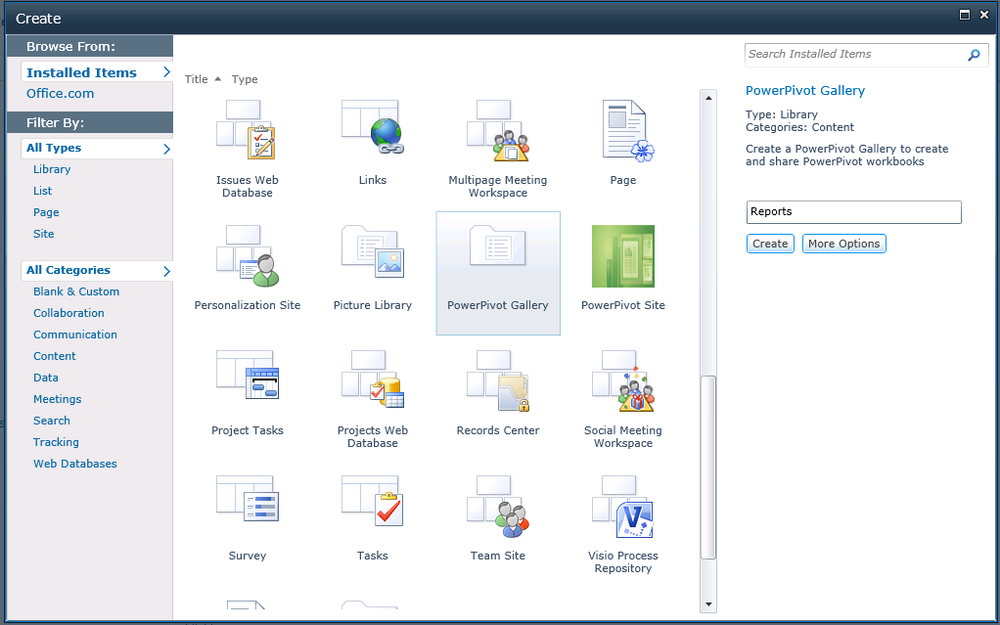
From the Site Actions menu, select More Options (Figure 24-2).
![Adding a PowerPivot GalleryComment [GM1]: need figure title.](http://imgdetail.ebookreading.net/software_development/6/9781449324667/9781449324667__developing-business-intelligence__9781449324667__httpatomoreillycomsourceoreillyimages1715576.png)
The SharePoint dialog launches. Different list and site definitions display depending on the features you have activated.
Select the PowerPivot Gallery.
Enter a name for your library and click Create (Figure 24-3).
Enabling Business Intelligence Content Types
A content type is a reusable collection of metadata, behavior, and other settings for a class of items or documents in a SharePoint Foundation 2010 list or document library. Content types enable you to manage the settings for a category of information in a centralized, reusable way. Content types can also be provided in a default template to use when creating a new item. By allowing the management of content types and adding those to the new button, you’ll make it easy for someone to add a new connection to a tabular cube, a Power View report, or a Reporting Services report.
In your new PowerPivot Gallery, activate the Library ribbon.
Select Library Settings (Figure 24-4).
Select Advanced Settings from the Library Settings page.
Select Allow management of content types on the Advanced Settings page (Figure 24-5).
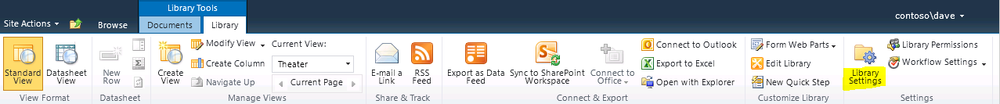
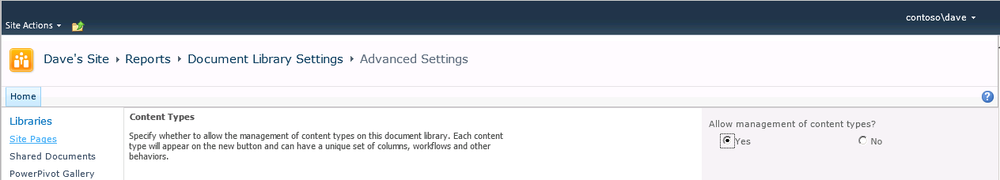
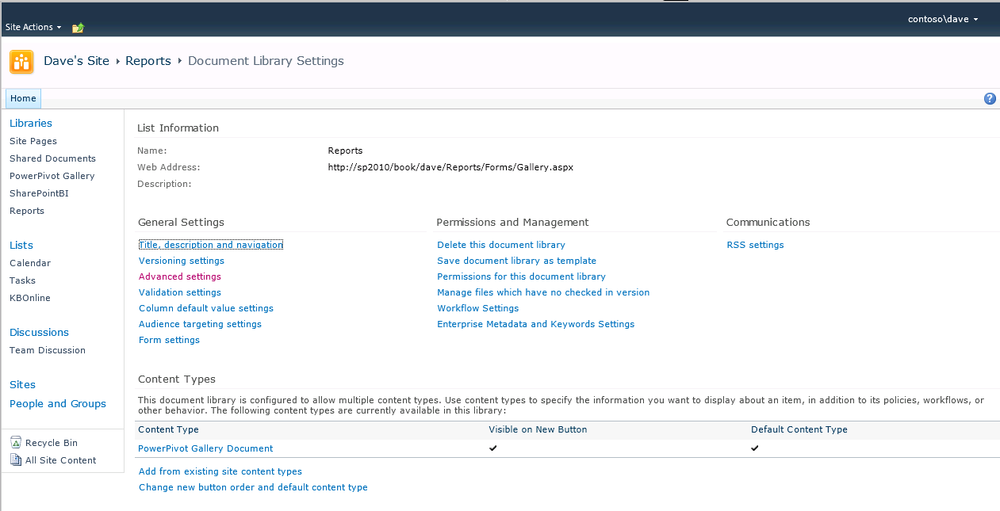
Figure 24-6 shows the Document Library Settings page after we have enabled management of content types. Notice that an additional section label, Content Types, was added to the settings page.
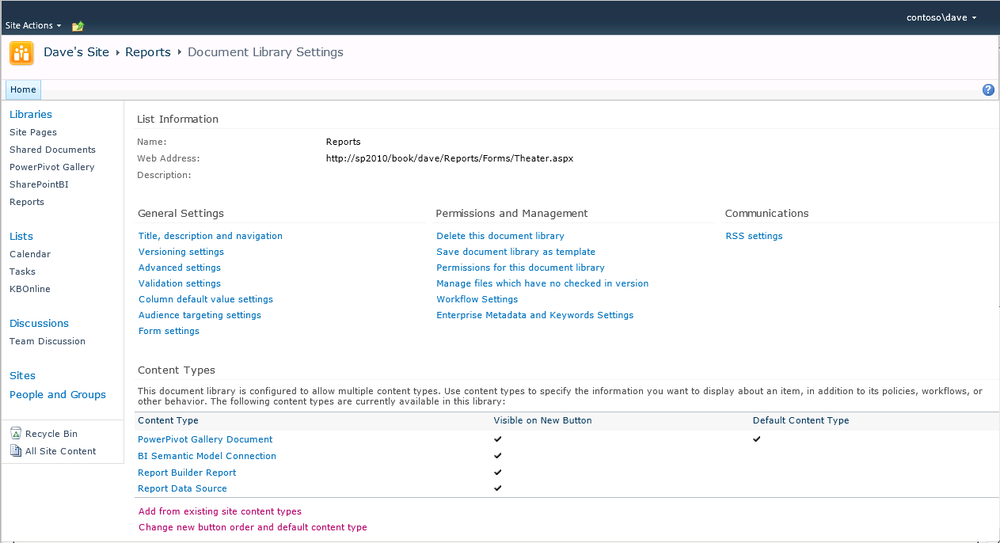
The result of these steps should look like Figure 24-7.
Setting Up Your Default View
We mentioned earlier that the PowerPivot Gallery library template comes with a collection of customized Silverlight views that provide visual previews of your Microsoft BI content.
The Gallery is the default view for a PowerPivot Gallery. The preview appears to the left. Smaller thumbnails of each worksheet appear next to it in a sequential left-to-right order.
The All Documents view is the standard layout for document libraries. You can choose this view to manage individual documents or view library contents in a list format. The view is also a great way to access the Edit Control Block (ECB) or content menu on each item stored in the library. This is particularly useful if you need to edit a connection to a data source after a report has been created. If you are using versioning on your library, you will use this view to obtain access to previous versions.
Theatre view and Carousel view are specialized views that work best if you are showcasing a small number of related documents. The Theatre view provides a large centered preview area with smaller thumbnails of each worksheet across the bottom of the page. The Carousel view provides a large centered preview area with thumbnails that immediately precede and follow the current thumbnail that is adjacent to the preview area. This is similar to a cover flow view you would see in iTunes.
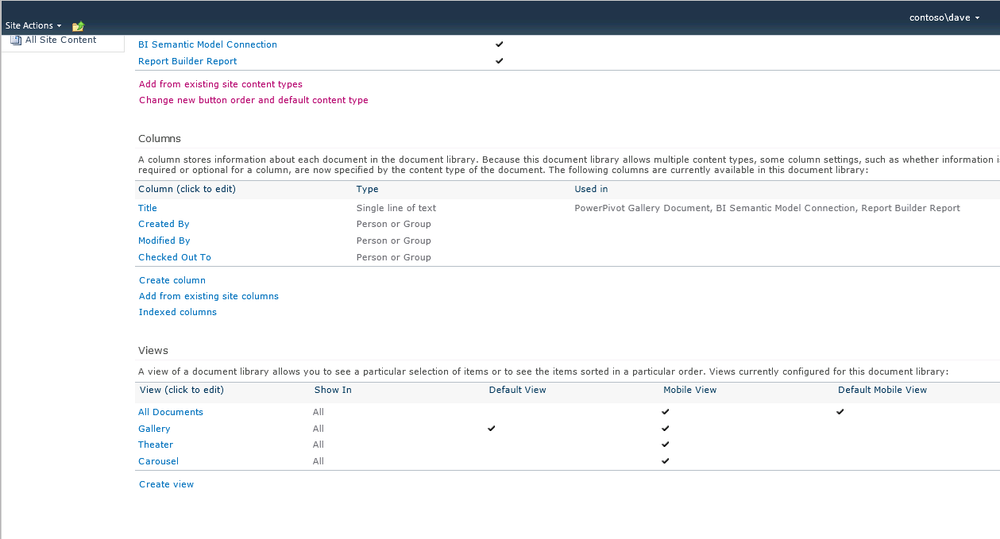
In Figure 24-8, we can the Views section of the Document Library Settings page. Select the view that you’d like to make the new default. In our case, we will use the Theater view, which works well for integrated reporting solutions.
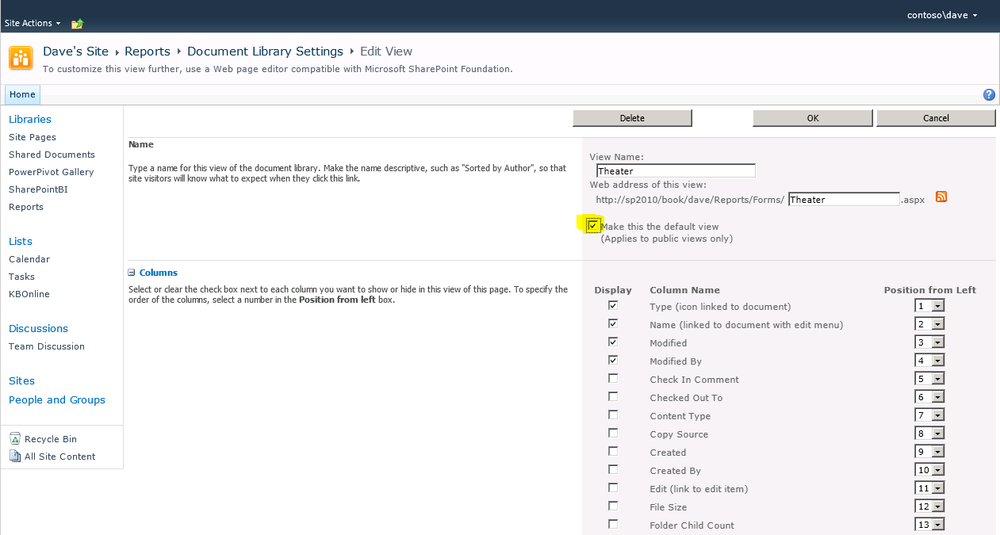
The Edit View page shown in Figure 24-9 allows us to change settings related to SharePoint views. We are editing the settings for the Theater view page. Simply check Make this the default view and click OK.
Summary
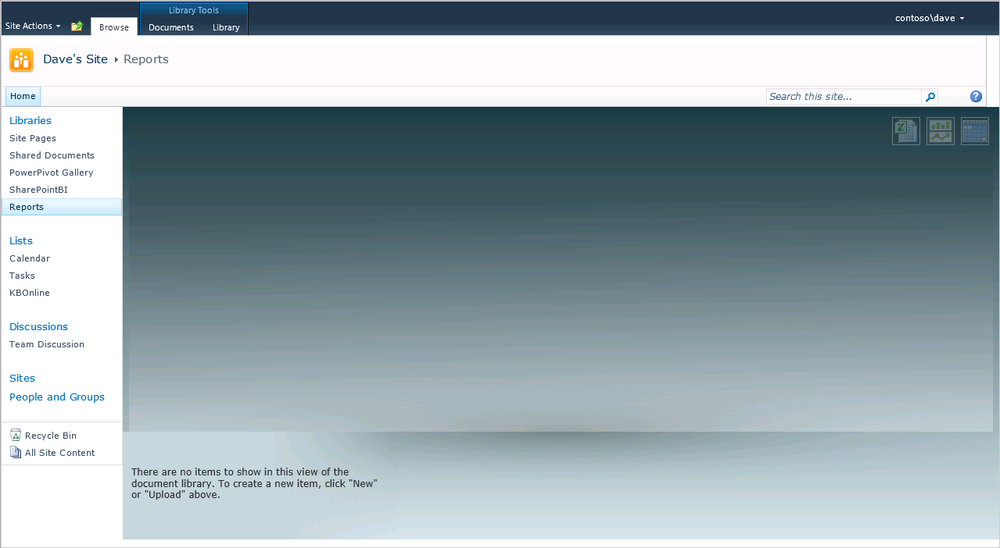
That’s it. Our PowerPivot Gallery is configured and ready to use as shown in Figure 24-10. In the following chapters, we will create and publish reports, Excel sheets, and Power View documents to our new library.