
Chapter 26. Advanced Reporting Services Charting
In the last chapter, we introduced the fundamentals of SQL Server Reporting Services. Reporting Services allow you to quickly create visually appealing charts or formatted reports for print or export to other formats. We also explored the ability to produce OData feeds and discussed the use cases for doing so.
In this chapter, we develop some more advanced skills by building on the basic reporting we did in Chapter 25. We will first develop a basic drill-down report that allows us to drill through the members of our chart. We will then move on to a more advanced technique using JavaScript to spawn a new window with the drill-down report.
The second technique, while more complicated, is worth noting because it enables you to drill down to anything that supports a URL. You could drill into another report as we’ll show here, or into any web application. It’s not a technique that’s been broadly used, but it is very useful.
The mechanics of what we’re doing are pretty simple. We have an existing report that we’re going to enhance with a click-through action. When you click on a product line in the report, you will pass that selected product line as a parameter to a second report.
The first thing you need to do is create that second report. It’s no different than your first report other than accepting a parameter for a product line by which you will filter your data. Let’s do it!
Create a Drill-Down Report
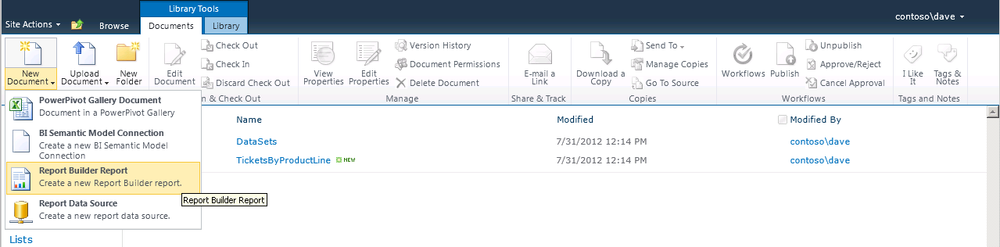
Start by selecting the All Documents view from the Library ribbon. Then choose to create a new Report Builder report, which will be our drill-down report. See Figure 26-1.
Creating a Basic Chart
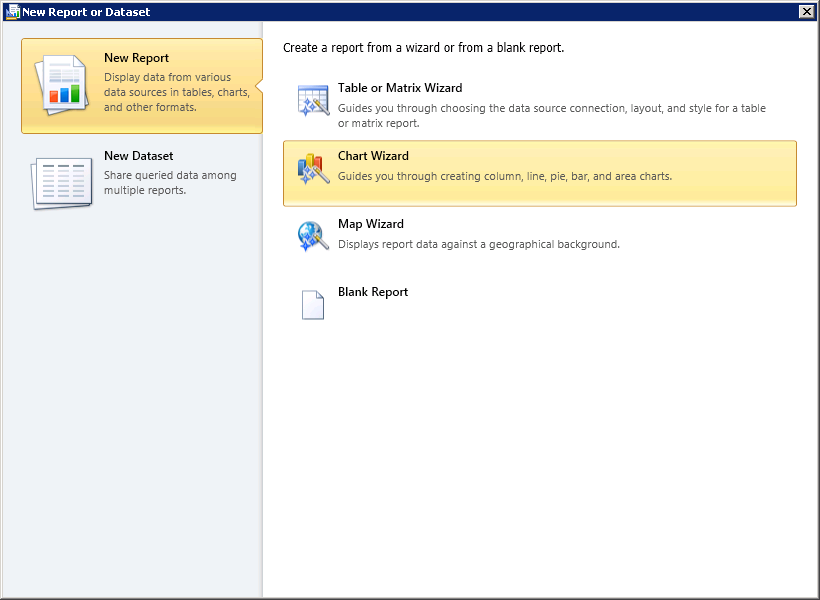
From the New Report, menu, create a new chart report using the Chart wizard as shown in Figure 26-2.
As you walk through the familiar process of creating your report, you could make a new dataset if that was appropriate for your solution. Another technique that’s worth highlighting is the ability to reuse your existing shared dataset from Chapter 25 and implement a dataset filter for your product line parameter.
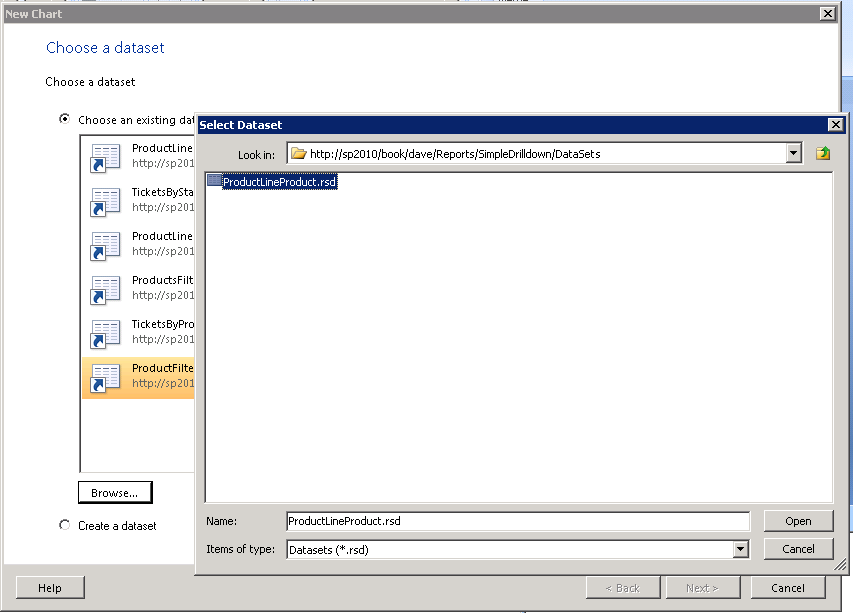
Within the New Chart wizard, let’s choose an existing dataset.
Browse to find and reuse the same data set from your earlier example (see Figure 26-3).
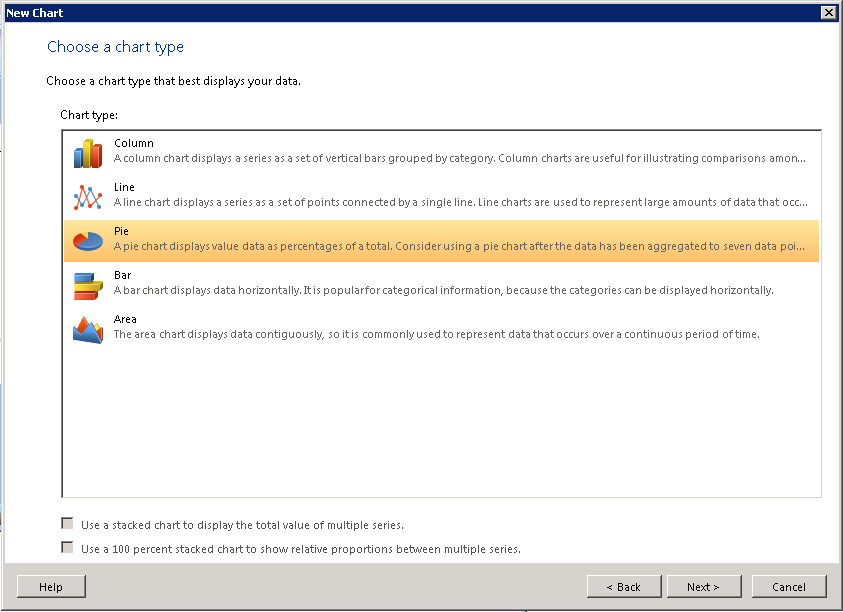
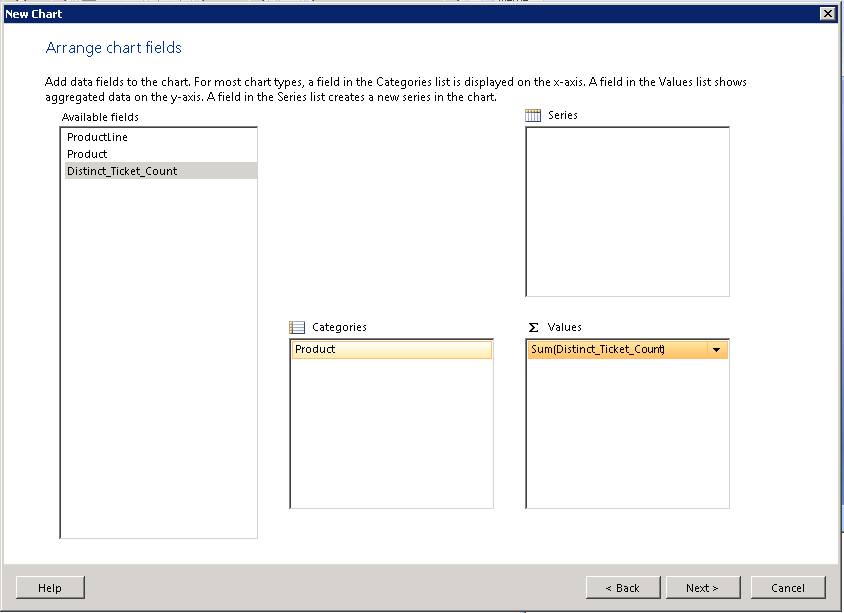
Now, repeat the process of creating your visualization in the Chart wizard, as shown in Figure 26-4. This time you should create a pie chart. The goal of this new report is to show the ticket counts by product for a specified product line.
This time, add Product to the Categories and the Sum(Distinct Ticket Count) to your Values. You’ll notice that, depending on the chart type, the wizard will present the appropriate fields for data binding as shown in Figure 26-5. You can also revisit your selections later by editing the chart’s properties, but the wizard is the faster way to get going.
Applying Predefined Styles
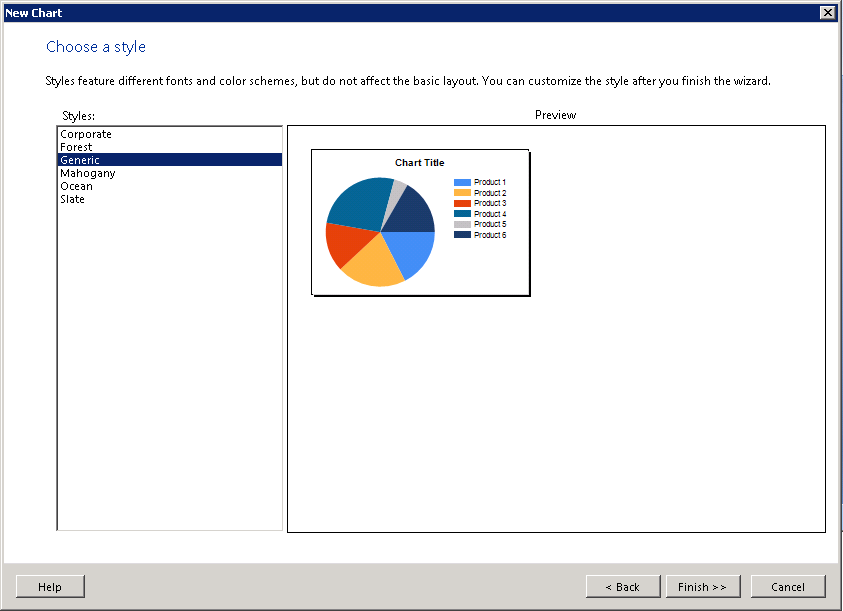
Choose your style again as shown in Figure 26-6. These styles are a great way to get started with consistent formatting on your reports. You can customize the look and feel later using the design tools.
Note
If you find that you want to add additional styles or customize a style, these are all defined in a text file called StyleTemplates.xml. This will exist both on your local Visual Studio install and on the report server.
The path may vary in your installation, but will be similar to this:
C:Program Files (x86)Microsoft Visual Studio 10.0Common7IDEPrivateAssembliesBusiness Intelligence WizardsReportsStyles StyleTemplates.xml
Size the Chart and Preview
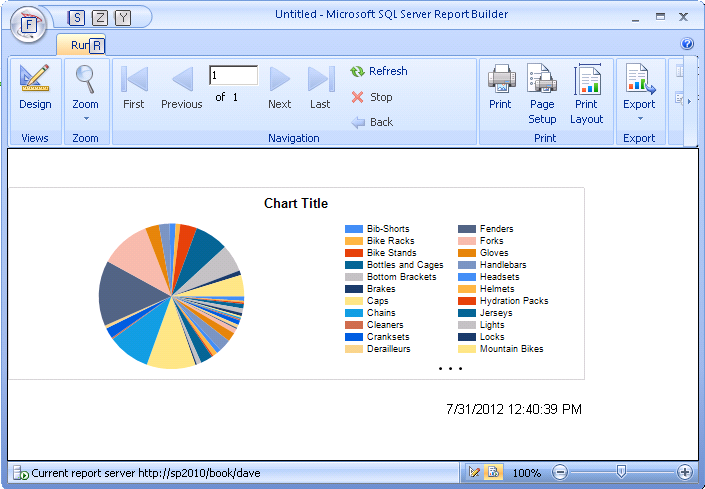
Continuing with your drill-down report, resize the pie chart to fit the full width and run it. Notice that all products are shown regardless of product line, as in Figure 26-7. You’ll need to apply a filter next to limit the results to a single product line.
Adding a Parameter to the Report
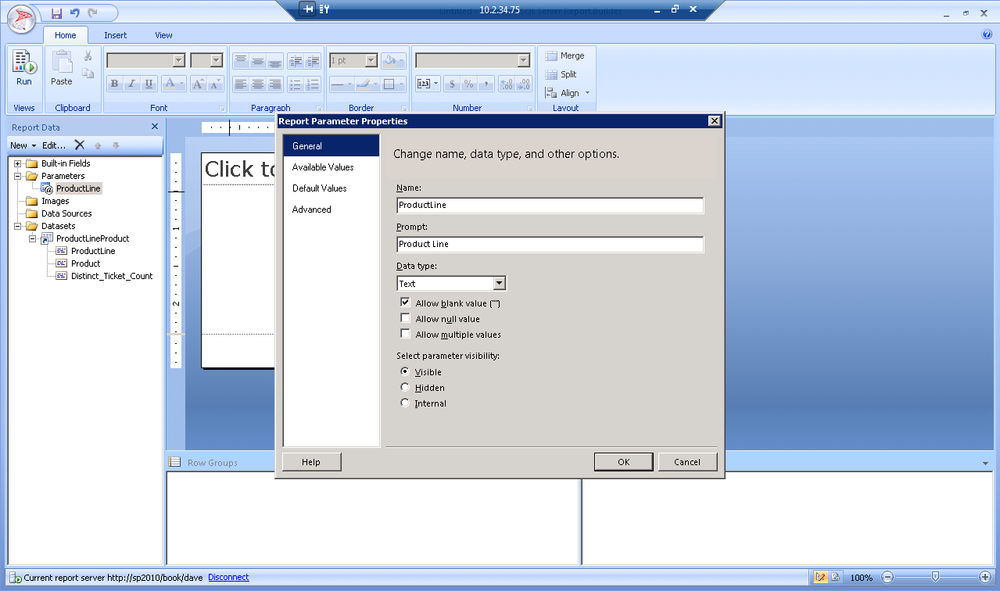
Return to design mode by clicking the Design button on the ribbon. Next, add a parameter to the report by right-clicking on Parameters in the Report Data pane, and choose Add Parameter from the context menu.
You now need to choose a name for the parameter. This will be the name you’ll use on the URL query string when you pass along the value. Next, choose a display prompt, which is the visual display name if a value is manually entered, and then select the appropriate data type, in this case text and, finally, allow blank values. The completed parameter dialog is shown in Figure 26-8.
Applying Dataset Filters
To limit the results of your query, apply a filter to your dataset that restricts the data to only data where the product line matches the parameter passed to our report.
Within the Report Data pane on the left, expand the datasets node, right-click on your data set and launch the Dataset Properties dialog.
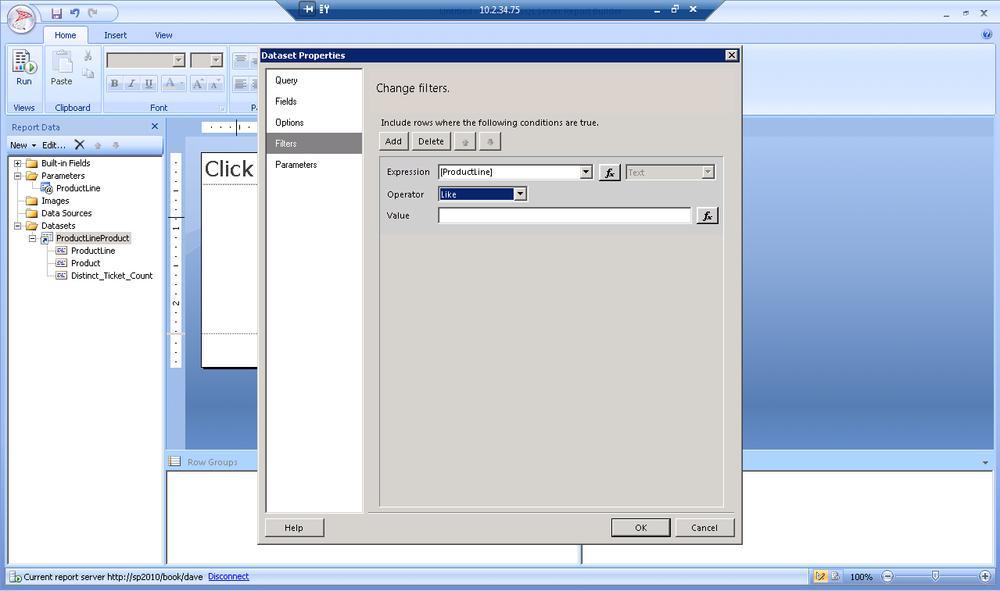
Select the Filters tab, as shown in Figure 26-9.
Add a new Filter.
Choose ProductLine as the expression to filter.
Choose Like as the operator.
Launch the formula builder to define our constraint.
You may wonder why we’ve told you to select Like instead of Equals as your operator. When filtering data from a cube, it’s important to remember that your dimensions are all defined as hierarchies. Therefore, the table name is included as a part of the hierarchy. A good example of this is [Queues][Bikes], where you will be passing online bikes as your product line. For this reason, you’ll want to use a Like operator and apply wildcards in your filter.
Note
It’s also worth considering that your dataset dates will be
returned as text. If you’d like to filter your data for everything
before or after a set of dates, you will need to use the formula
builder to cast your selected column as a date using the CDATE(ColumnName) syntax.
Construct a Filter Expression
Filter expressions are pretty easy once you understand the basic
syntax. The * acts as a wildcard
character matching anything before or anything after the parameter that
we pass in. The % acts as a single
character wildcard.
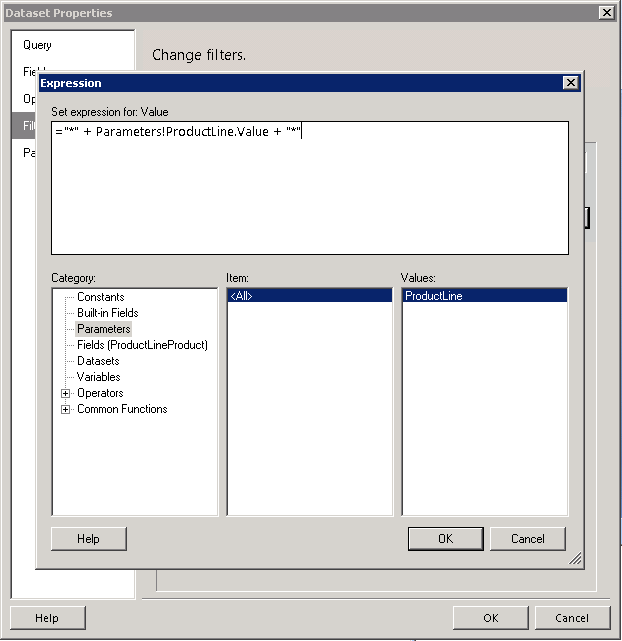
="*" + Parameters!ProductLine.Value + "*"
For example, %o%th* would allow
words such as North or South with anything following them to
match.
Note
You can find more information on the MSDN website.
Let’s use the expression builder as shown in Figure 26-10 to walk through building your filter. All the fields of your dataset, parameters, and common functions are available in the Category pane of the dialog.
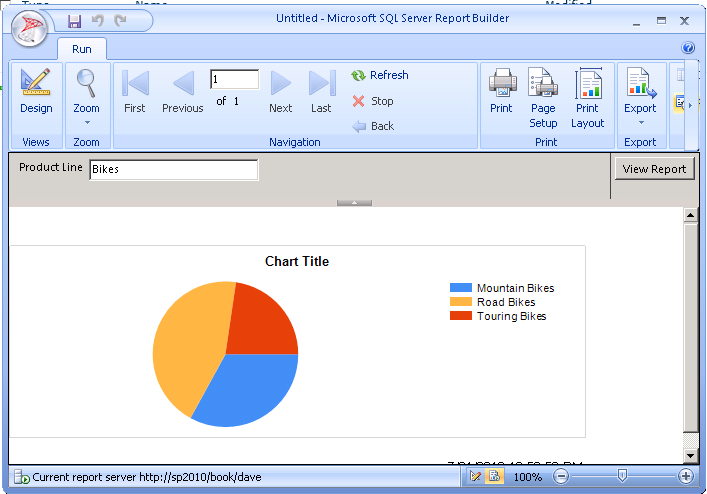
Validating the Parameterized Report
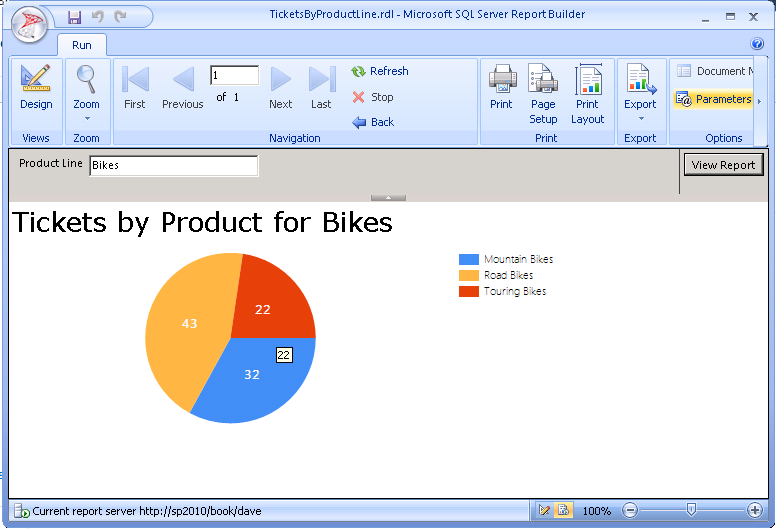
When you run the report, you will be prompted to enter a product line. Enter a valid example such as Bikes and a pie chart of Bikes will return.
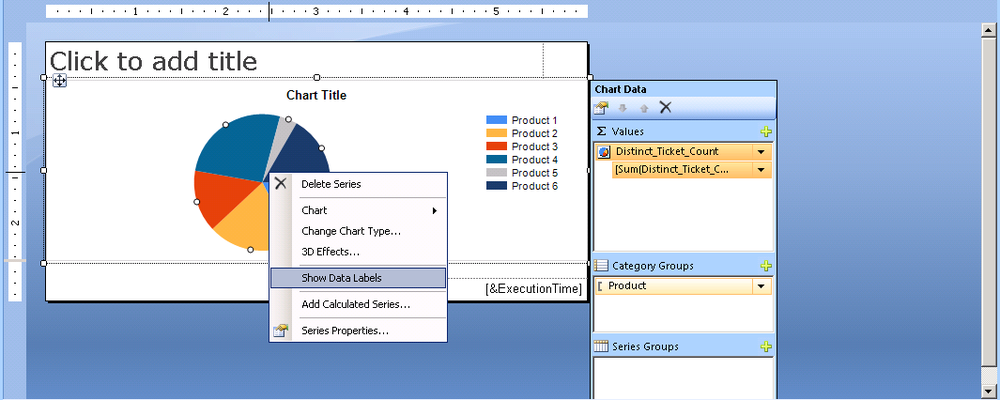
Jumping back into design mode, let’s clean up the chart. Right-click on the chart and select Show Data Labels as in Figure 26-12. From here, you can change many of the properties of your chart.
To complete the cleanup, click on the data labels to select them. You can bold them and format them as white to make them stand out a bit. If you like, you can change the fonts as we’ve used Segoe UI Light for a look that is more consistent with the Windows 8 user interface.
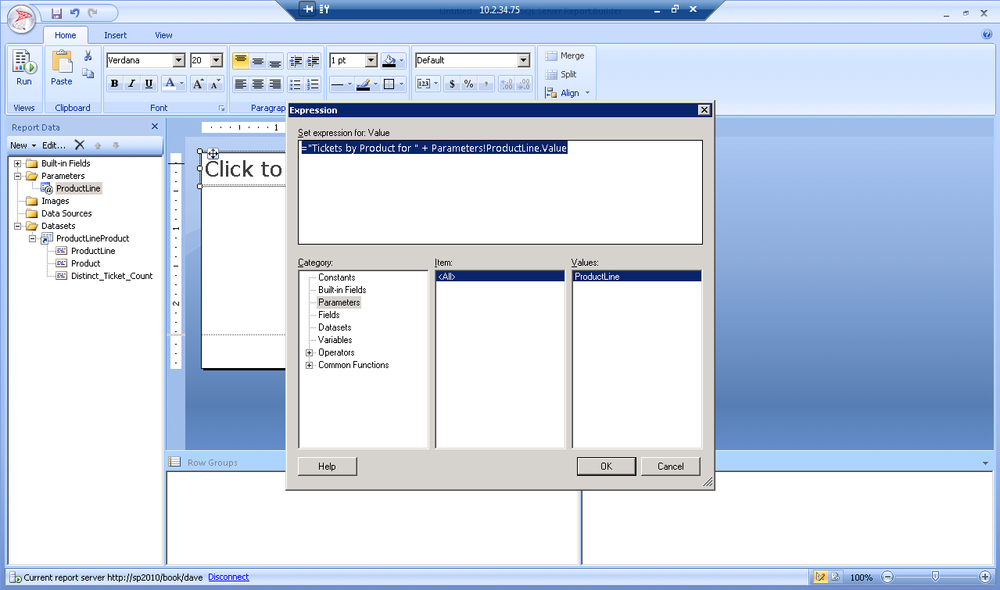
Creating a Dynamic Chart Title
When creating a parameter driven report, you should provide your users with a chart title that clearly articulates the data they are looking at. Reporting Services has a default text-based title at the top of each report. Your chart also has a title on it, which may be redundant.
You could add some text such as “Tickets by Product” with the ProductLine parameter to provide some context on your drill-down report to let people know what they are looking at. This is shown in Figure 26-13.
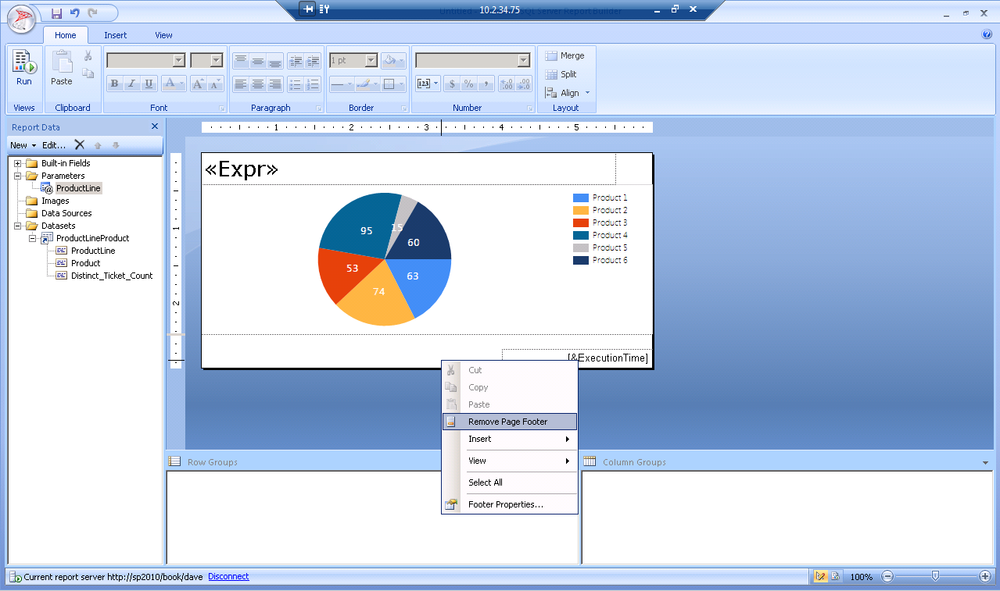
Headers and Footers
For this solution, let’s remove the page footer by right-clicking on the bottom of the report and choosing Remove Page Footer, as shown in Figure 26-14.
For some use cases, it may make sense to append copyright, usage guidelines, or the time that the report was executed in this area. The report headers and footers will be automatically added on each page of your report if you have a multipage report.
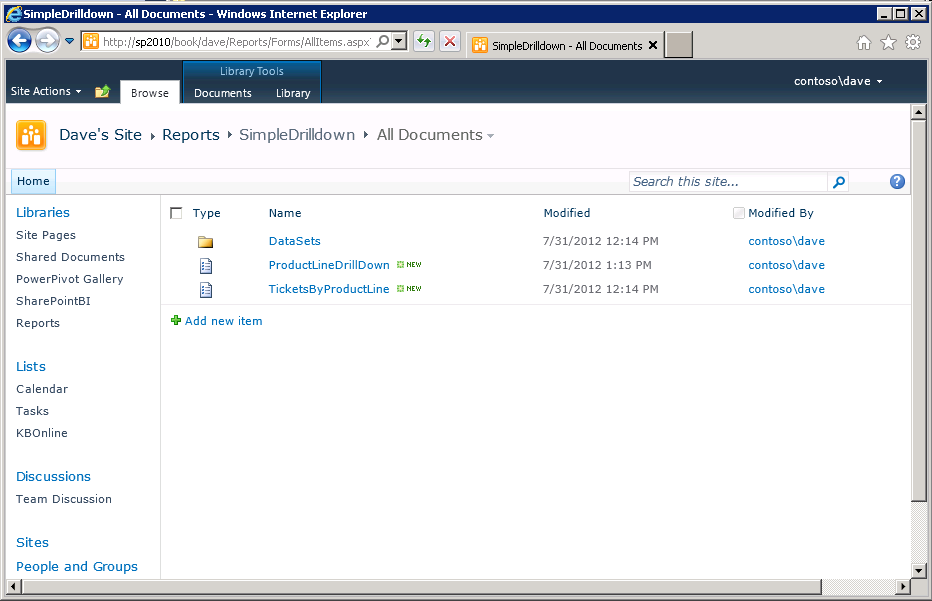
The completed drill-down report is shown in Figure 26-15. Now, save it to your library as a product drill-down and then proceed to wire it up to the summary report you created in Chapter 25.
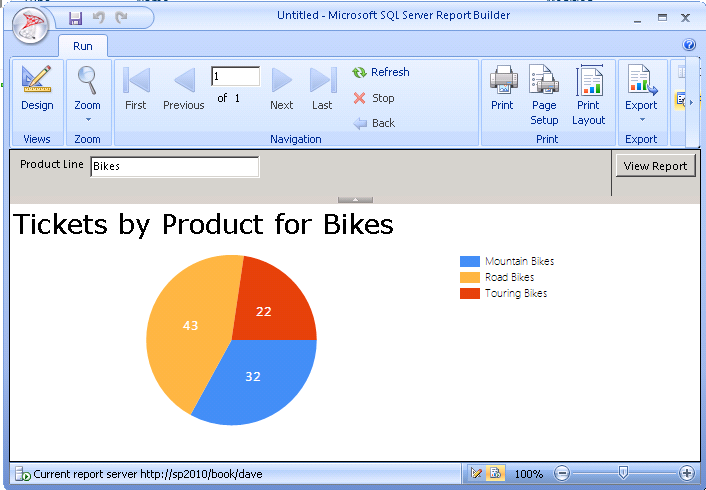
Figure 26-16 shows both reports saved to a SharePoint library. Next, let’s connect these reports to allow for click-through from your Tickets By Product Line report.
Two Approaches to Drill-Down Reporting
Out of the box, SQL Server Reporting Services supports the ability to have basic drill-down reports. When you click on a hyperlink or an area of a chart, you can pass along a parameter and drill down to another report. The client’s browser will redirect to the new report, leaving the context of the top-level report.
While the simple drill-down has great functionality and is fairly easy to implement, sometimes you’ll want to keep the context of the original report and spawn a new window for the drill-down details. A second approach will use some JavaScript to spawn a dialog for a drill-down report and could be used to open any URL while maintaining the context of the original report.
Basic Drill-Down Reports
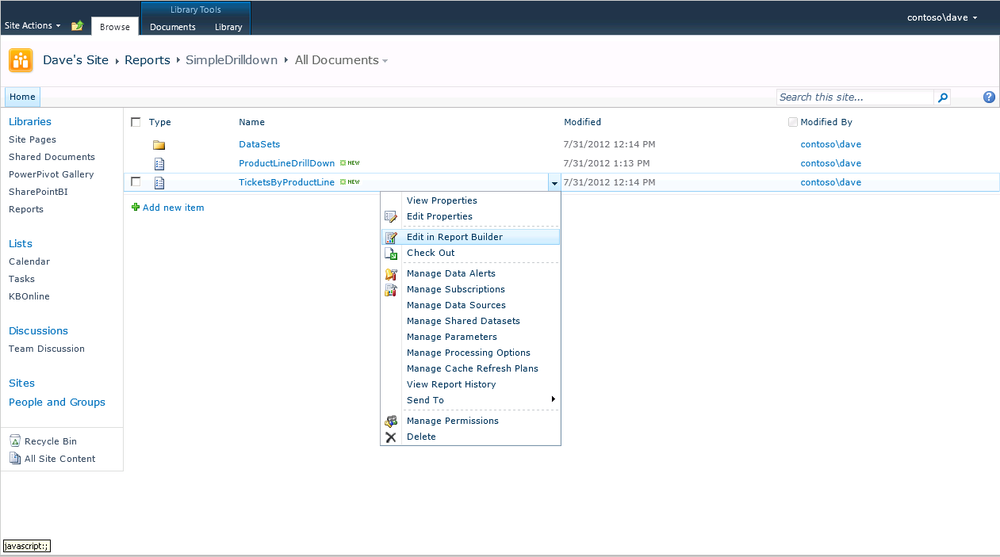
Display the library via the All Documents View from the ribbon.
Activate the Edit Control Block on your basic report.
Choose Edit in Report Builder to launch Report Builder 3.0, as shown in Figure 26-17.
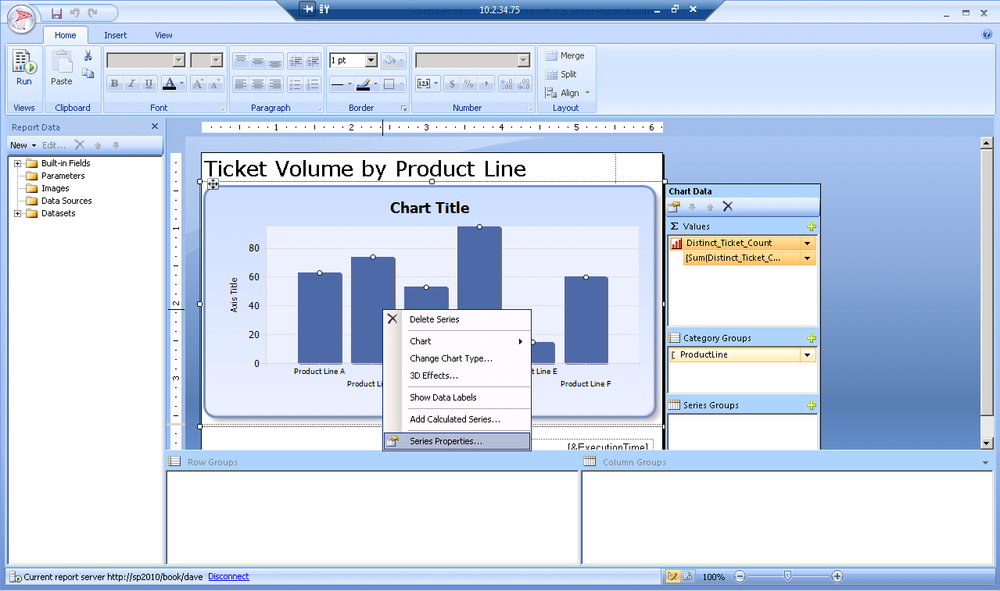
Your original report should now display in the Report Builder editor. Right-click on the chart series and activate the Series Properties dialog, as shown in Figure 26-18.
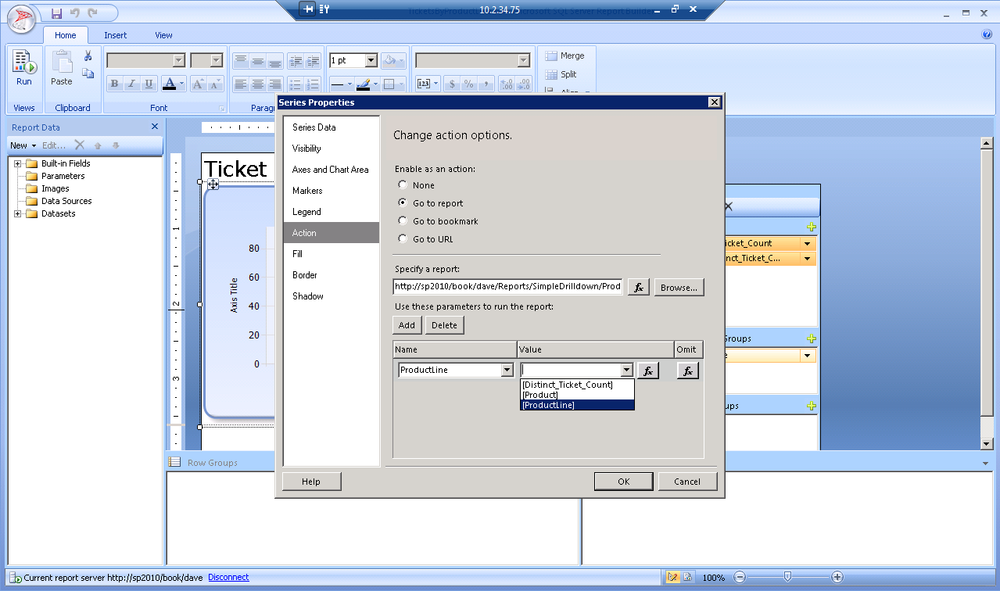
In the Series Properties dialog, select the Action tab, as shown in Figure 26-19. Actions allow you to define what happens when a user clicks on a member of this series in the report at render time.
Select Go to report.
Browse for the path to the drill-down report using the browse button.
Add a new parameter.
Select the name of the parameter (ProductLine in this case).
Activate the drop-down menu to select the value from the items in your current dataset, again ProductLine. This automatically wires your report to pass along the product line value from your series when a user clicks on a member of the chart series.
Now, run the report and try it out. You’ll notice that your mouse cursor now indicates a link when you hover over a chart element, even inside the Report Builder preview shown in Figure 26-20.
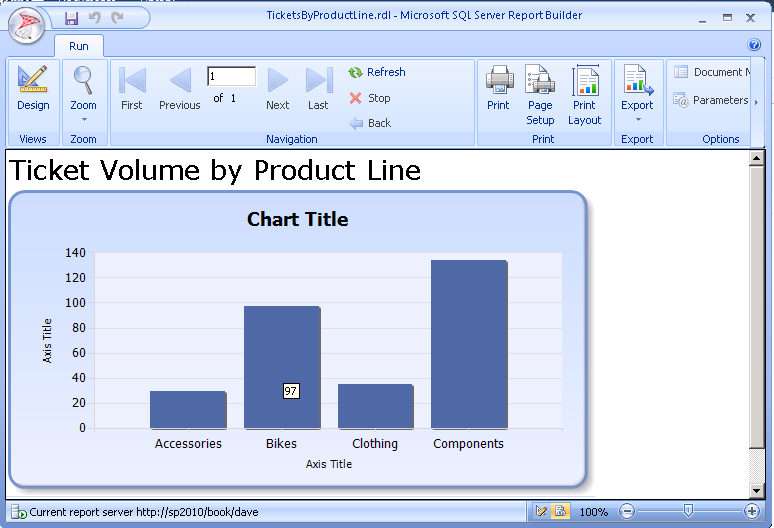
When you click on a chart element, you will drill down, automatically replacing the original report. Don’t forget to save your changes. All this will work the same way via SharePoint.
Advanced Pop-Up Window Drill-Down Report
In this example, we’ll build on the previous drill-down, but will leverage JavaScript and the URL parameter support of Reporting Services Integrated Mode to keep your users in context by providing a drill-down report as a pop-up.
Start in the All Document View of your PowerPivot library.
Edit your main report by launching Report Builder from the Edit Control Block.
Once again, right-click on the chart series to access the Series Properties.
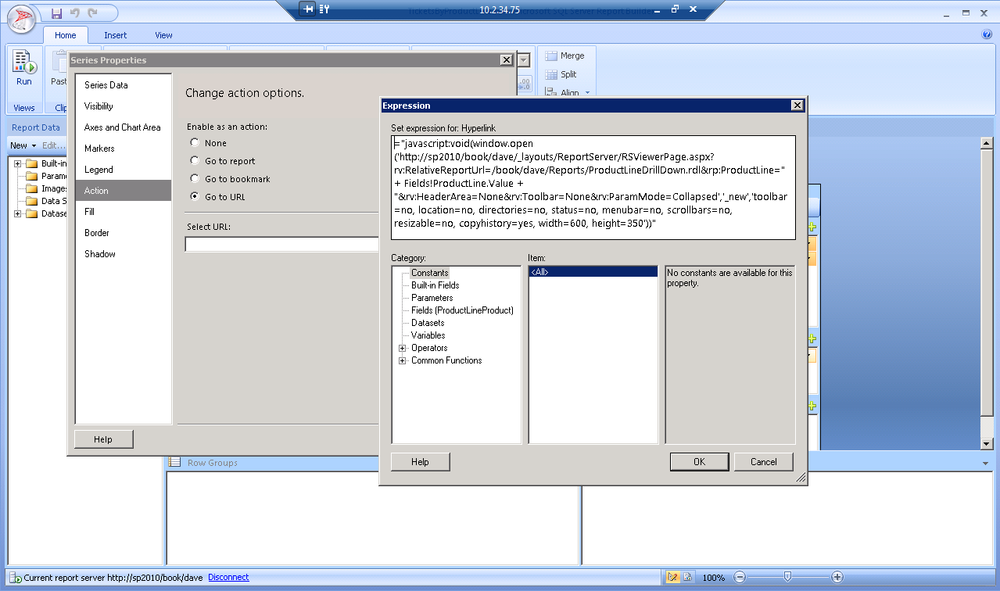
Select the Action tab again, as shown in Figure 26-22.
Instead of selecting Go to report as the action, change it to Go to URL.
Launch the formula builder to create a URL.
Enter the expression in your code example and click OK. Don’t worry; we’ll discuss this expression in detail shortly.
Save the report.
Note
The JavaScript in this example won’t execute in the Report Builder Preview. You need to save the report to SharePoint to see it work.
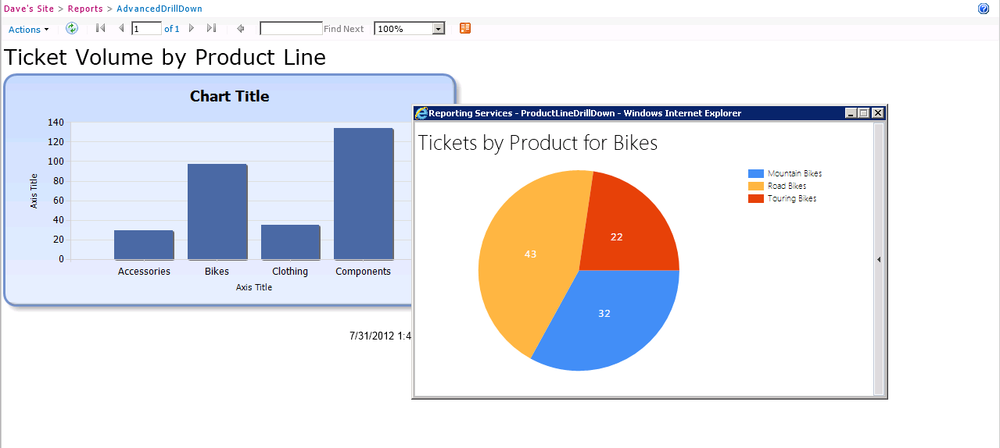
After saving the report, view the report from SharePoint. Simply click on a product line to launch the drill-down report in a pop-up.
Now that you’ve seen an example in action, let’s talk about the details of the expression that was constructed behind the scenes. It is as follows:
="javascript:void(window.open(
'http://sp2010/book/dave/_layouts/ReportServer/RSViewerPage.aspx?
rv:RelativeReportUrl=/book/dave/Reports/ProductLineDrillDown.rdl
&rp:ProductLine="+ Fields!ProductLine.Value + "
&rv:HeaderArea=None&rv:Toolbar=None
&rv:ParamMode=Collapsed','_new','toolbar=no, location=no,
directories=no, status=no, menubar=no, scrollbars=no, resizable=no,
copyhistory=yes, width=600, height=350'))"
Let’s walk though each concept used in this expression. Web browsers
can execute JavaScript in place of a hyperlink by using the javascript: someFunction() syntax:
javascript:alert('hello world')To open a new window in JavaScript, you can use the window.open syntax:
window.open(someUrl, windowName, parameters)
Let’s build the URL to access the Reporting Services report dynamically and add on some special parameters that Reporting Services Integrated Mode accepts for URL access. Start with the URL to the Reporting Services viewer page that you are able to grab by browsing to your report inside SharePoint.
The ? begins the URL parameters
that we are passing in.
Parameters beginning with rv: are
Report Viewer parameters. For instance:
RelativeReportUrl=sets the path to the Reporting Services report.HeaderArea=Nonehides the header at the top of the report.Toolbar=Nonehides the toolbar.ParamMode=Collapsedhides the parameter area.
Parameters beginning with rp: are
the parameters that the report itself is looking for. Set the ProductLine parameter using the value of the
Productline field in our dataset by
appending it to our expression:
ProductLine= +
        Fields!ProductLine.Value
"'http://sp2010/book/dave/_layouts/ReportServer/RSViewerPage.aspx?
rv:RelativeReportUrl=/book/dave/Reports/ProductLineDrillDown.rdl
&rp:ProductLine=" + Fields!ProductLine.Value + "
&rv:HeaderArea=None&rv:Toolbar=None&rv:ParamMode=Collapsed"
Now, let’s set a bunch of optional parameters to control the look and feel of the new window:
'toolbar=no, location=no, directories=no, status=no, menubar=no,
scrollbars=no, resizable=no, copyhistory=yes, width=600, height=350'
Finally, by wrapping the entire window.open function inside the void() function, you are able to tell the
browser not to redirect to a new URL when someone clicks on the
hyperlink.
Summary
If you are a beginner with Reporting Services, you may want to try these examples a few times to become comfortable with the techniques. In this chapter, you created and styled charts by leveraging the Report Builder designer. You created both simple drill-down capability, as well as leveraged JavaScript to keep your users in context and open up a URL in a pop-up window.
In the next chapter, we’ll discuss other uses of Reporting Services including leveraging subscriptions to deliver your reports on a schedule, and data alerts to inform your users to conditions in the data.