Chapter 27. Subscriptions and Data Alerts
Report Subscriptions and Delivery
A subscription is a schedule task to process or deliver a report at a specific time or in response to an event. Report subscriptions can be delivered in any supported file format as defined in the subscription. Rather than having users navigate to your reporting site to request a report on demand, subscriptions can be used to schedule and automate report delivery.
How Does It Work?
The report server has a scheduled job to process the report and then distribute the result via delivery extensions that are deployed on the server. Delivery extensions are an extensibility point where you can create your own; but out of the box, you can create subscriptions that send reports to a shared folder (UNC path) or to an email address. When the report server is configured for SharePoint integrated mode, as yours is or will be, you can also send a report to a SharePoint library on a schedule. Each delivery extension supports a number of delivery options that must be set up at the time that you schedule your delivery, such as the email address or SharePoint path you want the report sent to. This is powerful for business activities that require regular monitoring. We’ve seen this used to provide weeks of cost reports delivered on demand to a SharePoint library or application error reports delivered to the administration team.
To create a subscription, the report must store the credentials required to access the data source because there is no interactive user. The credentials are stored encrypted in the report server. You must have permission to view the report and create individual subscriptions.
If your report has parameters, you can subscribe to a report multiple times with different report parameters. For examcreating_a_new_queryple, you could create a Product Line Ticket Status report that takes a Product Line parameter and subscribe once for each product line for which you’d like to receive daily updates.
Setting Up a Report
In the past two chapters, we’ve walked through the process of creating reports so we won’t repeat every step and will only focus on the couple of key things you need to know to do this example.
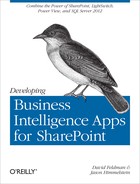
Start by creating the dataset you’d like to use in this report. You should have a single parameter to filter the Product Line member of the Queues dimension for everything that contains the parameter you’re passing in. In the query, you should have two measures: Distinct Ticket Count from the Tickets dimension and Latest Ticket Date from the Queues dimension. Now slice those measures using Queue Owner, Product Line, and Product from the Queues dimension. This query is shown in Figure 27-1. Let’s save this dataset as Ticket Queue Status because you will be using it to monitor the status of your Queues.
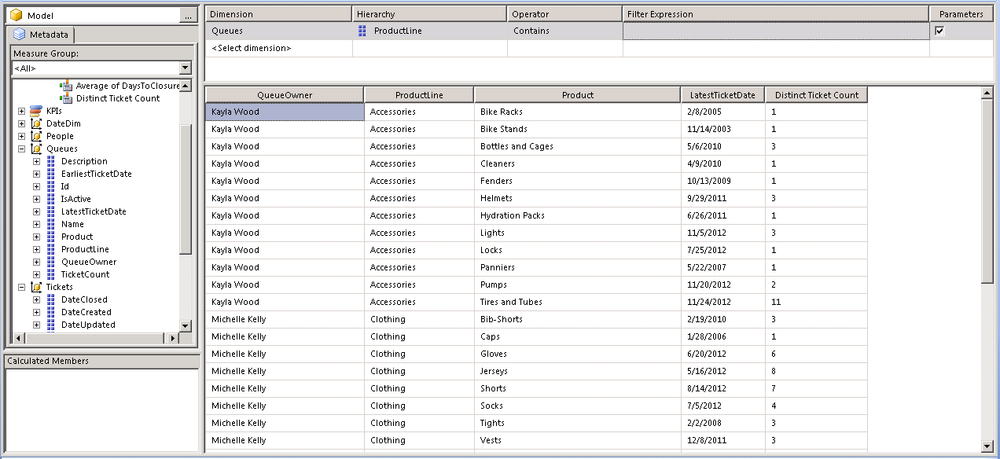
To keep the example simple so that we can focus on subscriptions and alerting, let’s create a basic table report this time. You can see in Figure 27-2 that we suggest formatting this report as a flat table without subtotaling to provide a nice simple view of the status of each queue. This report can be filtered by providing a product line such as bikes if you’re looking at this from a product line manager perspective.
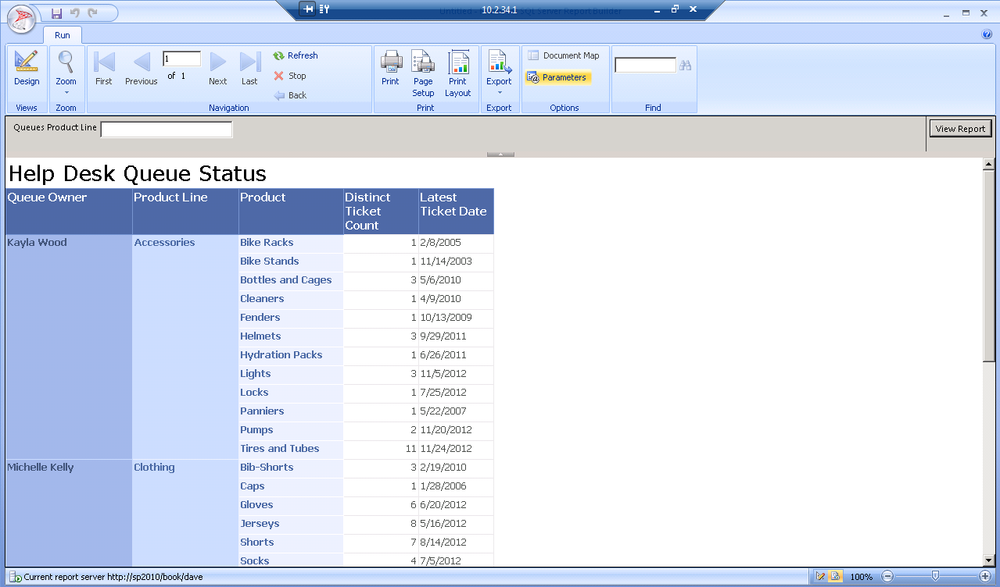
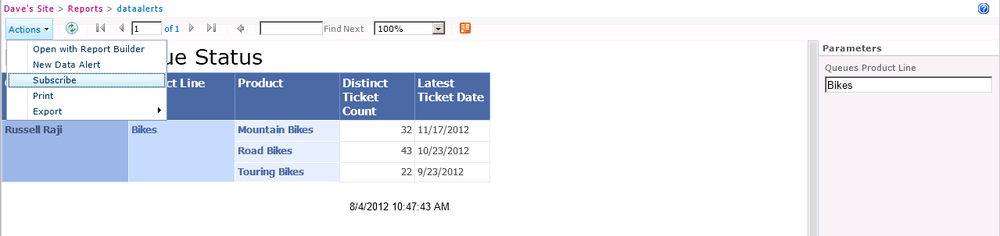
After you save your report to SharePoint, you can return to your report library and click on the report to view it. Once you have the report open, you can provide your filter parameter using the Parameter pane to the right of the report. In Figure 27-3, you can see the results of filtering by the Bikes Product Line. After rendering the report, you may want to set up a subscription. Next, simply choose Subscribe from the Actions menu.
In Figure 27-4, you’ll see the details of the SharePoint document library delivery extension. Then enter the filename, the title for the file in your SharePoint library, and choose the output format. The output format will show you all of the rendering extensions that you have installed. Out of the box, you have a good variety with Office 2007 Word and Excel formats, the Office 2003 Word and Excel formats, PDF, MHTML archive, HTML 4, TIFF, CSV, XML, or a data feed.

Some of these are end-user-ready report types and others offer snapshots of your data, making report subscriptions an option when sending data from one solution to another. For example, you could deliver a CSV or data feed of your inventory data to an external facing SharePoint site for a partner to pick up on a nightly basis.
Next let’s define options to overwrite previous reports, not overwrite a report if it exists, or uniquely name them by appending onto the filename. Back to the scenario of placing this file on an Internet-facing SharePoint site, you might choose to always overwrite the same file if an automated task was picking up your file. A different scenario is that you may want to archive a file with current ticket counts each week and store them for archival purposes.
The next section window defines the event that will trigger delivery of the report. The shared schedule and custom schedule are relatively self-explanatory. A shared schedule allows us to define some common scenarios that may be used for report delivery and define it once. You could define a shared schedule for “Nightly at midnight” and another shared schedule for “Every Sunday.” The custom schedule lets you create a schedule just for this subscription. The remaining delivery event specifies that when report snapshot data is updated, then this report subscription will run as well. If you aren’t familiar with report snapshots, don’t despair—we will dive into the details of report snapshots shortly.
The final section of the Subscribe page deals with report parameters. Each parameter on the report will be listed here allowing you to specify what data you’d like included in your delivered report. For example, you could specify Bikes if you wanted this report delivered to you for the Bikes product line.
While exploring the SharePoint delivery extension, you’ve seen that each delivery extension has different options tailored to the needs of email delivery, file path delivery, or even the NULL delivery extension whose purpose is simply to refresh the report cache for long-running reports. It’s that easy to set up a report subscription and any user can create one to meet their needs.
Note
If you are looking for your report and don’t see it, keep in mind that the scheduled execution time is based upon the time zone of your SharePoint server.
After a subscription is created, how do you manage it? From the All Items view of your PowerPivot library pop-up window, the Edit Control Block will give you the ability to Manage Subscriptions or any other report services–related option, as shown in Figure 27-5.
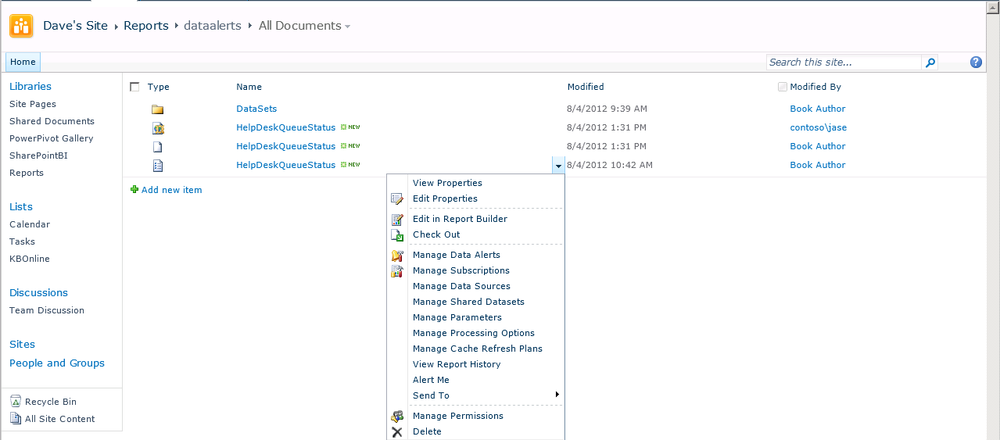
When discussing delivery events, we mentioned report snapshots. From the same Edit Control Block shown in Figure 27-5, you can access Manage Processing Options where you can configure cache and snapshots (see Figure 27-6). By default, when your report executes, it runs your query against the data source, in this case a tabular cube. If you were running against a data source, slower performance cache or snapshots allow you to run the query once and have all report renderings use the saved results.
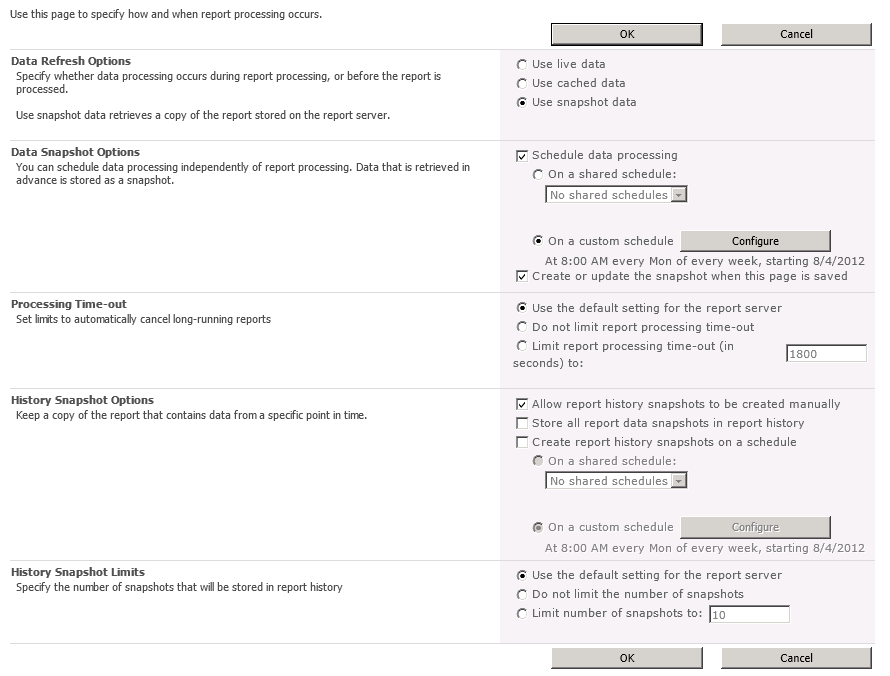
Unlike on-demand reports, which get up-to-date query results at runtime, snapshots are processed on a schedule and then saved to the report server. When you select a report snapshot for viewing, the report server retrieves the stored report from the report server database, and shows the data and layout that were current for the report at the time the snapshot was created. Report snapshots are not saved in a specific format. Instead, snapshots are rendered only when a user or an application requests it.
What is the difference between using a snapshot and using cached data? For cached reports, each combination of query parameters creates a new cached instance. It is possible to store a cached instance for every combination of query parameters for a given report. Snapshots always use default parameter values when processing the data. If you use a snapshot, makes sure that you use filter parameters instead of query parameters to filter your dataset.
Common Scenarios for Subscriptions
There are several common scenarios for subscriptions. We’ve outlined a few that you’ll be sure to encounter.
End users can view the results of a report offline by selecting PDF, Microsoft Excel, Word, or Web archive and send the results directly to a shared folder, SharePoint library, or email address. This is a great technique for large reports that take too long to load in a browser.
Email reports to individual users and/or distribution groups. If you want to send the same report to a group that has a changing list of members, you can use a query to derive the subscription list at runtime.
Data-driven reports let you customize the report output, delivery options, and report parameters at runtime. The subscription uses a query to get the input values from a data source at runtime. Use this technique to dynamically build a distribution list for your report. As an example, consider sending a report nightly to anyone with tickets over a day old in their help desk queue.
Preload the cache for long-running reports. If you have a large number of report viewers with long or complex queries, preload the data into the cache to reduce the time needed to render the report.
Data Alerts
Report subscriptions are a great solution for getting a report delivered to you on a schedule. To take this to the next level, we will look at a new feature of Reporting Services 2012: data alerts. Reporting Services data alerts are a data-driven alerting solution that informs you about report data that you care about when you need to care about it.
Data alert messages are sent by email. We can configure alerts to send messages more or less frequently and only when results change. You can also include your team on the alert. Instead of just getting a standard report delivered to you, data alerts can tell you when the data in your report crossed predefined boundaries. For example, it could let you know if your stock portfolio is up by 20%.
How Data Alerts Work
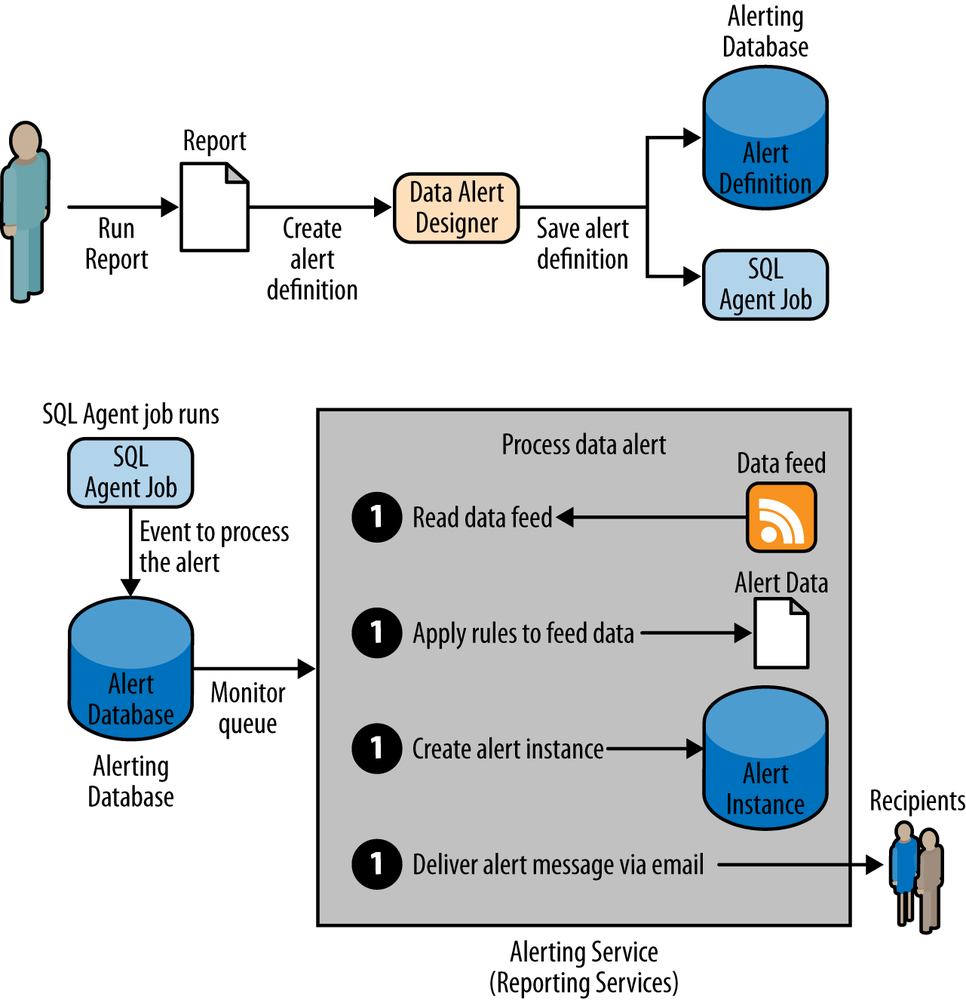
At design time, the data alert designer allows you to define a set of rules against the data from your report (see Figure 27-7). These rules are basically simple criteria such as equals, not equal, contains, greater than, less than, and so on. The criteria available are determined by the data type of the measure you are creating the alert against. Also at design time, a schedule is determined for the alert. The schedule can range up to weekly and can run as often as every minute.
At runtime, the SQL Server agent kicks off the process by dropping an alert into the monitoring queue. An OData feed is generated for the report and the rules are compared to the result data. If an alert is required, then an alert instance is created in the database that will be picked up and delivered via email.
As you can see, this is a pretty simple process but a very powerful way to know when our data exceeds predefined boundaries that cause us to receive an alert. To get the best alerting experience, you may find that you need to add new measures to your data source such as New Ticket Count or Today’s Average Time to Closure - design measures that you can easily compare to get the alerts you need.
Managing Data Alerts
As the owner of the data alert, you can view information about your data alerts and delete and edit your data alert definitions (see Figure 27-8). An alert is implicitly owned and managed exclusively by the person who created it.
Alerting administrators who have the SharePoint Manage Alerts permission can control all data alerts at the site level. They can view lists of alerts by each site user and delete alerts.
Keep in mind that Reporting Services data alerts are different from SharePoint alerts. SharePoint alerts are created on any document type, including reports, but are sent when the document changes. With data alerts, we are able to set up a series of rules that are processed against the data resulting in the emailing of a notification when the rules are met.
Creating a New Data Alert
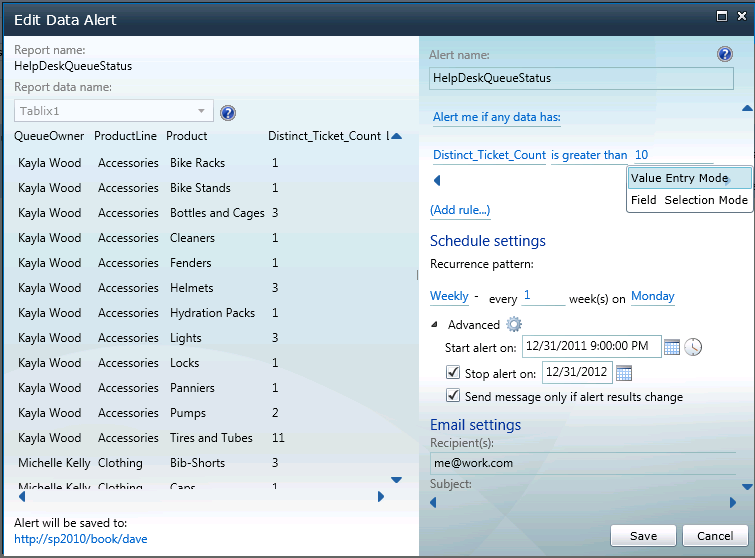
Creating a new data alert is as easy as choosing New Data Alert when viewing the rendered report. The New Data Alert/Edit Data Alert pop-up is a Silverlight application that you can use to define your data alerts. The left-hand side of the window lets you choose which item in the report you want to leverage the data from. In this case, let’s use the Tablix control that renders this solution’s table of data. A preview of the report data is shown on the bottom left. On the right, define each of your rules by doing the following:
Choosing the measure, such as distinct_ticket_count
Picking a comparison such as equal, greater, contains, etc.
Defining the value to compare the measure against
If you hover the mouse over the comparison value, a hidden menu appears allowing you to choose between comparing against a static value or comparing against another field. This is really powerful if you have a measure containing your goal and another measure containing your actual value.
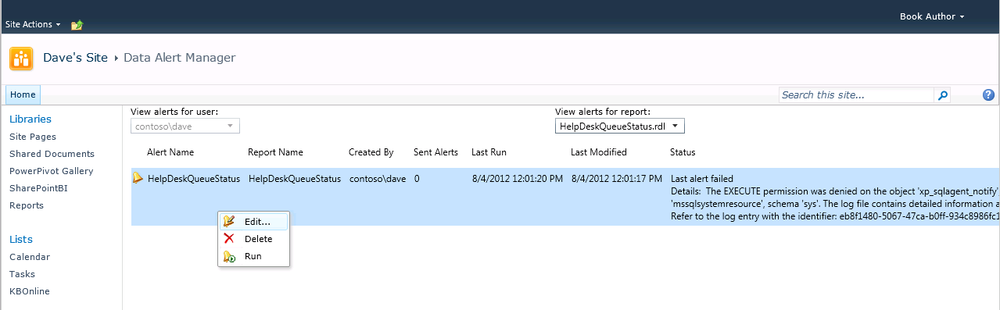
Managing existing reports is done from the Edit Control Block (ECB) in the All Items view of your library. The user interface on the Data Alert Manager is a bit inconsistent with SharePoint. Save yourself time looking for an ECB or a link on this grid of alerts; instead, right-click on a row to reveal the ability to edit or delete your existing data alerts as shown in Figure 27-9.
Data alerts are sent via email so make sure that your SMTP server is specified in the Reporting Services service application. All configuration settings are now part of the service application in Central Administration. See Part V of this book for guidance on setting up the Reporting Services service application.
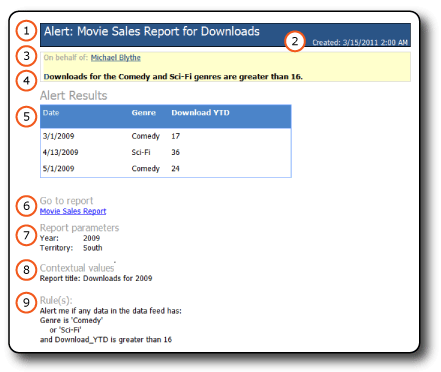
For clarification, let’s walk through the sample data alert shown in Figure 27-10.
Title of the data alert as specified at design time.
Date and time the alert was processed.
On behalf of the data alert owner.
The list of rules specified in the alert definition.
A tabular representation of the data that satisfied the rules to trigger the alert.
A link to go visit the report.
The parameters that the report was run with when triggering the data alert.
Contextual values show the name and values of report items that are outside of the report data. This is often the name or description of a report.
List of the defined alert rules.
Summary
In this chapter, we explored subscription, data alerts, snapshots, and caching of data on the report server. All of these techniques can be used to enhance your solution by delivering data on demand when you in need it, in the format you need. Whether you use subscriptions for formatted report delivery or data alerts to monitor your data and alert you when action is needed, these are great tools to incorporate into your application. We have now completed interactive reporting with Excel, and formatted the report and set alerts with Reporting Services. Your solution looks great. In the next chapter, we explore a new addition to the Microsoft SharePoint Business Intelligence suite named Power View. Power View adds interactive data exploration capabilities.