
Chapter 37. PowerPivot Service Application Configuration
Now that the PowerPivot SQL Server Analysis Services instance is set up, it’s time to move into SharePoint where the application configuration will be done.
In this chapter, we will cover:
PowerPivot Management Dashboard configuration
Request allocation
Load balancing
Caching: xVelocity versus disk cache
PowerPivot Management Dashboard usage
When you first go to Central Administration after the initial configuration of the PowerPivot Service, you will get a pop up on the PowerPivot Management Dashboard (see Figure 37-1). The error is in regard to refreshing external data sources.
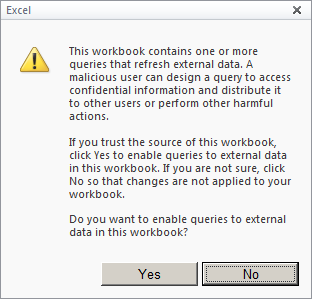
PowerPivot Management Dashboard Setup
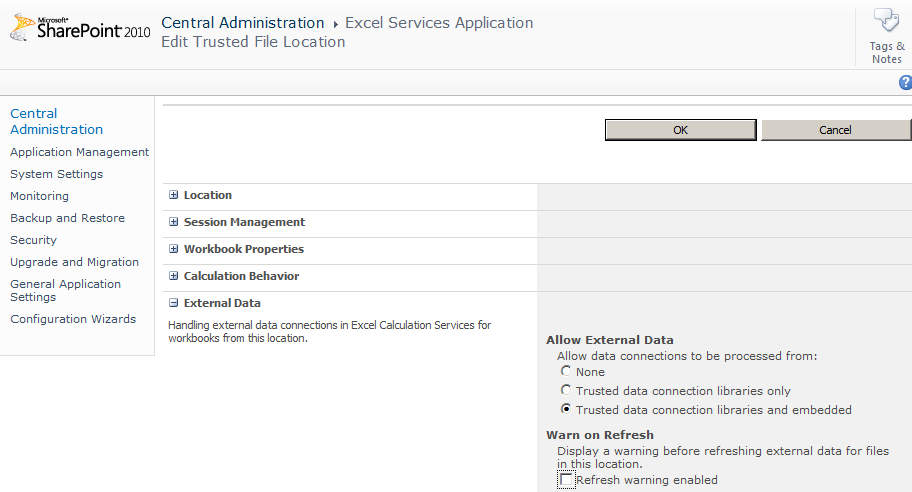
In reality, this is not an error. Excel is letting you know that you are about to refresh from an external data source. The issue here is that this will show up on every PowerPivot workbook because that is exactly what PowerPivot does; it refreshes data from external sources. This can be changed in Excel Services by unchecking the “Warn on Refresh” option, as pictured in Figure 37-2.
It is not uncommon for the error in Figure 37-3 to show up when you start using the PowerPivot Management Dashboard as well.
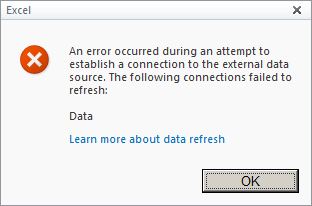
If you receive this error, check to make sure that:
The Claims to Windows Token Service (C2WTS) is running on the server where Excel Services is hosted
The server is connected to the network and has access to an Active Directory Domain Controller
The user running the IE session is a domain user with the proper credentials
This has been a common enough occurrence that Dave Wickert and Lee Graber of the PowerPivot Product team have blogged about.
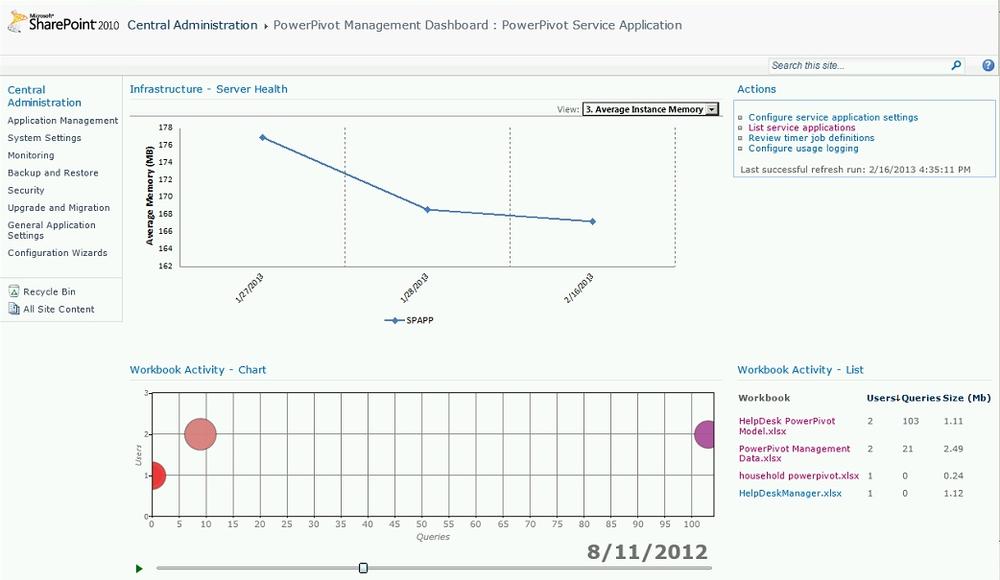
Once these settings are properly configured, you will be able to access the PowerPivot Management Dashboard (Figure 37-4) and drill in on the performance and activity of your PowerPivot implementation.
It was mentioned in the previous chapter that PowerPivot is not supported under claims-based authentication web applications; however the above reference points out the C2WTS service. It should be known that while claims authentication is not supported as a method of authentication for sites hosting PowerPivot workbooks, it is the method of communication used between Excel Services and the PowerPivot service applications on the back-end.
Request Allocation
SharePoint’s Service Application architecture has been designed to allow the system to handle load balancing autonomously in a round robin fashion. While this works well for the majority of Service Applications, PowerPivot is not one of them. PowerPivot has implemented changes in version 2 that allow us to better perform allocation requests to the best possible server running a PowerPivot Service Application.
In PowerPivot version 1, we were introduced to the xVelocity, the in-memory data compression and processing engine. Processing metrics varied considerably depending on the degree of redundancy in the original data sources: the higher the redundancy in the data, the faster the processing.
With PowerPivot version 2, Microsoft has expanded the xVelocity engine and given it a new name: xVelocity In-Memory Analytics Engine.
Load Balancing with xVelocity
Let’s take the following scenario: PowerPivot is relatively heavily utilized at CompanyS and as a result, the ITPros have deployed three instances of PowerPivot into their enterprise farm. Program Management Office (PMO) users are the heaviest users by far at CompanyS and their PowerPivot models can range from 50 MB to 250 MB in size. Operations (Ops) has recently adopted PowerPivot and is starting to ramp up, but their workbooks are still ranging from 5 MB to 20 MB in size.
Jean from the PMO opens her first PowerPivot workbook (250 MB) at 9:00a.m. to start work. Frank from Ops opens his first workbook (5 MB) at 9:05a.m. Jean and Frank open workbooks of similar size to their first every 5 minutes for 3 hours.
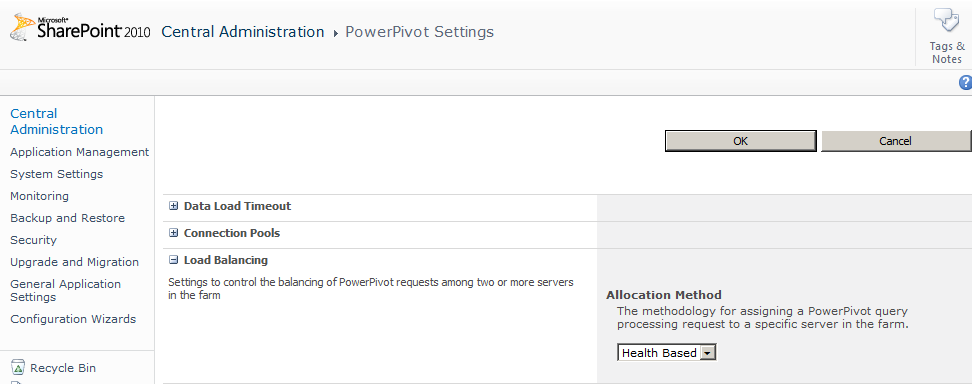
Using a round robin style load balancing scheme, the server that Jean is hitting now has 9 GB of PowerPivot data in the xVelocity cache while the server that Frank is hitting has a mere 180 MB in the xVelocity cache. This is suboptimal from a performance perspective and can be easily remedied by switching to health-based load balancing.
Note
This issue is resolved with PowerPivot version 2 in the form of health-based load balancing (Figure 37-5). It is now the out-of-the-box default.
Caching: xVelocity Versus Disk Cache
Another consideration is disk caching with the xVelocity In-Memory Analytics Engine. Let’s consider our existing scenario with Jean and Frank.
Under PowerPivot version 2, Jean and Frank have a healthy PowerPivot infrastructure that is supporting their requests. After the first day of opening these workbooks, both Jean and Frank come back to work on the second day and look to open these workbooks again. The automated data refresh on half of these workbooks are set to run nightly outside of business hours and the other half are set to run either weekly or monthly.
With disk caching in place, when the request is made to open the workbook, the PowerPivot engine checks to see if the data already exists in the xVelocity cache. If the data exists, a new user connection is initiated and the data is pulled directly from the cache and sent to the user. If the data doesn’t exist or has been changed since it was last pulled into the cache, a new request is sent and the load balancing takes over to ensure that the user is hitting the best resource available.
PowerPivot version 2 is set by default to keep data in memory for 48 hours before the data is unloaded out of active memory. The disk cache is written to the %SystemDrive%Program FilesMicrosoft SQL ServerMSAS10_50.POWERPIVOTOLAPBackup folder upon initial load and is not referenced unless the in-memory cache has been unloaded. After three days of being unloaded and not used, the disk cache files are purged. This gives the user five days of in-memory or on-disk cache before having to go back to the source system to pull the data again.
As a result of this long data life, the RAM and storage stories must be examined. If you have a large number of sizable PowerPivot models, then you are going to require a significant amount of RAM and a reasonable amount of disk to support the two days in memory and five total days on disk for each workbook. This makes monitoring your PowerPivot infrastructure of critical importance.
All of the settings we’ve discussed are configurable in the PowerPivot Service Application settings and should be examined to ensure that they meet your business needs. Additionally, it is important to review the business hours settings to ensure that the automated data refresh option that is frequently selected to refresh data outside of business hours is valid. If your business operates 20 hours a day, it might not be a good idea to allow PowerPivot Data Refresh to happen during peak times for the third shift.
Using the PowerPivot Management Dashboard
Significant improvements have been made to the PowerPivot Management Dashboard to make it a more useful administration tool for the ITPro and delegated PowerPivot administrators. The following are some of the more granular controls that are enabled in the Management Dashboard.
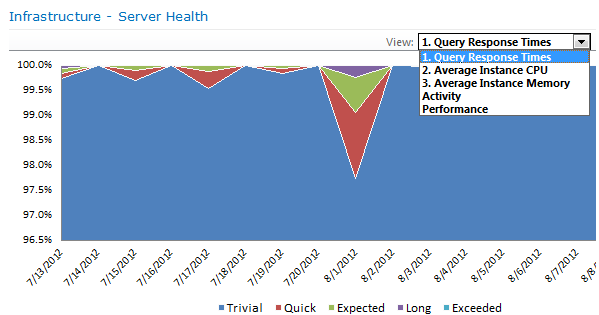
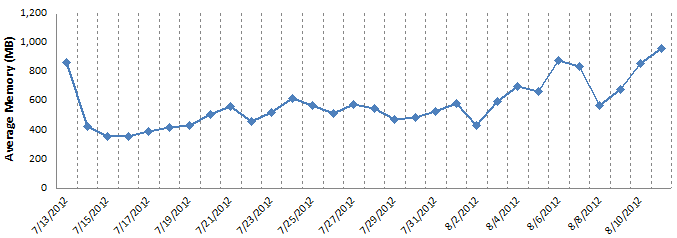
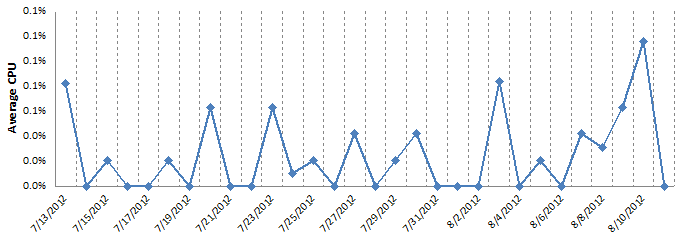
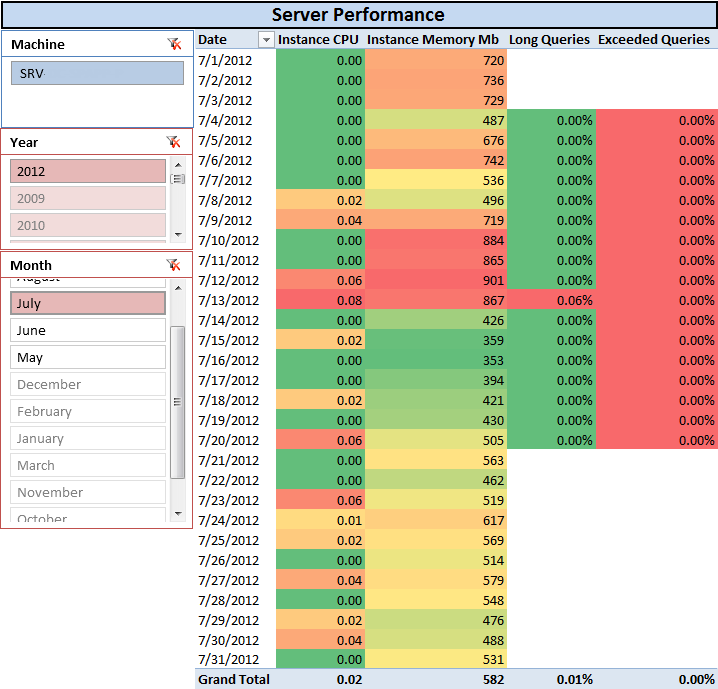
In the Infrastructure – Server Health dashboard that identifies Query Response Times (Figure 37-6), Average CPU (Figure 37-7), Average Instance Memory (Figure 37-8), Activity (Figure 37-9), and Performance (Figure 37-10), we get a granular look at what is happening with the PowerPivot Service Application and can trace issues to a root cause.
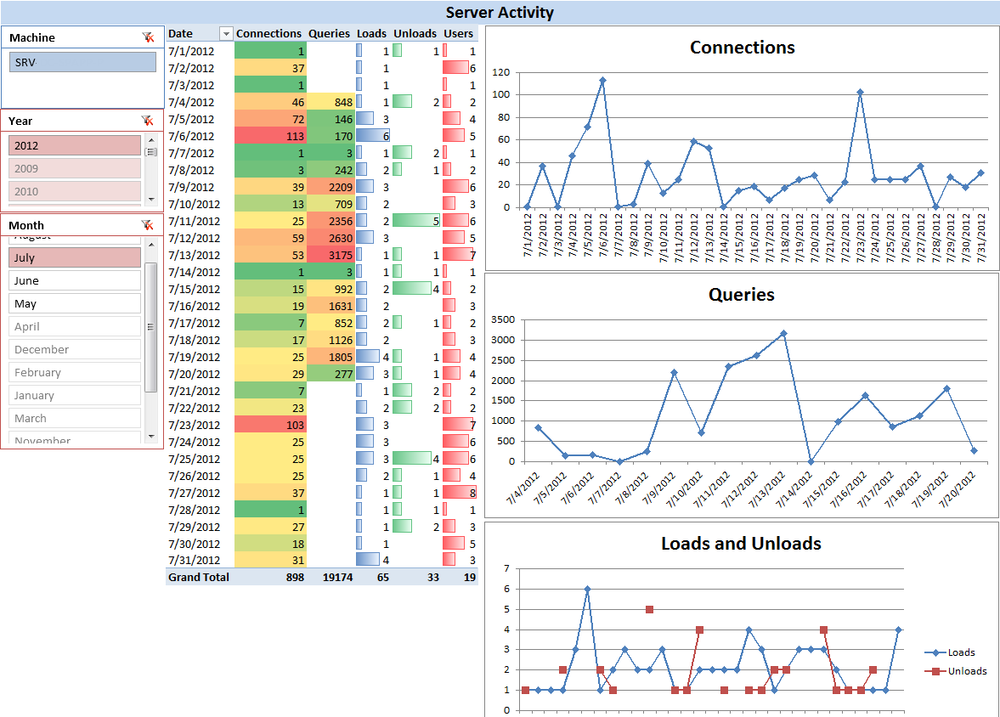
The Dashboard also shows workbook activity as a bubble chart that is viewable as a trend-over-time analysis of how many users versus how many queries by day. Data refresh statistics for successes and failures as well as overall workbook activity is also viewable here. The reason for the granularity in reporting is to allow ITPros to analyze and determine if a PowerPivot workbook should be promoted to a full Analysis Services cube.