
Unfortunately, I cannot really answer that question, as several hundred metrics are available. The following list shows in which areas metrics are available:
- Analysis services
- API management
- Automation
- Autoscale
- Batch
- Cache (Redis Cache)
- Classic compute (Azure VM)
- Cognitive services
- Compute (Azure VM)
- CosmosDB
- Data Lake Analytics
- Data Lake Store
- Database for MySQL
- Database for PostgreSQL
- Device Provisioning Service (Azure IoT)
- Event Hub
- ExpressRoute
- IoT Hub
- Logic apps
- Network – public IP addresses
- Network – load balancer
- Network – traffic manager
- Network – virtual network gateways
- SQL database
- Storage
- Web apps
Enough of the theory, let's just take a look at how it works.
Here is a brief demonstration:
- Open your Azure management portal at https://portal.azure.com.
- In the navigation area of the portal, click on Monitor.
- This opens the Monitor dashboard, as shown in the following screenshot:

- In the navigation area of the dashboard, click on Metrics.
- This opens the metrics selection dialog.
- The values for the Subscription selection field are preallocated, so you must first select a Resource group as shown in the following screenshot:

- Next, you have to select a Resource type as shown in the following screenshot:
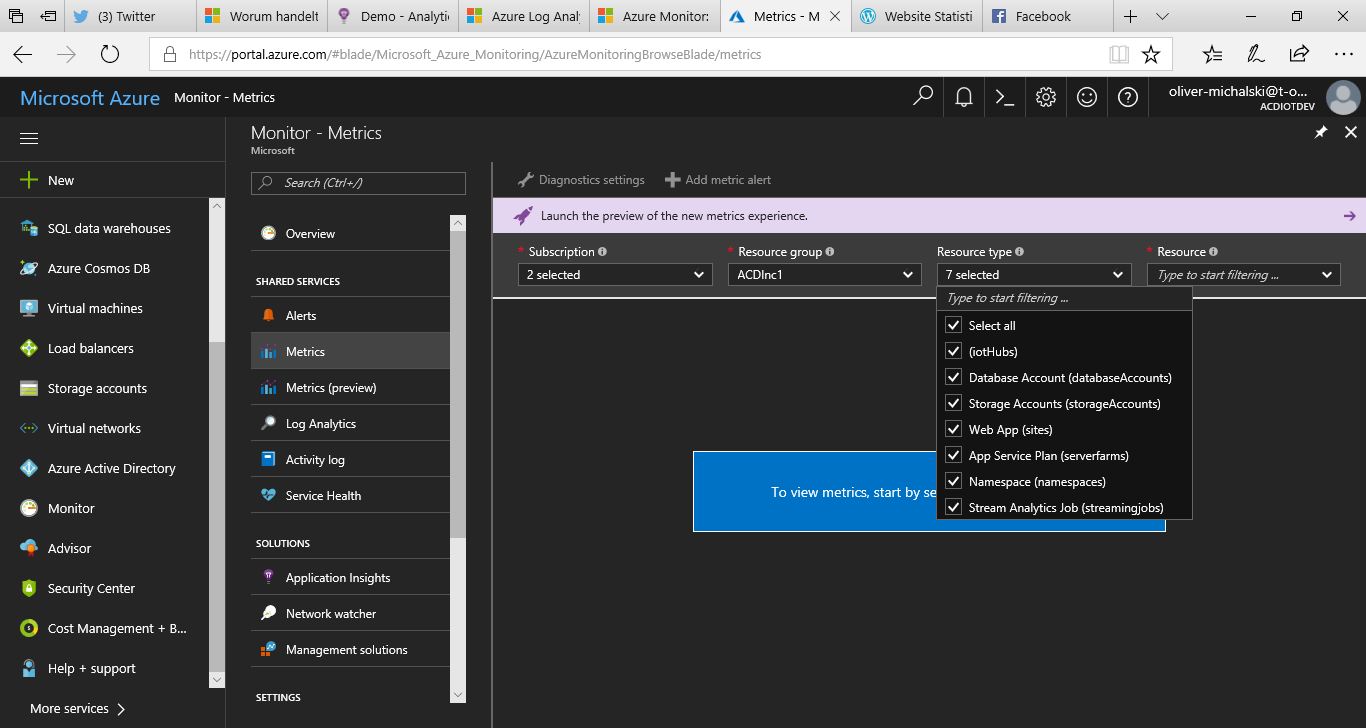
- The last choice you have to make concerns the actual resource. Once you have made a selection, all the metrics available for the resource are displayed.
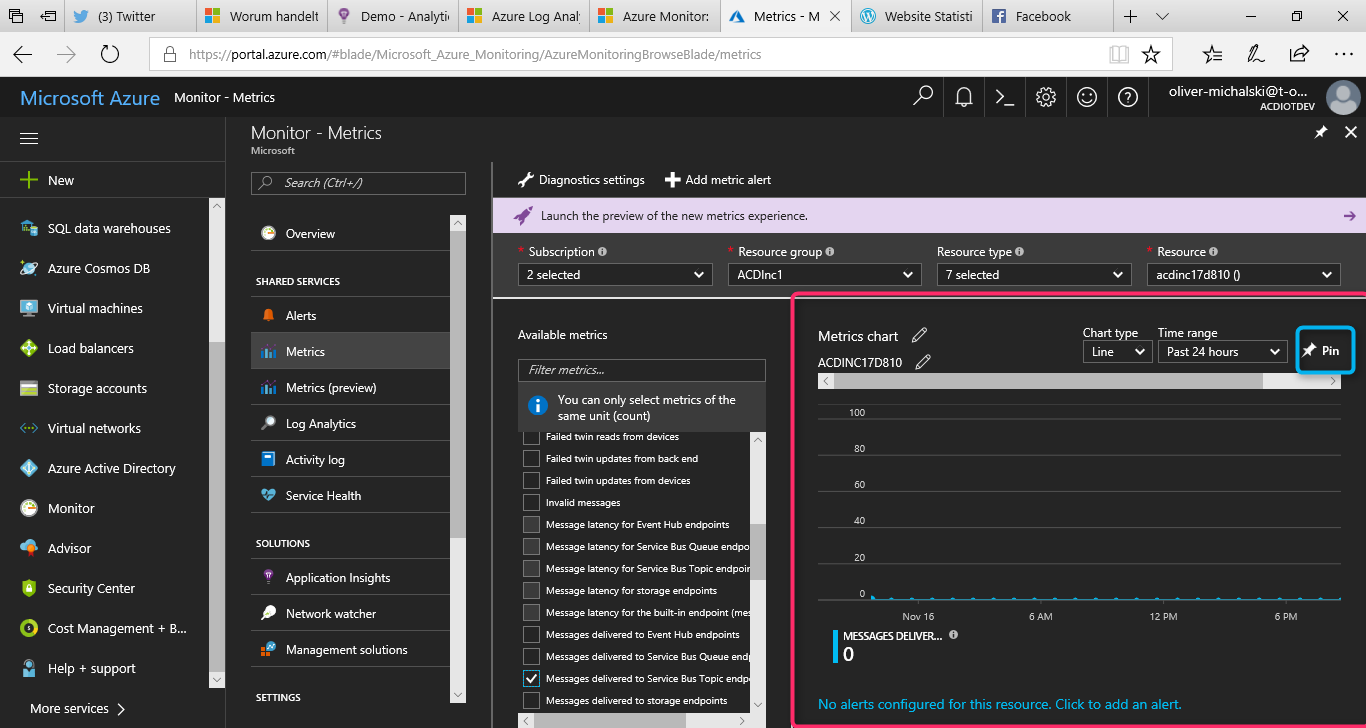
- Select a metric and you will immediately see the corresponding chart.
- As the last step, click on the Pin button as shown in the following screenshot:
- Now you get the Metric chart displayed on the default dashboard of the Azure management portal as shown in the following screenshot:

- The metrics feature only gives you the ability to display values from a single metric. For the DevOps area, charts would be more interesting, that show several metrics in comparison at the same time. But with the multiple metrics charts, a new preview has recently been available. Let's take a look at this. In the navigation area of the dashboard, click on Metrics (preview).
- This opens the multiple metrics charts editor window. Here you first select a resource.

- Selection of a METRIC:

- You can also determine what type of math value you want to see (for example, Avg, Min, Max) as shown in the following screenshot:

- Now we've set the data picker for the first metric. Now click on the highlighted icon, and the selection procedure for the second metric starts. You can repeat this as often as you like.
