Let's quickly look at the REST interface by running SSH to the node that is running the Heapster pod. First, we can list the pods to find the one that is running Heapster, as follows:
$ kubectl get pods --namespace=kube-system
The name of the pod should start with monitoring-heapster. Run a describe command to see which node it is running on, as follows:
$ kubectl describe pods/<Heapster monitoring Pod> --namespace=kube-system
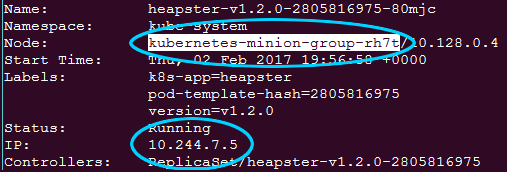
From the output in the following screenshot, we can see that the pod is running in kubernetes-minion-merd. Also note the IP for the pod, a few lines down, as we will need that in a moment:
Next, we can SSH to this box with the familiar gcloud ssh command, as follows:
$ gcloud compute --project "<Your project ID>" ssh --zone "<your gce zone>" "<kubernetes minion from describe>"
From here, we can access the Heapster REST API directly using the pod's IP address. Remember that pod IPs are routable not only in the containers but also on the nodes themselves. The Heapster API is listening on port 8082, and we can get a full list of metrics at /api/v1/metric-export-schema/.
Let's look at the list now by issuing a curl command to the pod IP address we saved from the describe command, as follows:
$ curl -G <Heapster IP from describe>:8082/api/v1/metric-export-schema/
We will see a listing that is quite long. The first section shows all the metrics available. The last two sections list fields by which we can filter and group. For your convenience, I've added the following tables which are a little bit easier to read:
|
Metric |
Description |
Unit |
Type |
|
uptime |
The number of milliseconds since the container was started |
ms |
Cumulative |
|
cpu/usage |
The cumulative CPU usage on all cores |
ns |
Cumulative |
|
cpu/limit |
The CPU limit in millicores |
- |
Gauge |
|
memory/usage |
Total memory usage |
Bytes |
Gauge |
|
memory/working_set |
Total working set usage; the working set is the memory that is being used, and is not easily dropped by the kernel |
Bytes |
Gauge |
|
memory/limit |
The memory limit |
Bytes |
Gauge |
|
memory/page_faults |
The number of page faults |
- |
Cumulative |
|
memory/major_page_faults |
The number of major page faults |
- |
Cumulative |
|
network/rx |
The cumulative number of bytes received over the network |
Bytes |
Cumulative |
|
network/rx_errors |
The cumulative number of errors while receiving over the network |
- |
Cumulative |
|
network/tx |
The cumulative number of bytes sent over the network |
Bytes |
Cumulative |
|
network/tx_errors |
The cumulative number of errors while sending over the network |
- |
Cumulative |
|
filesystem/usage |
The total number of bytes consumed on a filesystem |
Bytes |
Gauge |
|
filesystem/limit |
The total size of filesystem in bytes |
Bytes |
Gauge |
|
filesystem/available |
The number of available bytes remaining in a the filesystem |
Bytes |
Gauge |
|
Field |
Description |
Label type |
|
nodename |
The node name where the container ran |
Common |
|
hostname |
The host name where the container ran |
Common |
|
host_id |
An identifier specific to a host, which is set by the cloud provider or user |
Common |
|
container_base_image |
The user-defined image name that is run inside the container |
Common |
|
container_name |
The user-provided name of the container or full container name for system containers |
Common |
|
pod_name |
The name of the pod |
Pod |
|
pod_id |
The unique ID of the pod |
Pod |
|
pod_namespace |
The namespace of the pod |
Pod |
|
namespace_id |
The unique ID of the namespace of the pod |
Pod |
|
labels |
A comma-separated list of user-provided labels |
Pod |