If you recall from Chapter 1, Introduction to Kubernetes, we noted that our nodes were already running a number of monitoring services. We can see these once again by running the get pods command with the kube-system namespace specified as follows:
$ kubectl get pods --namespace=kube-system
The following screenshot is the result of the preceding command:
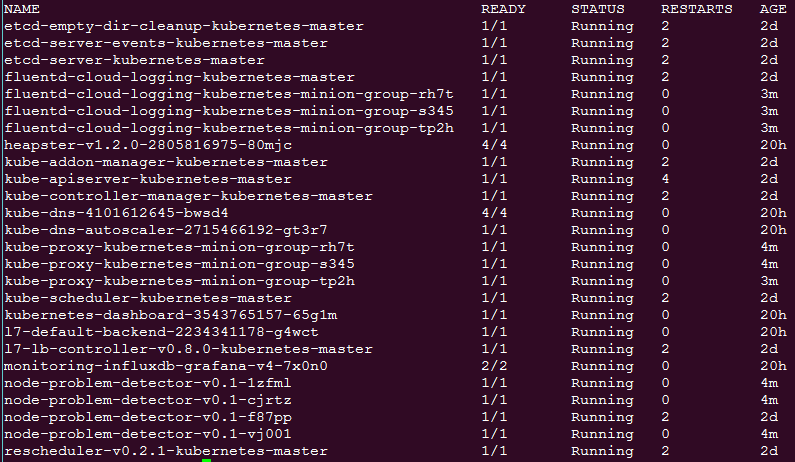
Again, we see a variety of services, but how does this all fit together? If you recall, the node (formerly minions) section from Chapter 2, Building a Foundation with Core Kubernetes Constructs, each node is running a kubelet. The kubelet is the main interface for nodes to interact with and update the API server. One such update is the metrics of the node resources. The actual reporting of the resource usage is performed by a program named cAdvisor.
The cAdvisor program is another open source project from Google, which provides various metrics on container resource use. Metrics include CPU, memory, and network statistics. There is no need to tell cAdvisor about individual containers; it collects the metrics for all containers on a node and reports this back to the kubelet, which in turn reports to Heapster.
Both cAdvisor and Heapster are mentioned in the following sections of GitHub:
- cAdvisor: https://github.com/google/cadvisor
- Heapster: https://github.com/kubernetes/heapster
Contrib is a catch-all term for a variety of components that are not part of core Kubernetes. It can be found at https://github.com/kubernetes/contrib. LevelDB is a key store library that was used in the creation of InfluxDB. It can be found at https://github.com/google/leveldb.
Heapster is yet another open source project from Google; you may start to see a theme emerging here (see the preceding information box). Heapster runs in a container on one of the minion nodes and aggregates the data from a kubelet. A simple REST interface is provided to query the data.
When using the GCE setup, a few additional packages are set up for us, which saves us time and gives us a complete package to monitor our container workloads. As we can see from the preceding System pod listing screenshot, there is another pod with influx-grafana in the title.
InfluxDB is described on its official website as follows:
InfluxDB is based on a key store package (refer to the previous Google's open source projects information box) and is perfect to store and query event- or time-based statistics such as those provided by Heapster.
Finally, we have Grafana, which provides a dashboard and graphing interface for the data stored in InfluxDB. Using Grafana, users can create a custom monitoring dashboard and get immediate visibility into the health of their Kubernetes cluster, and therefore their entire container infrastructure.