In addition, there are three topology views at the bottom. These views are perfect for helping us understand how our application is communicating. Click on Topology | Network Traffic and wait a few seconds for the view to fully populate. It should look similar to the following screenshot:

Note that the view maps out the flow of communication between the minion nodes and the master in the cluster. You may also note a + symbol in the top corner of the node boxes. Click on that in one of the minion nodes and use the zoom tools at the top of the view area to zoom into the details, as shown in the following screenshot:
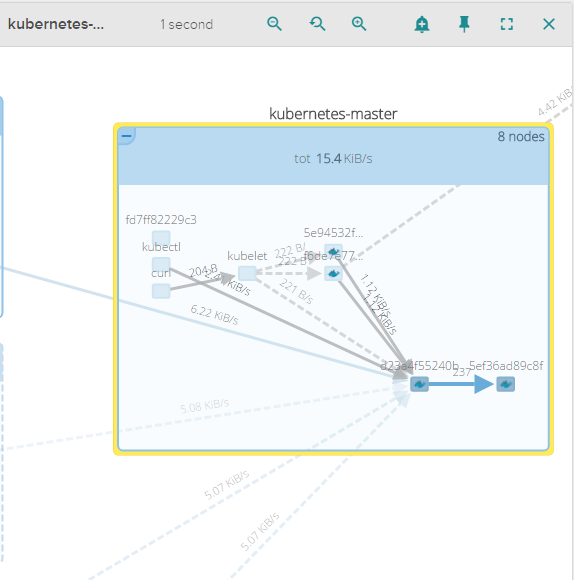
Note that we can now see all the components of Kubernetes running inside the master. We can see how the various components work together. We can see kube-proxy and the kubelet process running, as well as a number of boxes with the Docker whale, which indicate that they are containers. If we zoom in and use the plus icon, we can see that these are the containers for our pods and core Kubernetes processes, as we saw in the services running on the master section in Chapter 1, Introduction to Kubernetes.
Also, if you have the master included in your monitored nodes, you can watch kubelet initiate communication from a minion and follow it all the way through the kube-apiserver container in the master.
We can even sometimes see the instance communicating with the GCE infrastructure to update metadata. This view is great in order to get a mental picture of how our infrastructure and underlying containers are talking to one another.