
In this recipe, we will see how we can use a standard Web Dynpro component in order to view the entire structure of our FPM applications.
Follow these steps:
- Call transaction
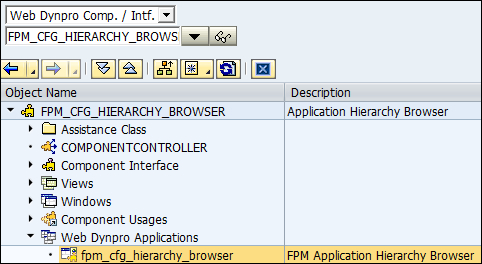
SE80. In the left-hand pane, choose Web Dynpro Component from the list box and enter the component nameFPM_CFG_HIERARCHY_BROWSERin the field provided. Click the Display button. - Then open the Web Dynpro Applications node and double-click the FPM_CFG_HIERARCHY_BROWSER application.
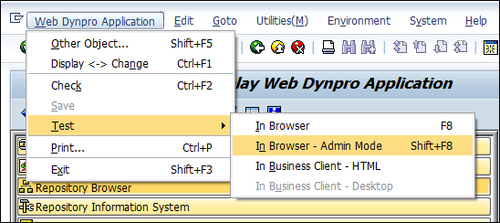
- Then, choose the menu path: Web Dynpro Application | Test | In Browser - Admin Mode.
- The browser will open and the screen will appear as follows:
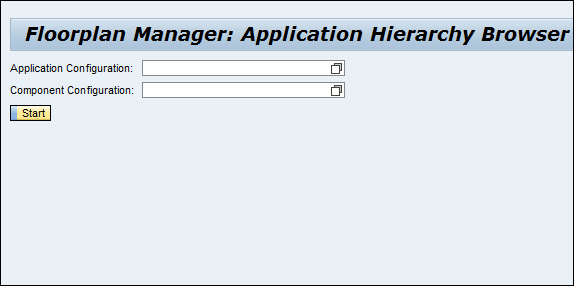
- Enter the name in the Application Configuration field provided and click the Start button. We will use our already created application configuration
ZST8_MY_OIF_DEMO. - The entire hierarchy of the application (and configuration) will be displayed in the next browser screen.
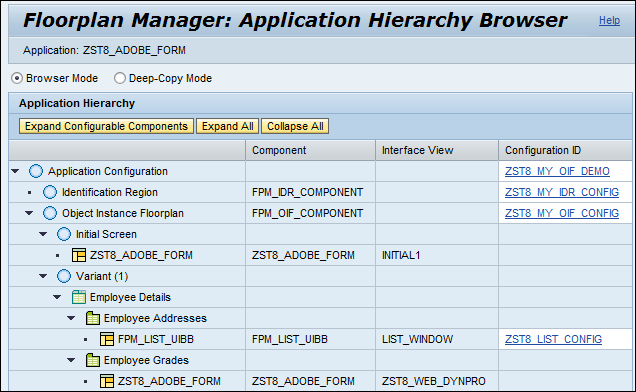
We use a standard application to display the hierarchy of our FPM application. The IDR and the OIF details are shown. The configuration IDs of the various involved configurations are also displayed. The component used for the initial screen as well as the various subview and views details are displayed. If a GUIBB is used, (for example, list UIBB), the component name used along with the relevant configuration ID is displayed. We may click on a particular configuration ID to display. In a separate browser session, the details of its configuration are given.
..................Content has been hidden....................
You can't read the all page of ebook, please click here login for view all page.