In this recipe, we will generate the results of the trace carried in the previous recipe, Carrying out SQL trace. The mentioned recipe should be completed in order to proceed with this one. We will then interpret the results in order to get a better idea of the various tables and their access times involved.
We will now carry out the following steps:
- From the main screen of the transaction
ST05, click on the Display Trace button. This will take you to the screen, as shown in the following screenshot: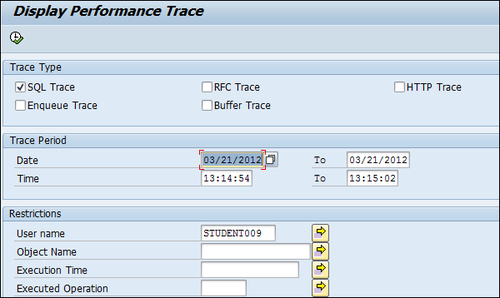
- The User name field and the Date and Time fields appear by default. You may change the Date and Time fields, and also enter data in the other fields if desired.
- Then press F8. This will display the Performance Trace.
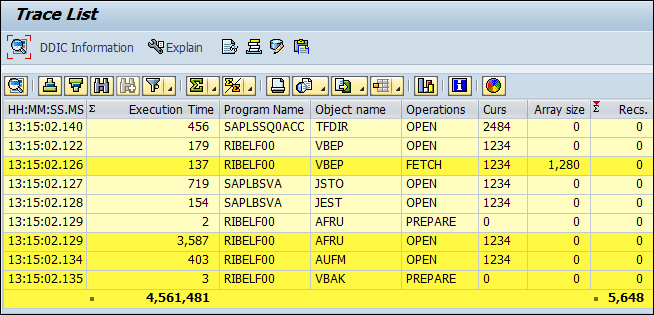
When the Display Trace option is chosen, the performance trace is displayed. All the database activities (database access and database update statements) that were recorded during the time between the trace on and off duration are displayed, as shown in the following screenshot:
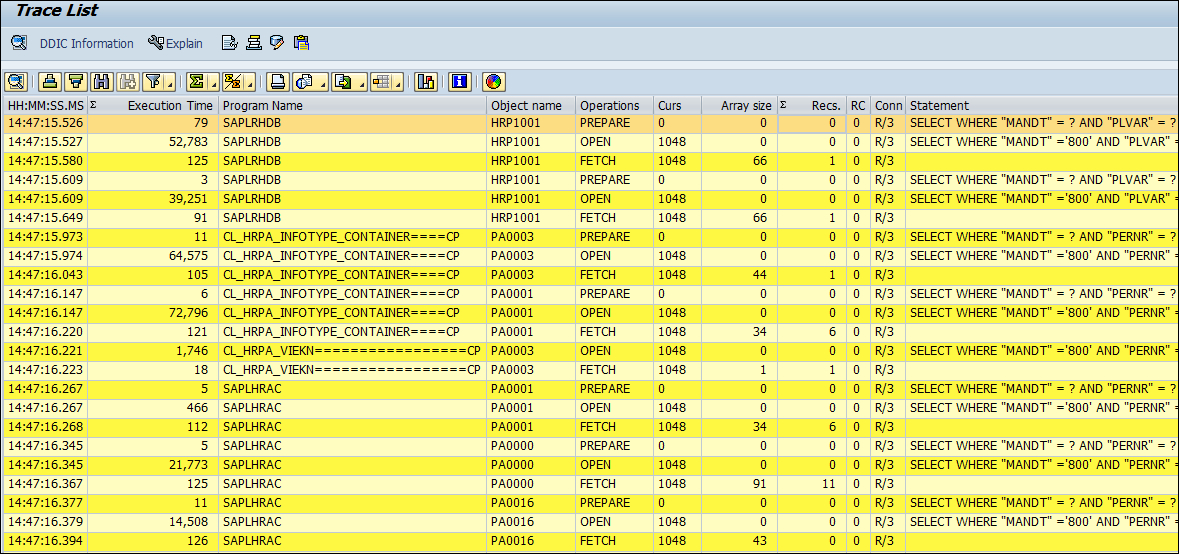
In this example, since we had a report that only reads data from the database, no database update statements are involved.
Each statement that is contained in the ABAP program is subdivided into various operations such as PREPARE, OPEN, and FETCH. There are various useful columns in the displayed performance trace. The trace results contain the table name (Object name) that refers to the table from which data is read. The duration of the statement/operation is also shown in milliseconds, along with the name of the program that contained the ABAP statement in question. Most importantly, the number of records fetched from the database as a result of the FETCH operation is also shown.
The various operations are as follows:
- PREPARE: After the PREPARE operation, the Open SQL statement is translated into native SQL of the underlying database. The statement is not assigned the parameter values for which the data is to be read (that is, the
WHEREclause specification). Double-clicking the particular PREPARE operation line will show this detail. The data access method (execution plan) is determined at this point.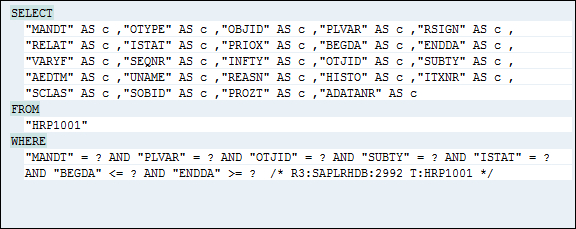
- OPEN: The OPEN operation opens a cursor declared earlier using the DECLARE operation, and assigns the relevant comparison values to the
WHEREclause fields. The records fulfilling the selection criteria are read from the database table using the relevant execution plan (involving either a sequential or an index search). Until here, the records are at the database level.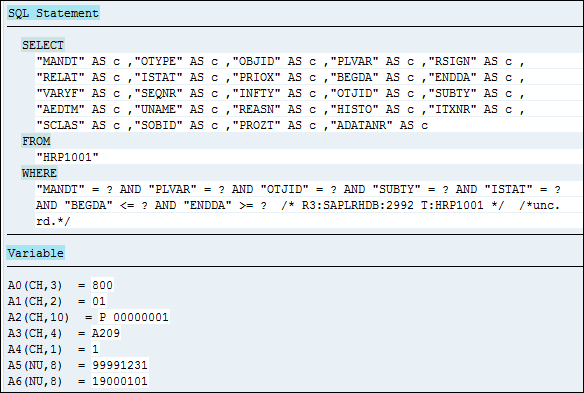
Note the difference between the SQL statement pertaining to the OPEN and the PREPARE statement.
If a FOR ALL ENTRIES construct is involved, the data records are not read by a single set of operations. Rather, multiple sets of PREPARE-OPEN-FETCH operations are involved. You may see them in the following screenshot:
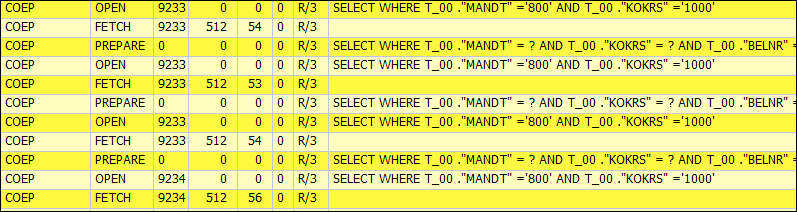
If database update statements are involved, the EXEC operation appears in the Trace List. In addition, in this case, the Records column will show the number of records updated in the database table rather than the records read.
At the end of the list is the total of the number of fetched records and the totl execution time.
Also, we can go to the ABAP code and display the execution plan from the performance Trace List. For finding out the exact location, in the ABAP program, of the corresponding statement shown in the Trace List, keep the cursor on a line showing an OPEN operation, and then click the (![]() ) icon from the toolbar. This will take you to the exact line in the program that generated the entry in the trace list.
) icon from the toolbar. This will take you to the exact line in the program that generated the entry in the trace list.
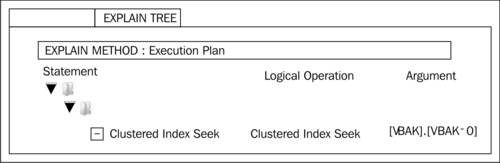
In addition, for viewing the execution plan of a particular statement, select the FETCH operation line and click the toolbar button Explain. The details about the index used (or whether the search within the table was sequential) are shown. After clicking the Explain button, the screen looks like the one shown in the following screenshot (for a MS SQL server database). Click on the EXPLAIN TREE tab to view whether an index has been used for the satement in question.