For each SQL statement in the program, the trace list shows a number of lines corresponding to the various operations, thus making the list very huge in size. We can see a summarized (view), and also apply table-related functions on the list values. In this recipe, we will see how to apply these functions.
For displaying summarized information, carry out the following steps:
- From the SQL list, choose the menu option Trace List | Summarize Trace by SQL Statement. Alternately, you may use the keys Shift + F8.
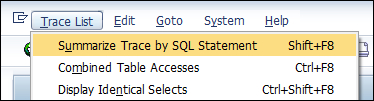
- In order to see a list of all identical selects within the trace, choose the menu option Display Identical Selects.
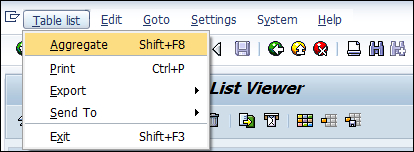
- For generating a combined view for various table accesses and without the details of the SQL statement, use the menu option Trace List | Combined Table Accesses or use keys Ctrl + F8. You may also see an Aggregate table view from the Combined Table Accesses list, by using the menu path Table List | Aggregate.
The summarized table view generates a shorter list, as shown in the following screenshot. The details of the operations such as OPEN, FETCH, and so on are omitted, and only one line exists for each SELECT or UPDATE statement used in the program. In addition, no detail of the SQL statement or parameters passed from the program for the WHERE clause is shown. If there are multiple accesses to a particular table, each access is shown in the list along (in the following screenshot) with the time at which the access was made:
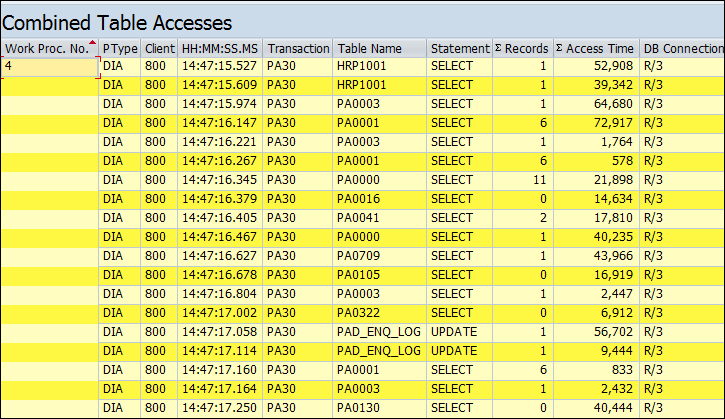
If we further want to refine and want an Aggregate Table Accesses list showing the total time taken for accessing a particular table along with the number of records read and the number of times the respective table was accessed throughout the trace period, we will go for the Aggregate Table Accesses view. For each table accesses, there is a single line shown in this list, as shown in the following screenshot:
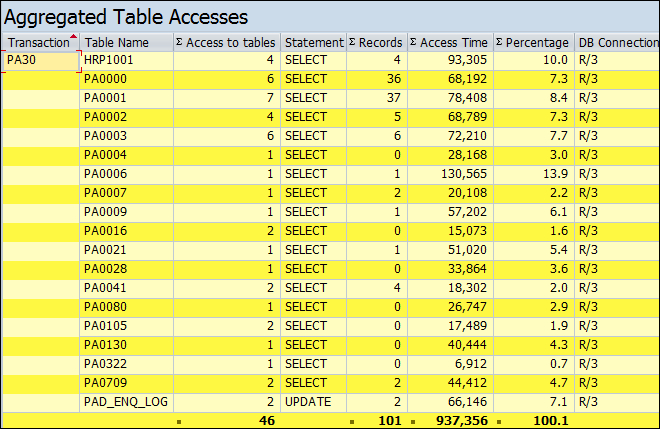
We also have a percentage column that will show the table whose access takes the most percentage of the runtime.
If the appropriate path is chosen, a list of identical selects may also be generated.
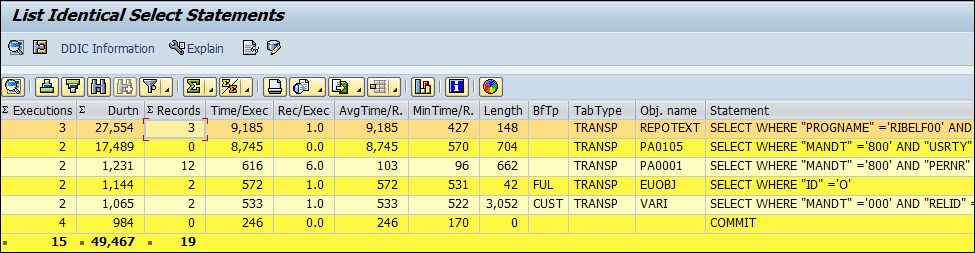
Here, the number of times the SELECT statement was executed is shown, along with the number of records read and the duration of the execution. Reducing/eliminating the number of identical selects (particularly the more expensive ones in terms of execution time) will greatly help in performance optimization. They are just repeated SELECT statements tha only consume runtime and resources.