In this recipe, we will see the steps required to analyze the execution of any report, transaction, or function module using the transaction SAT.
For this recipe, we will analyze the runtime of a standard program RIBELF00 (Display Document Flow Program). The program selection screen contains a number of fields. We will execute the program on the order number (aufnr) and see the behavior.
For carrying out runtime analysis using transaction SAT, proceed as follows:
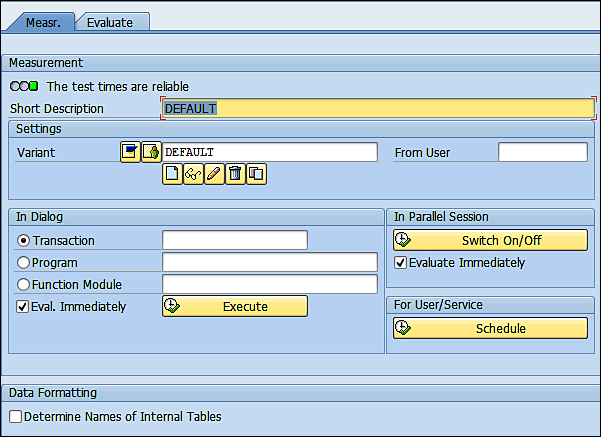
- Call transaction SAT. The screen appears as shown:
-
Enter a suitable name for the variant (in our case,
YPERF_VARIANT) and click the Create button below it. This will take you to the Variant creation screen.
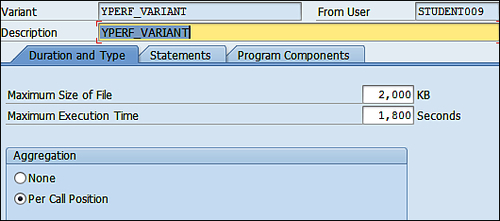
- On the Duration and Type tab, switch on Aggregation by choosing the Per Call Position radio-button.
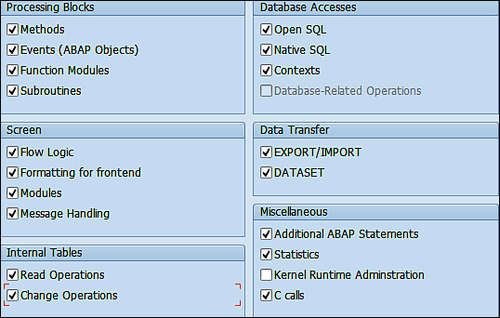
- Then, click on the Statements tab. On the Statements tab, make sure Internal Tables, the Read Operations checkbox and the Change Operations checkbox, and the Open SQL checkbox under Database Access are checked.
- Save your variant. Come back to the main screen of SAT.
- Make sure that within Data Formatting on the initial screen of SAT, the checkbox for Determine Names of Internal Tables is selected.
-
Next, enter the name of the program that is to be traced in the field provided (in our case, it is
RIBELF00). Then click the button.
- The screen of the program appears as shown. We will enter an order number range and execute the program.
- Once the program output is generated, click on the Back key to come back to program selection screen.
- Click on the Back key once again to generate the evaluation results.
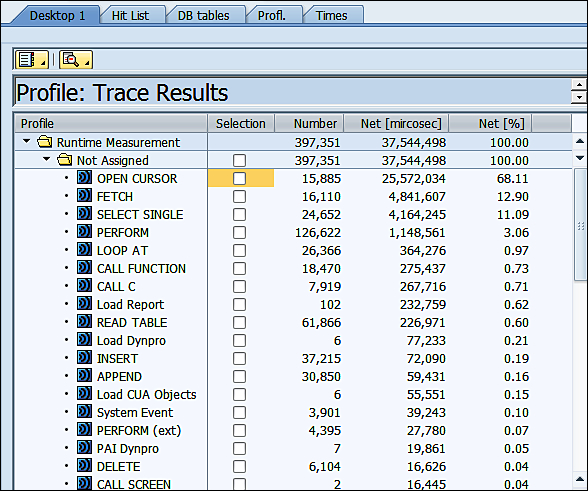
We carried out the execution of the program through the transaction SAT and the evaluation results were generated. On the left are the Trace Results (in tree form) listing the statements/events with the most runtime. These are like a summary report of the entire measurement of the program. They are listed in descending order of the Net time in microseconds and the percentage of the total time. For example, in our case, the OPEN CURSOR event takes 68 percent of the total runtime of the program.
Selecting the Hit List tab will show the top time consumer components of the program. In this example, the access of database tables AFRU and VBAK takes most of the time.
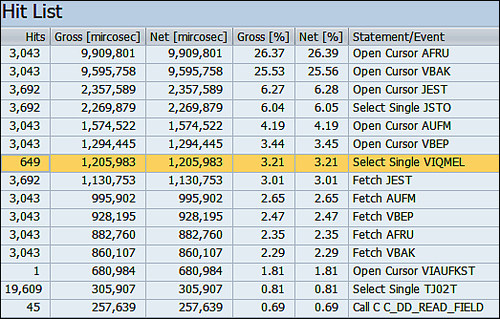
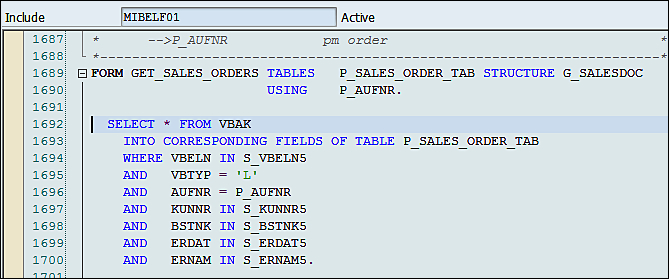
Double-clicking any item in the Trace Results window on the left-hand side will display (in the Hit List area on the right-hand pane) details of contained items along with execution time of each item. From the Hit List window, double-clicking a particular item will take us to the relevant line in the program code. For example, when we double-click the Open Cursor VBAK line, it will take us to the corresponding program code.
We have carried out analysis with Aggregation switched on. The switching on of Aggregation shows one single entry for a multiple calls of a particular line of code. Because of this, the results are less detailed and easier to read, since the hit list and the call hierarchy in the results are much more simplified.
Also within the results, by default, the names of the internal table used are not shown. In order for the internal table names to appear in the evaluation result, the Determine Names checkbox of Internal tables indicator is checked.
As a general recommendation, the runtime analysis should be carried out several times for best results. The reason being that the DB-measurement time could be dependent on a variety of factors, such as system load, network performance, and so on.