SQL performance trace files may be very huge and searching for tables may be a time-consuming task. In this recipe, we will see how we can filter irrelevant values from the SQL trace list. We assume that an unrestricted trace like the one shown in the first recipe, Carrying out SQL Trace has already been done.
- After a trace has been carried out from the transaction
ST05screen, press the Display Trace button. The portion of the screen that appears is shown in the following screenshot: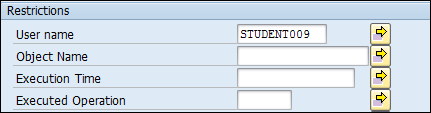
- The User name appears as default. You may enter a particular table name in the Object Name field, or a set of letters followed by asterisk (*), such as
VB*orPA*may be entered. - You may enter one or more operations in the Executed Operation field.
- Also, we can enter a value for execution time with a greater-than (GT) operator.
Instead of the huge trace list, only the values that pertain to the values entered on the Display Trace screen are shown. For example, if we enter VB*, all tables with names beginning with VB such as VBAK, VBRP, and so on will be shown. Also, if we enter the EXEC operation, only this operation's entries will be displayed. Similarly, the Execution Time is taken into account. For finding the slowest statements, the Execution Time field is very important. We can enter a value greater than the particular time duration. This will list all costly statements that we need to optimize.