Electromagnetic Transients
Basic concepts of transient analysis 36.2
Protection of system and equipment against transient overvoltage 36.3
Protection of transmission lines against lightning 36.3.1
The transient network analyser (TNA) 36.4.1
Digital computer simulation 36.4.2
Digital real-time electromagnetic transient simulator 36.4.3
Waveforms associated with the electromagnetic transient phenomena 36.5
36.1 Introduction
Although a power system operates in the steady state for a large part of its time, it must be capable of withstanding the overvoltage and overcurrent stresses generated during transient conditions. The size of transmission line towers, the clearance for conductors, the insulation of windings, the rating of circuit-breakers, the loading capabilities of lines, cable, etc., and the operating performance of protection relays are all dictated by consideration of the amplitude and frequency of the power system transients. Consequently, to design and operate a power system to deliver a reliable and high quality power supply, it is crucial to have a thorough understanding of its transient behaviour.
In terms of modelling and analyses of power system transients, since they usually consist of multiple frequencies, phasor representations of voltages, currents and impedances are no longer valid. Furthermore, representation of a power system by a single-line diagram derived from say, symmetrical components, is no longer appropriate since the latter are derived from steady state phasor analysis.
The foregoing analysis problem is compounded by the fact that a single physical component in power system network may have a different model representation (depending on a specific transient phenomenon being investigated) in order to achieve the requisite accuracy. For example, a transmission line (or an underground cable) may be modelled by a short bus section, an inductance, a resistance, a series RL circuit, an RLC II or T section (or multiples of such sections cascaded together), or a fully distributed line/cable model. Likewise, a transformer or a shunt reactor may be modelled by simply an inductance, or a network of capacitances or by a combination of the two.
Transient phenomena in power systems is caused by such disturbances as switching operations, faults including those induced by lightning strikes, partial discharges due to defects in power equipment, etc. They involve a frequency range from d.c. to several MHz. In this respect a rudimentary distinction is usually made between electromechanical transients, traditionally covered by transient stability studies, and electromagnetic transients. The latter types of transients can occur on a time scale ranging from microseconds to several cycles. They are a combination of travelling waves on overhead lines, underground cables and buses, and oscillations in lumped element circuits of generators, transformers and other devices. Some slower electromechanical transients, such as subsynchronous resonance (associated for example with series capacitor compensated lines), for which detailed machine models are needed, are usually included in this class of transients.
Transients may result in overvoltages, overcurrents, distorted waveforms or electromechanical oscillations. In general, a single event will cause all of these effects, but depending upon the requirements, a particular one might be of greatest concern. Briefly, the aforementioned four categories within the transient phenomena can be described as:
Overvoltages: The design and insulation requirements of power equipment is determined by the overvoltages it must withstand. The overvoltage could be quasi-steady state (principally 50/60 Hz) or due to the short duration high frequency phenomena. Examples of the former are voltage excursions due to load rejection or loss of shunt reactive compensation. Examples of the latter are the voltage surge due to a lightning strike or the overvoltages caused by the opening and closing of a circuit-breaker. In this respect, a voltage surge generated by lightning may have a wavefront as steep as a fraction of a microsecond and may last for a few microseconds. Alternatively, switching surges may have wavefronts of several microseconds and may persist for a few power frequency cycles. It is thus apparent that if the effect of lightning is being studied, the system model must be capable of accurately simulating the power system transients at frequencies up to hundreds of kHz (or even MHz); for studying switching operations, frequencies up to tens of kHz (or even 100 kHz) will be of interest.
Overcurrents: Overcurrents result from system faults and their knowledge helps to determine the performance of protection relays the required interrupting duty of circuit-breakers, and mechanical and thermal stresses on power equipment. Since a power system is mainly inductive in nature, the transients with short circuit currents are largely restricted to the lower frequency. However, it must be mentioned that although higher frequency transients are also present, they are relatively of much smaller magnitudes in comparison to the lower frequency current transients and/or high frequency voltage transients.
Distorted waveforms: An accurate knowledge of the shape of the voltage and current signals during either transient or abnormal steady state operating conditions is of considerable importance. For example, when testing a high speed protection relay, the distortion in the voltage and current waveforms immediately after a fault will affect the operating time or stability of the relay. In addition, some protection relays will be affected by the harmonics generated by d.c. converters or non-linear circuit elements.
Electromechanical oscillations: One particular type of such oscillations, viz, subsynchronous resonance type, are caused by a combination of the series capacitors and natural line inductance; this resonance can exacerbate the torsional oscillations on the generator shaft to cause mechanical failure. Such oscillations thus require detailed simulation models.
This chapter deals with several aspects associated with the electromagnetic transients. It describes in some detail some of the fundamental concepts for transient analysis and an outline of the tools available for simulating such transients through setting up models of the various components within a power system network. An understanding of the transient phenomena is enhanced by an illustration of typical voltage and current transient waveforms.
36.2 Basic concepts of transient analysis
As mentioned before, the main causes of power system transients are:
36.2.1 Lightning surges
Lightning is the greatest single cause of line outages; for example, it accounts for about 70% of outages on the high voltage transmission system (275 kV, 400 kV, 500 kV, etc.). The physical phenomenon of lightning shows that clouds acquire charge, or at least become polarised. Electric fields become excessive to the extent that the dielectric of the intervening space can no longer support the electrical stress and breakdown or lightning flashover occurs; this is usually a high-current discharge.
The lightning strikes that create problems for the power engineers are those that terminate on or near to power lines. These can be looked upon as equivalent to closing a switch between the cloud and the power line or adjacent earth, thus constituting a circuit change condition. This is either a direct connection to the line or it completes a circuit with close mutual coupling to the line. Direct consequences of this phenomenon are:
• very often the line will be raised to such a potential that further flashes will occur to grounded structures;
• the grounded structures may be raised to such a potential that they flash over to the line.
The disturbance created on a power line due to the lightning phenomenon involves travelling waves. These are essentially voltage surges which, although of short duration, can nonetheless cause overvoltage well in excess of the insulating capabilities of power lines, thus posing a serious threat of damage to expensive equipment and causing disruption.
The basic wave shape of a lightning strike is the 1.2/50 μs wave and typifies the lighting surge. This is shown in Figure 36.1.
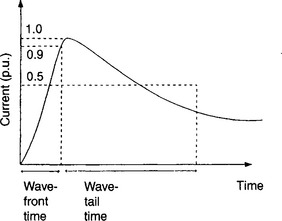
Figure 36.1 represents a current waveform which rises in 1.2 μs and falls to half the peak value in 50 μs. Normally only heavy current flowing over the first 50 μs is of importance and the magnitude of the peak current ranges from 20 kA to 200 kA. The current/time relationship for the aforementioned wave shape is given by:
where t is in μs. The values of the constants α and β depend on the nature of the surge and are typically α = 0.002 and β = 3.0.
When a lightning strike arrives on an overhead conductor, equal current surges of the waveform shown in Figure 36.1 are propagated in both directions, away from the point of impact. The magnitude of each voltage surge set up is therefore given by:
where Z0 is the conductor surge impedance.
The voltage surge set up depends upon the effective surge impedance of the conductors into which the current discharges (and, of course, on the peak current) but this value is rarely less than about 3 MV peak. Such a voltage is well above the insulating capability of transmission line insulators. It would, however, be economically nonviable to design them to withstand such high voltages (it can be shown that cost α V2). In this respect, overhead shield (or earth) wires are used, which largely prevent direct strikes to the phase conductors.
When an earth wire exists over the overhead line, a strike arriving on tower or on the wire itself sets up the surges in both directions along the wire. On reaching neighbouring towers, they are partially reflected and transmitted further and this process continues over the length of the line as and when towers are encountered. Under this condition, the voltage surges set up on the main phase conductors are significantly smaller than would be the case if the earth wire were absent. This is because, in the presence of an earth wire, the voltage surges set up on the phase conductors are due to the mutual coupling effect between the earth wire and the phase conductors. The coupling factor is typically in the range of 0.15 < k < 0.3.
The initial voltage surge generated on the earth wire depends upon both the tower impedance (ZT) and the earth wire surge impedance (ZEW). In this respect, different tower designs present different surge impedances. For example, if the tower tops are connected by a single earth wire of surge impedance ZEW then the effective surge impedance is given by:
The half is included with the ZEW since a wave propagates in both directions from the stricken point.
Current and voltage waves radiate from the point of contact in both directions along the earth wire and down the tower if the tower is involved. These waves rapidly encounter discontinuities such as adjacent towers in the case of earth wires or footing resistance in the case of the tower.
A direct consequence of this phenomenon is that reflected waves are initiated, which cause yet other waves when they return to the stricken point. The effect of these waves will depend on the change of surge impedance at the point of discontinuity. For example, if the initial wave going down the tower encounters a low footing resistance R, then the reflected wave will be of opposite sign and will act to reduce the tower potential. The reverse will occur if the footing resistance is high.
Transmission line theory1 shows that reflection coefficient ρG at ground is given by:
Also of interest are the refracted (βE) and reflected (ρE) coefficients experienced by the reflected waves returning to the tower top from the ground. Again, using transmission line theory, these can be shown to be:
36.2.1.1 Back flashover
The potential difference across the suspension insulators is of particular concern since a flashover can occur and a fault is placed on the phase if this voltage becomes excessive. Waves travelling along the earth wire induce waves on the phase conductors, the conductor closest to the earth wire experiencing the highest induced voltage. The effect of this coupling between the earth wire and the phase conductors (typically between 0.15 and 0.3) is to lessen the stress on the line insulators. The induced voltages add to, or subtract from, the power frequency voltages. At any instant, at least one phase will have the same polarity as the lightning surge; such a phase is more likely to flashover. This phenomenon is more commonly known as back flashover.
It is desirable, therefore, to have a lower footing resistance. There are two considerations:
A typical value for the tower footing resistance R is 25 Ω. After a lightning strike, the time taken for the voltage surge to travel from the tower top to the tower footing and back at the speed of light is typically 0.25 μs. The resulting magnitude of the voltage surge is thus reduced to typically about 500 kV which is far less daunting than the above 3 MV surge generated at the instant of a lightning strike.
36.2.2 Switching surges
36.2.2.1 Interruptions of short-circuits and switching operations
When a fault occurs on a transmission line, due for example to a lightning strike, then in order to clear the fault (i.e. if the fault is transient in nature) and at the same time minimise damage, it is normal practice to isolate the faulted conductor(s). This is done by tripping the nearest circuit-breakers, once the fault has been detected by protective relays. However, no circuit which contains an appreciable inductance can have the current in it broken instantly. As power circuits are always inductive, a high induced voltage will occur across any break in the circuit at the instant of current interruption. This voltage is sufficient to ionise the gas molecules in the gap between circuit-breaker contact and conductor, resulting in an arc which strikes between circuit-breaker contact and conductor at the instant of a separation.
It is important to note that the extinction of arc current on opening of a particular circuit-breaker will only remain permanent if the restrike voltage is less than the recovery voltage (see Figure 36.2).
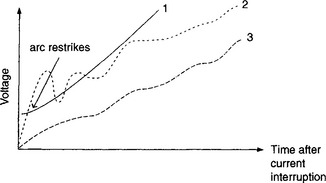
Figure 36.2 Breaker restrike voltage characteristics: 1—breaker recovery voltage, 2—restriking voltage transient with initial rapid rate of rise, 3—restriking voltage transient that does not cause a restrike
• Restrike voltage is the voltage across the contacts of a circuit-breaker at current extinctions.
• Recovery voltage is the voltage that can be withstood across the contacts of a circuit-breaker after current extinction. It increases with time. Re-ignition voltage is another term for recovery voltage.
The restriking voltage transient is very largely independent of the breaker characteristics and very much depends upon the transient response of the system with respect to a particular breaker location.
36.2.2.2 Current chopping
Current chopping is the extinction of arc current before natural current zero. It is very important that circuit-breakers are designed so that they do not prematurely chop the fault current. Unfortunately, current chopping does arise with certain types of circuit breakers, namely the air-blast circuit breakers which operate on the same air pressure and velocity for all values of interruption current.
On low-current interruption, the breaker tends to open the circuit before the current natural-zero and the electromagnetic energy present is rapidly converted to the electrostatic energy.
36.2.3 Overvoltage induced by faults
Overvoltage may be produced by certain types of asymmetrical fault such as a ground fault on one of the phase conductors of a three-phase transmission line. The situation is somewhat analogous to the switching transients except that here instead of injecting a current, a voltage equal and opposite to the prefault voltage at the fault point is applied (see Figures 36.3(a)-(d)).
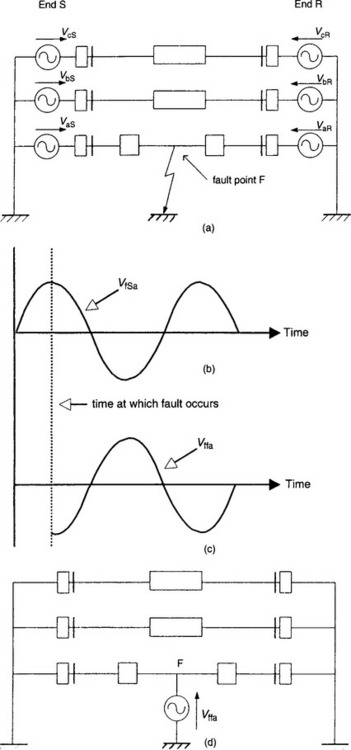
Figure 36.3 A faulted three-phase system: (a) faulted network; (b), (c) faulted network voltage; (d) superimposed network
• Figure 36.3(a) shows the faulted system in which a ground fault has occurred on the ‘a’-phase at point F.
• Figure 36.3(b) shows the prefault steady-state voltage VfSaat the fault point.
• If it is assumed that a fault occurs at the peak of the prefault voltage and t = 0 at this instant, then the voltage injected at the fault point is as shown in Figure 36.3(c).
• Figure 36.3(d) shows the de-energised network to which is applied the voltage Vffa. This is also known as the superimposed voltage.
We can study the problem of overvoltage by asking how the de-energised network behaves in response to the application of this voltage. Complex analysis based on travelling-wave theory (such as Bewley lattice diagrams2) can be used to depict the level of overvoltage likely to be induced, particularly on the unfaulted phases due to the injection of the suddenly applied voltage at the fault point. A line–ground fault of the type considered here can produce an overvoltage on an unfaulted phase as high as approximately twice the normal line-to-neutral voltage.
Figure 36.4 typifies an example of such an overvoltage, in particular when the fault occurs at the midpoint of the line; then maximum voltage is at the midpoint of the unfaulted conductor.
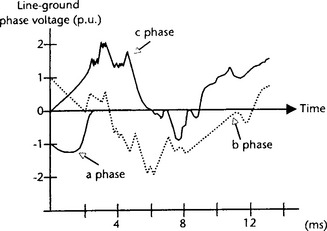
A more comprehensive set of transient voltage and current waveforms associated with different forms of electromagnetic disturbances will be illustrated later on in this chapter.
In practice, since insulator chains are designed to withstand approximately 1.4 times the normal steady-state voltage, there is a likelihood of a fault being induced on a healthy phase (this is also commonly known as an evolving fault) and this can have a detrimental effect on systems employing single-pole tripping.
36.2.4 Resonance
It is well-known that, in resonant circuits, severe overvoltage occurs, dependent on the resistance present. For example, voltage at resonance across the capacitance can be high. Although it is unlikely that resonance in a supply network can be obtained at normal supply frequencies, it is possible to have this condition at harmonic frequencies. Resonance is normally associated with the capacitance to earth of items of plant and often occurs on an opened phase due to a broken conductor or a fuse operating.
In circuits containing windings with iron cores, e.g. transformers, a condition due to the shape of the magnetisation curve known as ferroresonance is possible. This can produce resonance with overvoltage and also sudden changes from one condition to another with the possibility of an overvoltage surge.
The problems associated with subsynchronous resonance have already been briefly discussed before.
36.3 Protection of system and equipment against transient overvoltage
Surges in power systems can be very destructive. It is important to protect power equipment against them wherever possible, consistent with sound economics.
• Firstly, we must strive to prevent lightning surges gaining entry to the systems.
• Secondly, we must minimise the effects of those that do enter.
We must accept switching surges—they are the inevitable consequence of normal system operation. However, we can mitigate their effect by careful design.
The protection of terminal equipment in substations is of particular concern because damage there can be very costly in replacement and in outage time. A family of surge protection devices has been developed over the years which assist greatly in this task.
Surges can intrude into control circuits causing destruction and/or maloperation of relays, measuring equipment, monitors, etc.
36.3.1 Protection of transmission lines against lightning
As mentioned before, it is common practice to protect overhead lines against lightning by the employment of one (or more) earth wires that are strung from tower to tower above the phase conductors. These wires are bonded to the towers so that they are essentially at ground potential under normal conditions.
The intent in the disposition of these wires is to have them intercept lightning strikes that would have otherwise terminated on the phase conductors themselves, the effects of induced surges from indirect strikes is significantly lessened.
An aspect of vital importance, quite apart from the prevention of damage, is the maintenance of supply. Most flashovers do not cause permanent damage and therefore a complete and lasting removal of the circuit from operation is not necessary. Nowadays this is achieved by the use of autoreclosing circuit-breakers.
36.3.2 Surge protection
Inevitably, even the best shielding schemes will either not be fully effective or fail from time to time. Some switching operations and faults may generate overvoltage which can be potentially hazardous to the insulation of the plant. To protect the equipment against these contingencies, various devices have been developed. These devices are placed in parallel with the plant to be protected. Their purpose is to ensure that under no circumstances will the voltage across them exceed what the protected object can support.
36.3.2.1 Rod gaps and resistance suppressors
In the case of a transmission line insulator, a surge diverter in the form of rod gaps is commonly used as a crude protection device by placing it in parallel with the conductor insulator. However, it does have the disadvantage that often, after the surge responsible for breaking the gap between the rods has discharged, a power arc is maintained, i.e. a fault is thrown on the circuit. It is true that this can be removed by opening circuit-breakers at the two ends of the line and the power then restored by reclosing the breakers after the rod gap has de-ionised (the commonly employed circuit-breaker autoreclosing technique). Certainly, this is preferable to damaging a costly piece of equipment and perhaps sustaining a lengthy outage; but a device that can effect the voltage limiting without creating a fault is obviously more attractive. The nonlinear resistor is such a device. These resistors have the property that their resistance diminishes sharply as the voltage across them increases.
36.3.2.2 Lightning arrester
Circumstances will arise in which it is impossible to obtain the desired protection by using non-linear resistors. For example, if the ceiling voltage to which surges must be limited are ≤ 3 times the normal system voltage, the values of the resistance at system voltage may be so low that they make the steady-state losses prohibitive.
An improved but more expensive surge diverter is the lightning arrester. In such devices, the non-linear resistance elements are as before but they have a gap(s) in series with them. In this way, the resistor is isolated from the circuit in normal conditions and is introduced when a surge appears by the sparkover of the gap(s).
36.3.2.3 Surge capacitors and surge reactors
If a capacitor is placed in parallel with a piece of equipment it will provide some measure of protection against voltage surges—the surge can only impress a high voltage on the equipment as quickly as it can charge the capacitor. The effectiveness of the capacitor in holding down the voltage depends on the energy conveyed by the surge and the capacitance of the capacitor. Such capacitors are particularly effective against voltage spikes, i.e. short duration voltage surges. In this respect, the combination of a capacitor and some other protective device such as an arrester, can be very useful because they complement each other.
Surge reactors are sometimes used to protect voltage surges, particularly within pieces of a.c./d.c. conversion equipment, in a manner that complements the use of surge capacitors. The capacitor parallels the equipment to be protected; the reactor is placed in series with the equipment. When a surge reaches such a series combination, the initial tendency is for the surge voltage to appear primarily across the reactor because this offers the highest impedance to the rapidly changing surge current.
Like capacitors, the ability of reactors to store energy is limited, but again like capacitors, they can take care of low energy surges, or act temporarily to protect a device until such time as a gap can flashover or an arrester operates.
36.3.3 Transient voltages and grounding practices
Good grounding practices can contribute quite significantly to more reliable and safer utility and industrial power systems. We are concerned with minimising the damage to equipment and false operations of equipment, under transient conditions and also with the avoidance of shock hazard to personnel.
Under steady-state, quiescent operating conditions in a power system:
• the integrity of equipment is preserved by adequate insulation; and
• the safety of personnel is secured by keeping sufficient separation between people and high-voltage conductors.
Preferably, a grounded barrier in the form of a metal enclosure, wire fence etc. is placed between the circuit and any personnel. In this respect, grounded barrier refers to a physical equipotential surface, at the same potential as local ground and any other grounded objects around. However, under abnormal conditions such as when a fault occurs, this situation may no longer prevail and ground becomes a relative thing.
In industrial plant, ground fault currents are usually confined to the specially laid ground mat of the building and to cable sheaths. In utility systems, true ground is often involved and it is vitally important to connect the buried mat to ground via metal rods (typically 2–3 m long) into the ground. The effectiveness of these rods is critically dependent on the resistivity of the soil; it varies widely with location and weather conditions, from a few thousand to hundreds of thousands of ohms cm.
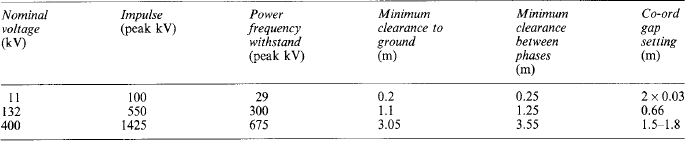
36.3.4 Insulation co-ordination
The equipment used in a power system comprises items having different breakdown withstand voltages and different volt/time characteristics. In order to protect adequately all items of the system it is necessary to consider the situation as a whole and not items of plant in isolation, i.e. the insulation protection must be co-ordinated. To assist this process, standard insulation levels are recommended and are summarised in Table 36.1 below.
36.4 Power system simulators
Simulation is one of the most powerful tools available to the power systems engineer when confronted with the need to study complex power systems phenomena. In this respect several tools have been used over the years to model and analyse electromagnetic transients. At early stages, miniature power system models, known as transient network analysers (TNA), were used. At present, the digital computer is the most popular tool, although TNAs are still used. In addition, the new generation of real-time digital systems are probably the most adequate tool in certain applications for which either a very high-speed or a truly real-time simulation is required.
36.4.1 The transient network analyser (TNA)
In a TNA, the power system components such as transmission lines, transformers, shunt reactors, circuit-breakers, etc. are scaled down to low current, low voltage, lumped inductance, capacitance and resistance circuits. A power network modelled using these circuits is then energised using generators modelled by ideal voltage sources behind Thevenin equivalent reactances.
The main advantages of a TNA are that the simulator operates in real time (providing analogue signals), there are no computationally unstable solutions and many users believe that a physical miniature model is closer to the actual system than a mathematical model.
The main disadvantages of a TNA are inflexibility, large capital cost (including regular maintenance cost), the time required to set up the system, limitations on the number/type of equipment models, problems associated with designing miniature inductors with the same ‘R’ to ‘L’ ratio as the actual power components, a drift in the component values due to ageing/environment and the finite length of lines that can be modelled using serially connected II (or T) circuits.
36.4.2 Digital computer simulation
The studies to solve travelling wave problems by means of a digital computer were started in the early 1960s using two different techniques, the Bewley lattice diagram and the Bergeron method.2,3 These techniques were applied to solve small networks with linear and non-linear lumped-parameter, and distributed-parameter elements. The extension to multi-node networks was made by Dommel4; this scheme essentially combined the Bergeron method and the trapezoidal rule into an algorithm capable of solving transients in single and multi-phase networks with lumped and distributed parameters. This solution was the birth of the now very widely employed and universally accepted Electromagnetic Transients Program (EMTP).
Essentially, the trapezoidal rule is used to convert the differential equations of the network components into algebraic equations involving voltages, currents and past values. The algebraic equations are assembled using a nodal approach given as:
Very often, the network contains voltage sources to ground; the equation is then split up into part E with unknown voltages and part F with known voltages given as:
The resulting conductance matrix is symmetrical and remains unchanged as the integration is performed with a time-step size. The solution of the transient process is then obtained using triangular factorisation. One of the main advantages of this approach is that it can be applied to networks of arbitrary size in a very simple manner.
Bergeron’s method can be efficiently used with lossless and distortionless lines. However, in practice, parameters of actual transmission systems are frequency dependent. Much effort has been expanded since then into developing alternative frequency-dependent line models5,4 and these have been subsequently incorporated within the EMTP software. In this respect, it should also be mentioned that some researchers have overcome this problem by developing simulation techniques for transmission systems which are totally frequency-domain based such as the one developed by Johns and Aggarwal.7 Although the latter approach gives a very accurate solution to the problem, the principal disadvantage is that for any time-domain circuit change (most circuit changes are time-domain based), the variable in question has to be transformed into its frequency spectrum first before a solution can be effected.
The drawback of the original Dommel’s scheme was that it could be used to solve only linear networks. However, many power components such as transformers, reactors, surge arresters, circuit-breakers, etc., exhibit a non-linear behaviour. Several modifications to the basic method were thus proposed to cater for non-linear and non-stationary elements.8
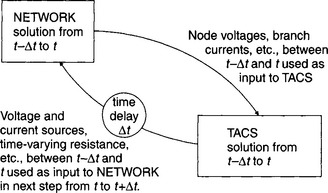
The development of the very widely used EMTP software has been evolutionary in nature. Apart from the foregoing changes, a very important development was that of a section for representation of control systems, initially motivated by studies of HVDC links. The Transient Analysis of Control Systems (TACS) option was implemented in the EMTP in 1976.9 Although the main goal was the simulation of HVDC converters, it soon became apparent that TACS had many other applications, a major attribute was in the fact that many externally developed non-linear models representing, for example, fault arcs (primary and secondary), dynamic arcs in circuit-breakers, protection relay, etc. can be interfaced to the main EMTP-based system model via TACS. Control systems are represented in TACS by block diagrams with interconnection between system elements. Control elements can be transfer functions, FORTRAN algebraic functions, logical expressions and emulation of special devices. Essentially, when employing TACS, the network solution is first advanced, network variables are next passed to the control section and then the control equations are solved. Finally, the network receives control commands. The whole procedure introduces a time-step delay as illustrated in Figure 36.5.
36.4.3 Digital real-time electromagnetic transient simulator
One of the limitations with digital computer based simulator programmes, such as the EMTP, is that a single run can take many minutes (or even hours) to complete the modelled system’s response over a period of, say one second. Such non real-time operation precludes interfacing the simulator to physical control or protection devices. Generally, testing of such devices is done using an analogue simulator (such as a TNA) or a special device which plays back, in real time, the stored results of an off-line computer simulation to the device under test.
As mentioned before, one of the drawbacks of the analogue simulator is its high capital and operating costs. Furthermore, general accessibility is low since a single study may occupy the analogue simulator for many weeks. With the playback device, major drawbacks include the long time required to obtain the simulated results coupled with the fact that only open loop testing is possible i.e. it is not possible to study the effect of circuit changes (such as those due to circuit breaker operations) within a network on the devices under test.
The principal advantages of a fully digital simulator capable of real-time operation are that it incorporates the best features of both the computer-based digital simulation tool and the analogue simulator.
36.5 Waveforms associated with the electromagnetic transient phenomena
As mentioned before, the electromagnetic transient phenomena in power system networks can have a wide range of frequencies varying from d.c. to several MHz. Modelling of power components taking into account the frequency-dependence of parameters can be practically made by developing mathematical models which are accurate enough for a specific range of frequencies. Each range of frequencies usually corresponds to some particular transient phenomena. A widely accepted classification of frequency ranges is in the following four groups (with some overlapping):
• low-frequency oscillations, 0.1 Hz–3 kHz;
• slow-fronted surges, 50/60 Hz–20 kHz;
This section illustrates some typical transient waveforms associated with the aforementioned categories of frequencies.
36.5.2 Transient waveforms
As mentioned before, a common cause of low-frequency electromagnetic transients is resonance:
(i) Sub-synchronous resonance (typically about 20 Hz) due to the interaction of an externally inserted series capacitor into a transmission line and the natural inductance of the line; such phenomenon can have a detrimental effect on the rotating shaft of a generator, bringing about its premature failure;
(ii) Ferro-resonance (typically about 16 Hz) due to the interaction of the saturable magnetising inductance of a transformer and a capacitive distributive cable or transmission line connected to the transformer. An abnormally large exciting current is drawn resulting in a significantly distorted transformer voltage output.
Slow fronted surges commonly emanate from switching of circuit breakers and shunt faults. The results involving such studies are useful for:
(i) evaluating the performance (or new design) of protection/control devices;
(ii) insulation co-ordination to determine overvoltage stresses on equipment;
(iii) determining the surge arrester characteristics;
(iv) determining the rupturing capacity of circuit breakers and/or the transient recovery voltage across circuit breakers; and
(v) assessing the effectiveness of transient mitigating devices such as pre-insertion resistors, inductors, etc.
Figure 36.6(b) typifies the three voltage waveforms, simulated at the open end of a high voltage transmission system shown in Figure 36.6(a), when the line is energised by closing the circuit breaker. It is assumed that prior to circuit breaker reclosure, the line carries a trapped charge of − 0.9, − 0.8 and 0.8 per unit on the a, b and c phases, respectively. It is apparent that the transient overvoltages produced are significantly higher than the nominal source voltage.
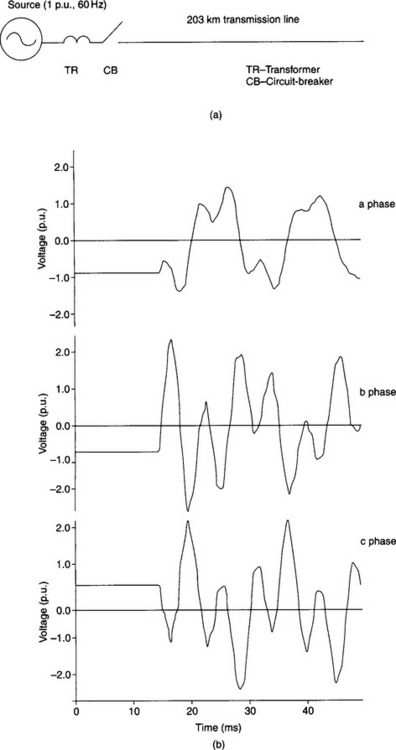
Figure 36.6 Switching transients on a high voltage transmission line: (a) the transmission system studied; (b) the voltage waveforms simulated at the line open end
The electromagnetic transient phenomena associated with faults on overhead transmission lines is largely dictated by a number of factors, the principal of which are: type of fault, fault location, fault inception angle, bus-bar terminations in terms of source capacities.7 Figure 36.8 typifies the voltage and current waveforms when an ‘a’-phase-ground fault occurs near voltage maximum of the ‘a’-phase, and at the mid-point of a 400 kV transmission system shown in Figure 36.7 (the waveforms are simulated at end S). Comparing Figure 36.8(a) and Figure 36.8(b), it is apparent that the magnitude of the high-frequency distortion is very significantly mitigated by the relatively large source capacity termination at end S.
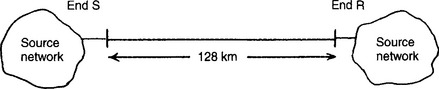
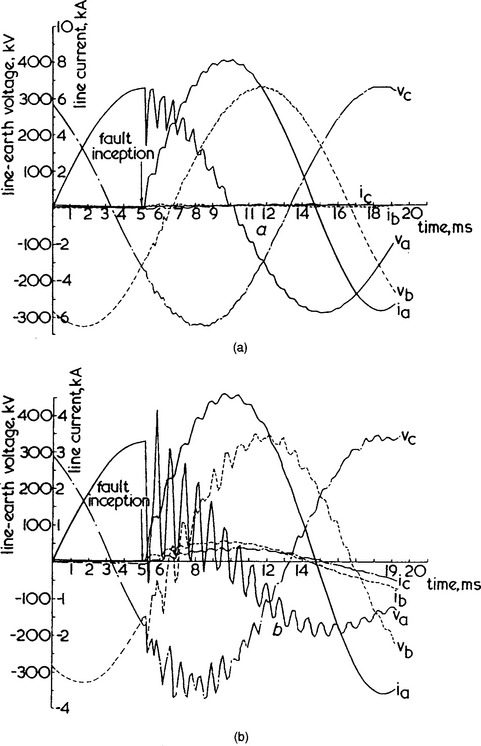
Figure 36.8 Effect of source capacities on voltages and currents: ‘a’—earth solid fault at mid-point of line; scl = short circuit level; (a) end S scl = 35 000 MVA, end R scl = 35 000 MVA; (b) end S scl = 5000 MVA, end R scl = 35 000 MVA
Figure 36.9 interestingly shows that when an ‘a’-phase-ground fault occurs near minimum of the ‘a’-phase, there is little high frequency distortion in the voltage waveforms; importantly, there is a large d.c. offset in the current waveforms.
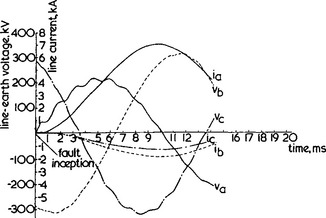
Figure 36.9 Waveforms for fault applied at voltage zero; ‘a’—earth solid fault at receiving end; end S scl = 5000 MVA, end R scl = 35000 MVA
The electromagnetic transient phenomenon of much interest is that associated with the sequence of events that take place on high voltage transmission systems employing three-phase tripping. The voltage and current waveforms simulated at end S of the transmission system as shown in Figure 36.10 very vividly depicts the electromagnetic transients generated on waveforms (voltage waveforms in particular) following a fault (time T1) and their characteristic features on circuit breaker opening (T2)/fault break off (T3). Of particular importance is the large d.c. levels on the previously healthy phases ‘b’ and ‘c’, and these are as a direct consequence of the line trapped charge; in practice, care needs to be exercised when reclosing the breakers as such d.c. levels can significantly accentuate the overvoltage phenomenon, posing serious problems for such devices as the capacitor voltage transformers (CVTs) employed for protection devices.
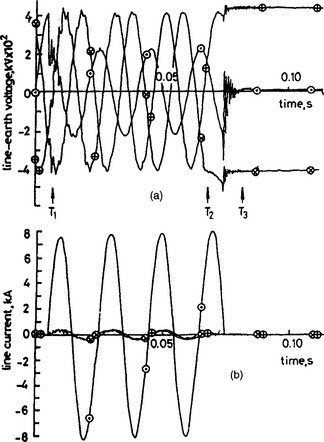
Figure 36.10 Three-phase tripping transient fault simulation; ‘a’—earth mid-point fault; T1 = fault inception (5 ms); T2 = breaker contacts at ends S and R separate (65 ms); T3 = fault breaker off (∼80ms) ![]() a—phase;
a—phase; ![]() b-phase;
b-phase; ![]() c-phase; (a) voltages on line side of breaker at end S; (b) line currents at end S
c-phase; (a) voltages on line side of breaker at end S; (b) line currents at end S
A study of the electromagnetic transient phenonemon associated with arcing faults on long distance high-voltage transmission lines, in particular those employing shunt compensation for suppressing secondary arcs in single pole auto-reclosure, is of particular interest to design engineers worldwide. Figure 36.11 depicts the voltage and current waveforms attained for an ‘a’-phase-earth fault on a shunt compensated 500 kV high voltage transmission line, 540 km in length. In the Figures, ‘t1’, signifies breaker opening time on the faulted ‘a’-phase conductor and ‘t2’ the secondary arc extinction time. Apart from the high frequency distortion, interestingly, the voltage waveforms also show the ‘slow’ beating frequency (typically 5 Hz) due to the interaction of the external shunt reactors with the natural line parameters.
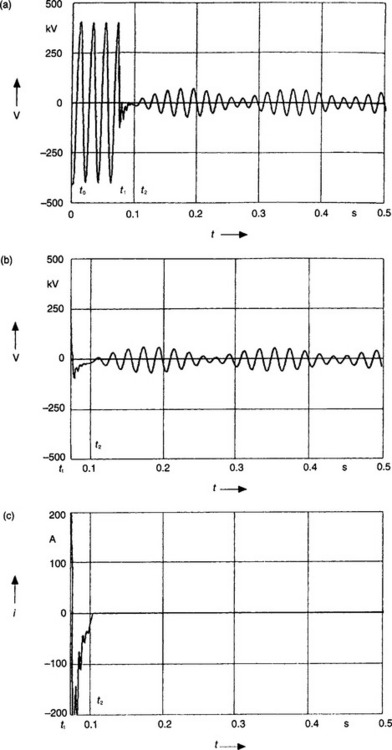
Figure 36.11 Voltage and current characteristics for a long distance practical system, phase-to-ground fault 400 km from the local end: (a) sending end voltage (t0 = 0, t1 = 0.078 s, t2 = 0.101 s); (b) secondary arc voltage; (c) secondary arc current
The waveforms presented here are only a small sample of those encountered in practice. A more comprehensive knowledge of the electromagnetic transient phenomena on high voltage transmission lines can be attained from references.7, 10–12
As mentioned before, the fast-fronted transients in power systems cover a frequency range from 10 kHz up to about 1 MHz. One of the principal causes of such transients is the lightning strikes to the transmission lines and associated backflashovers. It is important to note that although the foregoing waveforms (Figures 36.8–36.11) are also associated with faults on transmission lines caused by lightning strikes, the transients considered are at the lower-end of the frequency spectrum (< 5 kHz). The transient waveforms presented henceforth typify those encountered inside a substation and are at the higher end of the frequency spectrum. One of the important objectives of performing power system studies involving lightning surge phenomena is to design substations, principally to:
(i) establish/verify surge arrester ratings;
(ii) find optimum location for surge arresters for lightning surge protection;
(iii) determine minimum phase-to-ground and phase-to-phase clearances;
(iv) calculate mean time between failure for the substation; and
(v) determine optimum location of capacitances to reduce steepness of surges.
Figure 36.12 typifies the steep-fronted voltage waveforms at varous equipment locations inside a 230 kV substation with 500 kV insulation breakdown level (BIL) when there is a 3/75 μs lightning strike of 110 kA striking a tower approximately 150 m from the substation. It is apparent from the transient waveforms that in spite of the very large overvoltages encountered, the surges are well below the equipment BIL of the substation and this can be directly attributed to the presence of surge arresters placed at strategic points within the substation. It should be mentioned that the transients presented herein are for one case study only. However, there are situations whereby the BIL rating of the substation could be exceeded and hence it is crucial to perform a comprehensive set of studies in order to ascertain the type/rating of arresters and their optimal locations.
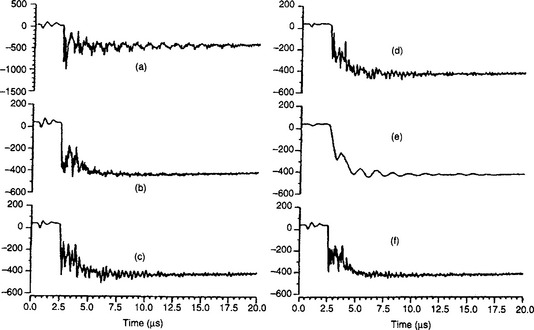
Figure 36.12 Phase-ground voltage waveforms inside the substation: (a) dead-end tower; (b) station entrance; (c) circuit-breaker; (d) remote switch; (e) operating bus; (f) inspection bus. All voltages in kV
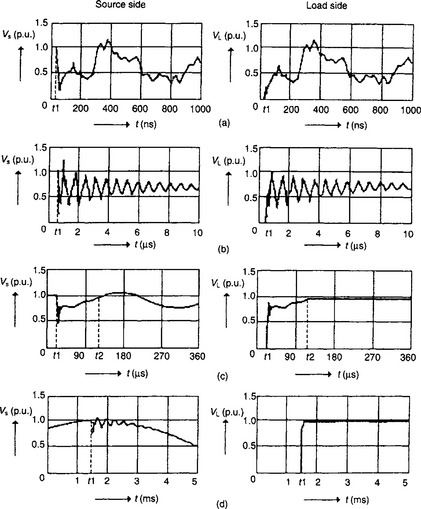
Very fast transient (VFT) overvoltages are commonly encountered in a gas insulated substation (GIS), and they are primarily generated during disconnector operations, but other events such as the operation of a circuit-breaker, the closing of a grounding switch or the occurrence of a fault can also cause VFTs. During a disconnector operation, a number of prestrikes or restrikes occur due to the relatively slow speed of the moving contact.
The generation and propagation of VFT from their original location throughout a GIS can produce internal and external overvoltages. The main concerns are internal overvoltages between the centre conductor and the enclosure. However, external VFT can be dangerous for secondary and adjacent equipment. These external transients include transient voltages between the enclosure and ground at GIS-air interfaces, voltages across insulating spacers in the vicinity of GIS current transformers, particularly when they do not have a metallic screen on the outside surface, voltages on the secondary terminals of GIS instrument transformers, radiated electromagnetic fields which can be dangerous to adjacent control or relay equipment.
An example of the foregoing transient phenomenon in an actual GIS is given in Figure 36.13, where one pre-strike of a disconnector switching is depicted showing the steep fronted voltage transients at the supply and load sides. The basic frequency component is in the MHz range; the overall transient and the steady state waveforms are also shown.
1. text book published Grainger, J.J., Stevenson, W.D. ‘Tower System Analysis’. McGraw-Hill International; 1994. ISBN 0-07-113338-0
2. Pt 3 Barthold, L.O., CARTER, G.K. ‘Digital travelling-wave solutions. 1-Single-phase equivalents’. AIEE Trans.. 1967;Vol. 80(December):812–820.
3. Freg, W., Althammer, P. The calculation of transients on lines by means of a digital computer’. Brown Boveri Rev.. 1961;Vol. 48(May/June):334–355.
4. Dommel, H.W. ‘Digital computer solution of electromagnetic transients in single and multi-phase networks’. IEEE Trans, on Power Apparatus and Systems. April 1969;Vol. 88(No. 2):734–741.
5. Meyer, W.C., Dommel, H.W. ‘Numerical modelling of frequency dependent transmission line parameters in an electromagnetic transients program’. IEEE Trans, on Power Apparatus and Systems. September 1974;Vol. 93(No. 5):1401–1409.
6. Martin, J.R. ‘Accurate modelling of frequency dependent transmission lines in electromagnetic transient simulations’. IEEE Trans, on Power Apparatus and Systems. January 1982;Vol. 101(No. 1):147–155.
7. Johns, A.T., Aggarwal, R.K. ‘Digital simulation of faulted ehv transmission lines with particular reference to very high speed protection’. Proc. IEE. April 1976;Vol. 123(No. 4):353–359.
8. Dommel, H.W. ‘Non-linear and time-varying elements in digital simulation of electromagnetic transients’. IEEE Trans, on Power Apparatus and Systems. November 1971;Vol. 90(No. 6):2561–2667.
9. Dube, L., Dommel, H.W. ‘Simulation of con- trol systems in an electromagnetic transients program TACS’. Proc. of IEEE PICA. 1977:266–271.
10. Pt C Johns, A.T., Aggarwal, R.K. ‘Digital simulation of faulted autoreclosure sequences with particular reference to the performance evaluation of protection for ehv transmission lines’. Proc. IEE. July, 1981;Vol. 128(No. 4):183–195.
11. Pt C5 Aggarwal, R.K., Johns, A.T., KALAM, A. ‘Computer modelling of series compensated ehv transmission systems’. Proc. IEE. Vol. 131(September), 1984.
12. Song, Y.H., Aggarwal, R.K., Johns, A.T. ‘Digital simulation of fault arcs on long-distance com- pensated transmission systems with particular reference to adaptive autoreclosure’. European Trans, on Electrical Power Engineering. September/October, 1995;Vol. 5(No. 5):315–324.