Overhead Lines
30.1 General
The overhead line is the cheapest form of transmission and distribution of electrical energy. Line design and construction involve several engineering disciplines (electrical, civil, mechanical, structural, etc.), and must conform to national and international specifications, regulations and standards. These refer to conductor size and tension, minimum clearance to ground, stresses in supports and foundations, insulation levels, etc. Lines must operate in conditions of large temperature change and in still air and gales, and (in non-tropical climates) may have ice formation on conductors and supports.
The structural design of a d.c. line does not differ essentially from that of an a.c. line, but electrical features related to frequency (such as inductive, capacitive and skin effects) do not apply in the d.c. case under normal operating conditions.
30.2 Conductors and earth wires
Many years of operating experience, and the costs as affected by metal market trends, have combined to favour aluminium based conductors1 (see also Chapter 5, Section 5.1.2). Copper and cadmium—copper are seldom used, even for distribution lines.
The intractability of large solid conductors has led to the almost exclusive use of stranded conductors (in spite of their greater cost), which have a larger diameter than equivalent solid circular conductors. With strands of diameter d, the outside diameter of uniformly stranded conductors is:
![]()
Aluminium based conductors in normal use are categorised as
| AAC | All-Aluminium Conductors (BS 215, IEC 207) |
| ACSR | Aluminium Conductors Steel Reinforced (BS 215, IEC 209) |
| AAAC | All-Aluminium Alloy Conductors (BS 3242, IEC 208) |
| AACSR | All-Aluminium Alloy Conductors Steel Reinforced (IEC 210) |
| ACAR | Aluminium Conductors Alloy Reinforced |
Figure 30.1(a) illustrates typical strandings of ACSR. The conductor with an outer layer of segmented strands has a smooth surface and a slightly reduced diameter for the same electrical area.

Figure 30.1 (a) ACSR conductor stranding; (b) typical cross-section of conductors containing optical fibres: (i) 28.62 mm diameter and equivalent to Zebra ACSR; (ii) 14.88 mm diameter and equivalent to half-inch-steel earthwire (OPGW)
Any of the above types can be used as an earth wire, although generally preference is given to steel. In areas where high short-circuit currents are anticipated, one layer (or more) of aluminium or aluminium alloy strands is added.
For distribution lines, any of the above conductor types can be used, but in addition mention must be made of Aerial Bundled Conductors (ABC), commercially available for systems up to 30 kV with greatly reduced environmental impact.2 They consist essentially of four PVC covered cables bunched together and strung overhead rather than underground.
Recently, there has been an increased tendency to favour earth wires with incorporated optical fibres (Figure 30.1(b)) which can be used for communication purposes. These are often referred to as optical ground wires (OPGW) (Chapter 27, Section 27.5.2). Also, developed for telecommunication purposes, all-dielectric self-supporting (ADSS) aerial optic cables with a high strength non-metallic component as support are occasionally installed. These can in fact be added at a later date (subject to a check on the mechanical strength of the structures). In such cases, a knowledge of the electric field conditions along the overhead line is required to locate the ADSS cable in a zone of minimum field strength.
30.2.2 Nomenclature
There is as yet no international agreement on nomenclature. In the UK conductors were referred to the approximate area in (inches)2 of a copper conductor having the same conductance. Nowadays, aluminium based conductors are referred to their nominal aluminium area. Thus, ACSR with 54 aluminium strands surrounding seven steel strands, all strands of diameter d = 3.18mm (designated: 54/7/3.18; alu. area = 428.9 mm2, steel area = 55.6 mm2) is described as 400 mm2 nominal aluminium area. In France the total area (485 mm2) is quoted; in Germany the aluminium and steel areas are quoted (429/56); whereas in Canada and the USA the area is stated in thousands of circular mils (1000 circular mils = 0.507 mm2).
Code names using animal, bird or flower names, etc., are also used. Thus, the 400 mm2 nominal aluminium area ACSR is known as ‘Zebra’.
30.2.3 Mechanical characteristics
The choice of a conductor from the mechanical viewpoint depends on external loading conditions (such as wind speed, ice loading and ambient temperature), and on internal characteristics (such as stranding, modulus of elasticity, thermal expansion and creep). For lines of 33 kV and over, hard-drawn AAC is not likely to be adopted; economics and creep behaviour lead to the choice of ACSR or AAAC. As can be seen from Figure 30.1(a), a wide range of breaking strength/weight ratio can be achieved by modifying the aluminium and steel content, and by using aluminium alloy strands where conditions demand. Table 30.1 gives typical properties of ACSR conductors.
As a result of many investigations into the economics of the complete overhead line (system economics) and the improved ability of manufacturers to produce alloy at competitive prices, the tendency to use AAAC on the British grid has increased. The overhead line engineer should now familiarise him/herself with names such as Totara, Rubus, Araucaria for AAAC and Collybia for ACAR.3 These are certainly favoured for refurbishment work, since they quite often permit increased transmission capacity for the same wayleaves. Probabilistic techniques applied to existing lines are one of the many factors enabling relevant decisions to be taken.
Linear expansion: The coefficient of linear expansion of an ACSR conductor per degree Celsius is given by
Some useful reference data are given in Table 30.2.
Oscillation phenomena: Exposed to wind and ice loading, overhead line conductors are subject to oscillations that affect the design and application of the conductor fittings.
Aeolian vibrations: These are typically in the range 8–40 Hz, occasionally higher, and are generated by wind speeds of 2–40 km/h. As a laminar air flow is involved, certain regions of terrain are prone to develop the aeolian phenomenon. The consequent vibration causes strand breakdown by fatigue.
As a result of international enquiries covering thousands of kilometres-years of lines, the concept of EDS (everyday stress defined as the general order of stress which exists over the larger proportion of the life of a conductor, and therefore, at or around mean temperature with little or no superimposed load) was introduced as a means of ensuring a longer conductor life before strand damage. Typical values as proportion of breaking loads are: for ACSR: 18 to 24%; for Aluminium: 17% for Aluminium alloy: 18%. The subject is now well documented and much more sophisticated techniques can be used4,5,6 to refine these values. The concept of EDS should not be underestimated as it constitutes one of the bases for ‘sag and tension’ calculations.
Subspan oscillations: These affect only bundled conductors (Section 30.4.1). They occur at a frequency of 0.5–5 Hz,7 and wind speeds of 15–65 km/h. Their intensity is considerably reduced if the ratio between subconductor spacing and conductor diameter exceeds 16.
Galloping: This involves complete spans in a fundamental mode. Amplitudes reaching the value of the sag have been recorded. Bundled conductors may be more prone to galloping than single conductors, but the latter have been known to gallop.8 It is now generally accepted that near-freezing temperatures are required for galloping to occur with conductor diameters up to 35 mm. Large conductors can gallop under specific conditions due to aerodynamic instability, even in the absence of ice.
Creep: Aluminium based conductors are subject to a permanent non-elastic elongation (‘creep’), which must be predicted with adequate precision in order that ground clearance regulations may be satisfied. Creep changes the conductor length, tension and sag, and this in turn affects the creep, as does the conductor temperature.9,10
30.2.4 Sag and tension
Almost all the elements of an overhead line are based on the mechanical loading of the conductors. The loading includes the effect of stringing tension, wind pressure, temperature and ice formation.
The configuration of a conductor between supports approximates a catenary curve, but for most purposes it may be taken as a parabola. The catenary has a constant mass per unit length along the conductor; the parabolic curve assumes a constant mass along the straight horizontal line between the points of support. The following nomenclature is employed.
The stress is f = T/a, the wind loading is ww = p2(d + 2t) and the ‘total’ loading is ![]() as the conductor and ice loadings are directed vertically downward, whereas the wind loading is directed horizontally and acts on the projected area of the conductor and its ice loading (if applicable).
as the conductor and ice loadings are directed vertically downward, whereas the wind loading is directed horizontally and acts on the projected area of the conductor and its ice loading (if applicable).
The catenary equation for a conductor between supports at the same height is expressed in terms of the distance x from the centre of the span (point of maximum sag) and of y the conductor height above this point (Figure 30.2(a)). Then

is the catenary equation. Putting x = L/2 gives y at either support and, therefore, the sag s. The hyperbolic cosine term can be expanded into a series. For typical low-sag cases all terms but the first are negligible. Furthermore, with the assumption of a uniform conductor tension throughout, the equation reduces to y = wx2/2Th, representing a parabola. Therefore, for a span L the sag is
and the length of conductor in a half-span is
For supports at different heights (Figure 30.2(b)) that differ by h, the distances of the supports from the point of maximum sag are
with the parabolic assumption. For large values of h the value of l2 may be negative, indicating that the lowest point of the conductor is outside the span, on the left of the lowest support. Such a case would involve an upward component of pull on the lower support, not admissible with suspension insulators.38
30.2.4.1 Change of state
If after erection the conductor temperature rises (because of I2R loss or of a rise in ambient temperature), the conductor expands, increasing the sag; but at the same time reduction of the tension allows the conductor to contract elastically. Furthermore, if the loading increases (owing, for example, to wind pressure and/or ice), the tension rises and the conductor stretches. Analysis of these opposing tendencies leads to a cubic equation relating tension, temperature, loading and elasticity. For two sets of conditions (subscripts 1 and 2)
Here E is the modulus of elasticity, θ is the temperature (°C) and α is the coefficient of linear thermal expansion per degree Celsius. The above equation illustrates the relationships between the various factors affecting the conductor behaviour under ‘change of state’ conditions. With the availability and extensive use of computers, much more complex and more accurate catenary equations (hyperbolic functions) can be used. Surprisingly programming is easier with those equations.
The maximum permissible stress f2 (or tension f2a) that will occur under the most onerous conditions and at a low temperature θ2 is usually accepted and known. However in tropical countries the EDS could be a starting point for the calculations. The stress f1 at which the line must be strung can then be calculated. ‘Stringing charts’ for a range of spans and temperatures can then be prepared for use by linesmen in the field. Such charts are readily prepared by computers. For convenience, for spans up to 300 m the parabolic assumption can still be used, but for longer spans, the catenary equations should be preferred.
30.2.4.2 Equivalent span
As an actual overhead line comprises a series of spans of not necessarily equal length, supported by suspension insulator sets and with tension insulators at the ends of a section, it is generally assumed that the behaviour of a section is that given by a series of equal equivalent spans, each given by
where Li is an individual span length. It is possible to improve on this estimate by use of a complex computer program.
30.2.4.3 Creep
As a result of international discussions, two distinct methods of evaluation have been adopted. The first one9, 10 is based on results of laboratory tests on complete conductors and the empirical expression
for the creep extension ε (in mm/km) in terms of conductor stress f (in kg/mm2) and temperature θ (in °C), time t (in h), a constant K and creep indices β, φ, γ and δ. Typical values of K and the creep indices are given in Table 30.3 for ACSR conductors. Evaluation of the expression for the range of operating conditions requires a sophisticated computer program. Figure 30.3 shows a predicted creep-time curve, a series of measured values and a ‘best fit’ for them, in the case of a Zebra 54/7/3.18 conductor.
Table 30.3
Creep coefficients for ACSR conductors

*Industrial processing of aluminium rod: HR, hot-rolled; EP, extruded or Properzi.

The second method10 calls for laboratory tests on single wires destranded from the conductors, or even on the wires which will be used to form the conductors. In this case, the mathematical model must allow separately for the metallurgical creep and for the geometric settlement, both contributing to the inelastic elongation.
Comparison of results for a particular conductor has shown acceptable agreement.
30.3 Conductor fittings
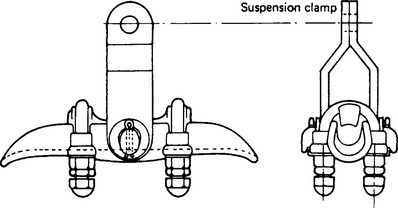
Suspension clamp Figure 30.4 illustrates a typical UK design, light and suitably profiled to limit the effects of combined static tension, compression and bending, and stresses due to dynamic bending. Positioning the axis of rotation on the axis of the conductor is considered desirable.
Tension and mid-span joints: A bolted clamp or a cone-type grip is usually adequate for monometallic conductors of small size. For composite conductors (especially when greased) compression clamps must be used for joints and conductor ends.
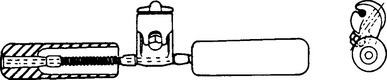
Vibration dampers: These absorb vibration energy. The Stockbridge damper (Figure 30.5) is well known. Other types, such as ‘bretelles’, festoons, Elgra, etc., have also proved successful.
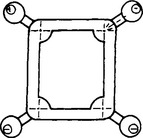
Spacers and spacer-dampers: These maintain bundled conductors in proper configuration. Experience has shown the desirability of incorporating a damping element in the fitting which then becomes a spacer-damper. Figure 30.6 illustrates such a device for a quad bundle. The specifications for such a fitting are quite complex since the damping element should desirably be efficient to damp aeolian vibrations and subspan oscillations.
30.4 Electrical characteristics
Electrical characteristics are concerned with voltage regulation and current carrying capability. The electric field strength (or voltage gradient) at the conductor surfaces affects corona and radio interference phenomena.
Voltage regulation: This must be maintained within specified limits (normally 5–12%). The voltage drop depends on the electrical line parameters of resistance, inductance and capacitance, the two latter being influenced by the geometry of the support structures and the frequency of the system. For power lines of length up to about 80 km the capacitance is usually ignored in electrical calculations.
Current rating: Aluminium is subject to annealing at temperatures exceeding 75°C. Hence 75°C is usually accepted as an upper limit for normal conditions. Higher temperatures can only be tolerated for short periods.
For design purposes, current rating is assessed from a heat balance equation: i.e. I2R loss + heat absorbed from solar radiation = heat loss by radiation + heat loss by convection. As the current rating (which has no unique value) depends on local meteorological conditions, knowledge of these conditions is paramount. Recently, probabilistic techniques11 have been introduced for the definition of current ratings, recognising that wind speeds, temperatures and solar radiation could be described by random functions. During a period of testing which preceded the calibration of the mathematical models, in the UK it was interesting to discover that the heat gained from solar absorption contributed little (if at all) to the heat input simply because higher ambient temperatures led to increased air convection currents which cancelled the effect of the heat absorption. On this basis, system operators in several countries are introducing special techniques to adapt the thermal rating of the conductors to the changing ambient conditions.
30.4.1 Bundled conductors
At operating frequency the inductive reactance of an overhead line with an equivalent spacing s′ and a conductor system of geometric mean radius r′ has the form X = K ln (s′/r′). An increase of r′ reduces the inductance (and therefore increases the capacitance) of the line; it also lowers the voltage gradient for a given working voltage. High-voltage lines can utilise bundles of two or more spaced subconductors to give an effective increase in r′. For a bundle of n subconductors each of radius r, arranged symmetrically around the circumference of a circle of radius R, the geometric mean radius of the assembly is
Bundled conductors have the following advantages:
(1) reduced inductance and increased capacitance, improving ‘surge impedance loading’, i.e. raising the power transmission capability of a long line;
(2) greater thermal rating because of the greater cooling surface area compared with that of a single conductor with the same total cross-sectional area; and
(3) lower surface voltage gradient, so reducing corona loss and radio interference.
The main disadvantage is the sometimes unsatisfactory aerodynamic performance: interbundle oscillations can occur between subconductor spacers. The effect can be controlled by judicious arrangement of spacers and spacer-dampers.7
30.4.2 Electrical parameters
Resistance: Because of the lay in strands, the current flow in a conductor is helical, developing an axial magnetic field. If the conductor has a steel core, the magnetic loss therein may increase the effective resistance by 4–5%. The proximity effect is usually negligible, but the skin effect may produce a small increase in the effective resistance.
Inductance: For a three-phase line with asymmetrical phase spacing and transposition, each phase comprising (a) a single conductor of radius r and geometric mean radius r′ (![]() 0.78r), or (b) a bundle of geometric mean radius r′ = ri, the line-to-neutral inductance is
0.78r), or (b) a bundle of geometric mean radius r′ = ri, the line-to-neutral inductance is
where s′ = (sab · sbc · sca)1/3 is the geometric mean spacing between phases ab, bc and ca. K is a correction factor for the steel core and is equal to zero when there is no steel.12
Capacitance: An isolated three-phase asymmetric transposed line with single conductors per phase of overall radius r has a line-to-neutral capacitance
As the earth is a conductor, it influences the line capacitance. An adjusted value of C is obtained by modifying the logarithmic term to [In (s′/r) − ln (s′/si)], where si = (saa′· sbb′· scc′)1/3 is the geometric mean of the respective distances between conductors abc and their images a′b′c′ across the earth plane. A similar (but much more complex) expression is required for a bundle-conductor assembly.13
30.4.3 Voltage-gradient effects
For a single conductor of radius r (in centimetres) operating at a phase voltage VPh (in kilovolts), the surface electric field strength is
where C is the capacitance of the conductor (in pF/cm). In a bundle conductor the voltage gradient is not the same at all points on a subconductor surface.13 For n subconductors each of radius r (in centimetres) spaced a distance a apart, the maximum voltage gradient (in r.m.s. kV/cm) is given by
Corona: The corona onset voltage gradient12 can be estimated from the Peek formula
where δ is the relative air density 3.92b/(θ + 273), b is the barometric pressure (in cmHg), θ is the temperature (in degrees Celsius) and r is the conductor radius (in centimetres). The number 32 is an average value of the peak breakdown electric strength of air, corresponding to about 22 r.m.s. kV/cm. Thus, a surface voltage gradient of 18–19 kV/cm r.m.s. represents an acceptable upper limit.
Radio noise: Electromagnetic fields, including interference fields, are generally expressed either in microvolts per metre (μV/m), in millivolts per metre (mV/m) or in decibels, as follows:
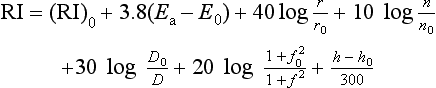
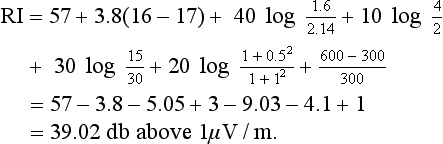
Thus, an interference level expressed as 46 dB corresponds to an electric field of 200 μV/m (i.e. 46 = 20 log (200/1)). Consequently, the radio noise from overhead lines is expressed in decibels above one microvolt per metre (dB/1 μV/m). The main source of radio interference (RI) is conductor corona which depends on voltage gradient. Other factors come into play. There are many methods for calculating RI, both analytical and empirical,39 but the following empirical formula is often accepted in which RI is the radio noise to be calculated (in dB/1 μV/m), Ea is the average surface gradient, r is the radius of the subconductor, n is the number of subconductors in the bundle, h is the altitude of the line, D is the distance of the line at which the noise is measured (typically 15–30 m) and f is the frequency at which noise is calculated (typically 0.5 or 1.0 MHz in the medium-wave band).
The suffix ‘0’ refers to the same parameters as obtained from a known line with fairly close characteristics.14 For example, a 500 kV line is designed so that Ea = 16 kV/cm, r = 1.6 cm, n = 4, D = 30 m, f = 1.0MHz, and h = 600 m.
Analysis of data for a comparable construction yields (RI)0 = 57, E0 = 17kV/cm, r0 = 2.14, n0 = 2, D0 = 15, f0 = 0.5 MHz, and h0 = 300 m.
Before the design of the line is accepted, it is necessary to obtain the strength of the radio signal received at the position of the line. The decision will be governed by the desired quality of reception, on the basis of the following table:
| Class of reception | Quality of reception | Approximate signal/noise ratio |
| A | Background undetectable | 32 |
| B | Background detectable | 27 |
| C | Background evident | 22 |
| D | Background evident but speech still understood | 16 |
If, for example, a class of reception B is desired, in the case of the line mentioned above, the signal strength received at 30 m from the axis of the line should be 39.02 + 27 = 66.02 dB/1 μV/m under fair weather conditions. If this is not the case, another look at the design or at the route of the line would be justified.
Under foul weather conditions, the radio noise from the line would be some 10 dB/1 μV/m greater.
30.4.4 Distribution lines
Voltage regulation: For distribution lines of short length, the capacitance is usually ignored and the voltage drop is given by:
where I is the current in the line, l is the length of the line, R is the resistance per unit length, X is the inductive reactance per unit length and V is the nominal voltage. Unfortunately, for conductors greater than approximately 100 mm2 the reductions in resistance and reactance as a function of increased conductor sizes are small.2 Table 30.4 and Figure 30.7 illustrate this point. Hence, using conductors with a cross-section above 2 × 102 mm2 is unlikely to have a serious impact on regulation.

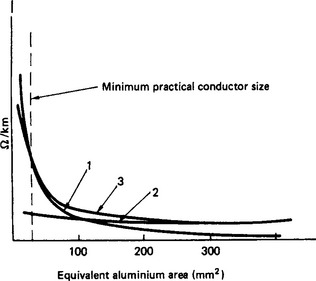
Figure 30.7 Plots of (1) the resistance, (2) the reactance and (3) R cos φ + X sin φ for the data given in Table 30.4. Drawn for 11 kV line and cos φ = 0.8 (typical only)
Quick method of design: When the voltage regulation is likely to be the controlling factor in the selection of conductors, then the technique of kVA · km is useful.2 It can be shown that, for 10% voltage drop:
i.e. if the regulation is not to exceed 10%, then the kVA loading of the line multiplied by its length (kVA · km) must be equal to the right-hand side of the above equation. Table 30.5 illustrates some answers.
Table 30.5
The kVA km product for a 10% voltage drop and cos φ-0.9 for all-aluminium alloy conductors (AAAC)

*Voltage gradient exceeds 18 kV/Cm. Conductor not recommended for this voltage.
30.5 Insulators
Air is ubiquitous and is an excellent insulator. The performance of air gaps is well known as regards breakdown as a function of electrode geometry, so that clearances between phase conductors and from conductors to ground can be determined. However, at line supports it is necessary to provide man-made insulators to maintain adequate air gaps and to provide mechanical support.
The electric stresses applied to an overhead line are: (1) internal stresses resulting from (a) normal power frequency voltage, (b) power frequency overvoltage caused by faults or abnormal conditions, and (c) impulse overvoltage (switching); and (2) externally applied stresses due to lightning. Insulation requirements strongly affect the support tower geometry.
The insulation of an overhead line cannot be determined in isolation. It has to be co-ordinated with the system of which it is a part15, 16 and meet specific requirements.17, 18 (See also Chapter 7, Section 7.2.3.)
30.5.1 Types
The most common materials are porcelain (ceramic) and glass. Porcelain insulators are surface glazed, usually in brown but occasionally in other colours (e.g. blue) for reasons of amenity. With glass, the toughening process develops two zones, an outer layer in compression, an inner layer in tension. Damage to the outer skin usually results in an ‘explosion’ of the unit. This feature is sometimes regarded as a maintenance advantage, as a damaged unit is readily observed by foot or helicopter patrols.
Although the above materials have been considered suitable for insulation purposes as from the early days of overhead line engineering, designers, laboratories, manufacturers, etc. have been investigating not only new shapes, but also new materials to improve the electrical and mechanical performances of insulators. Thus, in the last few decades, composite insulators, consisting of a high mechanical strength core of parallel glass fibres, within a body of synthetic rubber or cycloaliphatic resin, with improved insulating properties, have been actively investigated with a high degree of success. In fact the combination of such materials offers the possibility of almost endless permutations of strength with a large degree of freedom in the shapes.42
Composite insulators have also the added advantage of being more resistant to vandalism than the classical types. They are now used at all voltages from distribution to EHV. It is not always appreciated that on an angle tower at 745 kV the weight of classical insulators could reach 30 tonnes, whereas a single man could carry each tension set if it consists of composite insulators.
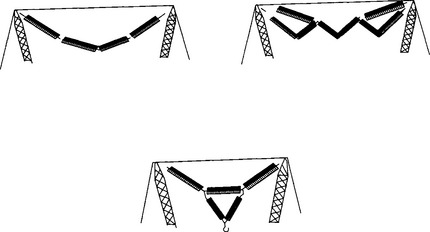
Figure 30.8 shows some types of insulator units and sets:

Figure 30.8 Typical insulator units and insulator sets. (a) Shackle insulator; (b) pin insulator; (c) post insulator; (d) normal cap and pin unit; (e) anti-fog cap and pin unit; (f) aerodynamic cap and pin unit; (g) insulator set (single string); (h) 500 kV vee insulator set; (i) composite pin insulator on 11 kV line (courtesy of EA Technology Ltd, Capenhurst)
(a) Shackle: for low-voltage distribution lines.
(b) Pin: used for voltages up to 33 kV (occasionally 66 kV).
(c) Post: used up to 66 kV, mainly for the support of air insulated bus-bars.
(d) Cap and pin: as elements in insulator strings.
(e) Anti-fog cap and pin: for regions of high pollution level, especially if humid.
(f) Aerodynamic cap and pin: for desert regions.
(i) Composite insulator on 11 kV line (by courtesy of EA Technology Ltd, Capenhurst)
The elements (d), (e) and (f) can be assembled into one, two or more strings in parallel. Vee types (h) are often favoured for extra high voltage (EHV) lines, as they show economic advantage.
30.5.2 Selection
As insulators must meet specified criteria, the choice of type, configuration, etc., is complex. Units are characterised by lightning impulse voltage; power frequency voltage when wet; electromechanical failing load, mechanical load and puncture voltage (when applicable); and dimensions, of which creepage path is the most important parameter for selection.
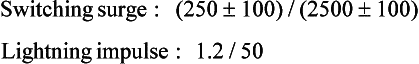
In addition, strings or sets are characterised by: lightning withstand voltage (dry); switching impulse withstand voltage (wet); and power frequency voltage (wet). The wave shapes for switching surge and lightning impulse tests have been standardised in terms of time to crest and time to half-value on the tail. These, in microseconds, are:
The performance of an air gap depends on the electrode shapes and on the applied voltage wave shape. Figure 30.9 shows typical values for a rod/plane gap. Comparable information (or correction factors) is needed for other configurations.19 The types of gaps are as follows:

Figure 30.9 Insulation strength of rod/plane air gaps. A, 200/3000 μs, negative, switching surge; B, 200/3000 μs, positive, switching surge; C, 1.2/50 μs, negative, impulse; D, 1.2/50 μs, positive, impulse; E, 50 Hz, power frequency
Rod/plane: live ends of insulators and fittings to structure and ground.
Conductor/structure: inside or outside a tower window, outer phases to any part of the tower.
Conductor/plane: clearance at mid-span to ground, or conductor jumper to cross-arm.
Conductor/conductor: flashover between phases or between conductor and earth wire.
For insulation co-ordination, the electric strength of the air gaps must be about 10% greater than that of the insulators.20
Up to about 400 kV, line insulation is governed by the requirements of creepage distance. For higher voltages, switching-surge considerations predominate.
30.5.3 Pollution
A first approximation to the number of units in a string is by an assessment of the intensity of pollution in the area, adopting a creepage distance of 18 mm/kV of line voltage for clean air and up to 30 mm/kV or more for severe pollution.3, 21
Insulator surfaces may be contaminated by dust and dirt, whose composition varies according to the area where the line is built. If frequent rains occur, these layers may be washed, but occasionally insoluble layers are formed in the presence of mist or dew; and in the absence of heavy downpours, they reduce the insulation resistance of the insulators. Under certain conditions, flashover can occur which ionises a path in air, providing a channel for follow-currents at power frequency.
To assess the insulation performance of insulators under pollution, two series of tests have been devised.22
(1) Salt-fog method: generally representative of coastal areas or of zones where rain can wash the insulators. In this test, insulators are submitted to electrical stresses in an artificial fog of variable salinity.
(2) Solid-layer method: generally representative of industrial zones or desert areas where a solid crust of insoluble deposits can be formed. In this test, the insulators are covered with a special mixture attempting to reproduce natural pollution.
If measurements are made of leakage currents under natural pollution (e.g. at an open-air station), these can be reproduced in the laboratory by varying either the degree of salinity or the composition of the solid layer. Thus, a correlation can be found and a rational assessment can be made as to the ultimate behaviour of the insulators.
Work has been done on palliative measures such as coatings of hydrocarbon or silicon grease, or live-line working. These measures are normally restricted to specific areas.
30.5.4 Voltage distribution over insulator strings
When assessing radio noise from an insulator string, it is desirable to know how the voltage along the string is distributed. This can be found by test: (1) a small spark-gap of known flashover voltage is connected across the cap and pin of one insulator element; and (2) the voltage across the string is raised until flashover at the spark gap, giving the voltage across the element as a fraction of the test voltage. Table 30.6 gives the results of such a test for a string of porcelain elements of diameter 254 mm, the string having no protective devices. It will be noted that, for strings with eight or more units, the live-end unit carries 0.20–0.24 of the string voltage, and the second 0.13–0.15.
Table 30.6
Voltage distribution over insulator strings without grading fitting
| No. of units | Unit number from live end | Voltage across unit (%) |
| 4 | 1, 2, 3, 4 | 32, 24, 21, 23 |
| 6 | 1, 2, 3, 4, 5, 6 | 25, 18, 14, 13, 14, 16 |
| 8 | 1,2,3,4,5,6,7,8 | 24,15,13,11,9,8,9,11 |
| 12 | 1, 2, 3, 4, 5, 6, 7, 8, 9, 10, 11, 12 | 23, 13, 10, 8, 7, 6, 5.5, 5, 5, 5.5, 6, 7 |
| 16 | 1,2,3,4,5… | 20,13,9,7.5,5.5… |
The application of grading rings and horn fittings modifies the voltage distribution by introducing capacitance in shunt with the line-end units to reduce the voltage across them.
30.6 Supports
The supports of an overhead line have the greatest impact on visual amenity. They cannot be hidden, but their appearance may be made less objectionable.
30.6.1 Materials
Common structural materials are wood, concrete, tubular or rolled-section steel and aluminium alloys. Choice is governed by economics, availability, resistance to deterioration (e.g. by termites in wood, and corrosion in steel), and sometimes by problems of transportation and erection. When helicopters are used in regions of difficult access, aluminium alloy structures may show a lower cost of installation that counterbalances their greater prime cost.3
Wood poles are usually preferred for low voltage distribution lines; they have been used for 345 kV lines in the USA and 132 kV in the UK, but normally wood poles are unlikely for voltages over 66 kV.
Concrete (reinforced, prestressed or spun) has for poles the drawbacks of weight and fragility during transport. Concrete poles have been employed for lines up to about 220 kV. The material is unlikely to be competitive unless local production facilities are available or there are constraints on imported material.
Steel, the material most preferred, can be fabricated in convenient lengths for transport after rolling into angles, beams and rounds. Parts are readily bolted together, facilitating unit-type construction. Steel for overhead lines is normally galvanised by the hot-dip process (BS 729) as a protection against corrosion. In clean air, galvanising can ensure 30–50 years of trouble-free life. Where the atmosphere is potentially corrosive, it may be necessary to paint steel structures after 10 years or less. Two grades of steel are commonly applied to line towers, viz. grade 43A and grade 50B (high tensile) to BS 4360, the latter grade showing advantage in weight reduction.
Aluminium alloy is advantageous in special cases (sites difficulty of access or with corrosive atmospheres). A structure of this material is 0.6–0.75 of the weight of an equivalent steel tower, but its cost may be three times as much.
30.6.2 Configurations
There is a considerable variety in configuration: the more usual forms are shown diagrammatically in Figure 30.10 for wood poles and Figure 30.11 for steel towers.

Figure 30.10 Typical wood pole constructions for 415 V to 132 kV: (a) low voltage single member pole; (b) 11 kV single member pole; (c) 132 kV support with composite (polymeric) insulators; (d) 132 kV portal (H) structure with standard insulator sets

Wood poles: These are more economical than lattice-steel supports for lines having spans less than about 200 m and are widely used for distribution in rural areas at voltages up to and incuding 33 kV. Where ample supplies of wood are available, e.g. in Sweden and parts of America, they have been used for lines up to 220 kV; at these high voltages the portal type of construction is essential to keep the length of pole to a minimum. For lower voltage lines the single pole is generally used, although its transverse strength can be increased three or four times by using two poles arranged in A or H formation. The cross-arms in both the single and the portal types may be of wood or steel, the latter being more usual. A zinc or aluminium cap covers the top of the poles to protect the end grain. The life of a red fir pole, if properly creosoted, is 25–30 years, although British fir or larch has a shorter life.
Wood is an insulator, so that the pole adds to the insulation strength between the conductors and earth and renders flashover due to lightning less likely. On the other hand, if a pole is struck, it may be shattered, causing complete failure of the line. The probability of shattering can be reduced by earthing all metal supports for the insulators either individually at each pole or by connection to a continuous earth wire.
Tubular steel poles: These are being increasingly used in the UK, because of the reduction in timber supplies. They are usually formed from three tapered, hollow sections, which rest inside one another during transportation and storage, and which are assembled on the site by means of a special winch, or are driven together by a sledgehammer or wooden maul.
Steel towers: These are employed where long spans and high supports are needed. Normal spans of 200–500 m are usual, with special cases (such as river crossings) requiring spans up to 2 km. Lines of 66 kV and over usually have lattice steel supports, especially if they are double-circuit lines.
The lattice-steel support may be of the broad base (Figure 30.11(b)) or rigid type, in which each leg of the support has a separate foundation, or of the narrow base or flexible type, with only a single foundation (a). The latter is, of course, cheaper, but is less resistant to the twisting moment caused by a broken conductor; on the other hand, it gives some flexibility in the direction of the line which tends to relieve the forces to some extent. The narrow base may also simplify wayleave problems in cultivated areas on account of the smaller area occupied.
Double-circuit lines (c) are more economical than two single-circuit lines, although for a given voltage the tower height is greater. There is the possibility of both circuits being affected simultaneously by lightning, but wayleave problems are eased.
The cat’s head horizontal configuration (g) minimises height and reduces the possibility of conductor clashing, but line erection is complicated by having to thread one phase through the steelwork.
The tower (f) for a single-circuit d.c. line is simpler, smaller and 20–30% cheaper than a three-phase single-circuit tower to carry the same electrical load.
The 400 kV double-circuit tower (d), widely used in Britain, is 50 m high and may interfere with amenity. To avoid this the lower type (e) may be used but is 10–15% more expensive.
Compacted lines: Overhead Line Engineers have always been conscious of the fact that their structures could be an eyesore on the countryside, and one way to deal with this aspect would be to reduce their visual impact.
There is no internationally agreed definition of ‘compact lines’. Essentially, it is a subjective assessment of the visual impact of the lines on the countryside. It may be that some countries (e.g. Germany, Japan, etc.) would consider as compact lines those that carry an increased number of circuits, thereby avoiding the need to negotiate new wayleaves, but at the expense of wider existing wayleaves for the ‘compacted lines’. Other countries would just re-arrange the positions of the circuits on the supports to reduce height at the expense of increased width.
An illustration of the later concept is given by Figure 30.11(d) and (e) for towers in the UK drawn to the same scale and designed to transmit exactly the same electrical power where (e) illustrates the compacted design.
When the phase conductors are supported by vertical suspension insulators (e.g. Figure 30.11(d)), considerations of electrical clearances can lead to fairly high structures (see next paragraphs on tower top geometries). Almost invariably, because of the presence of earthed steelwork, the horizontal separations are greater than would be justified by straightforward electrical or dynamic (wind induced motions) considerations.
Cap and pin insulators (Figure 30.8(f), (d), (e)) can only be used in tension and cannot accept compression loads. However, if an insulator set is made up of long rods, or composite insulators, some degree of compression can be accepted, a feature which can be used to achieve an assembly which could control the horizontal swing of insulators at the towers. A reasonable horizontal spacing can also be achieved by using ‘V’ sets, provided that the inside angle of the ‘V’ is properly selected as function of the horizontal wind loads and of the vertical conductor weight span loads. Such a solution is shown on Figure 30.11(e) where the phase spacing between the two outer phases is much smaller than on the adjacent tower with vertical sets.
Clearly then the choice of the insulators has a profound impact on the aesthetics of towers. The structure on Figure 30.10(c) can be considered as an element of a compact line.
Figure 30.12 illustrates some possible tower top geometries with no steelwork between the conductors. The horizontal spacings are only governed by electrical and dynamic considerations. It is thus possible to reduce the visual impact due to height, but at the expense of an increased volume impact of a conglomeration of insulator sets. Slim composite insulators would clearly reduce such an impact. Unfortunately installation costs may be increased as conductor stringing may prove more complex.
30.6.3 Tower geometry
Considerations of system design will decide whether a line should carry a single or a double circuit. The choice is influenced by the problem of wayleave. In the UK most grid lines carry a double circuit; elsewhere a multiple-circuit construction to accommodate circuits of different voltages is sometimes used.
The geometry of the tower top is controlled essentially by electrical considerations.
(1) Height to bottom cross-arm: the sum of the clearance to ground, the sag and the insulator-set length.
(2) Vertical spacing: the sum of the electrical clearance plus the insulator length.
(3) Horizontal spacing: (a) in still air, a clearance at least equal to the impulse strength of the insulation; (b) in wind conditions (on the assumption that a fault is unlikely to occur during maximum wind speed), a clearance corresponding at least to the power frequency withstand voltage of the air gap; the deflected position of the insulator string determines the cross-arm length.
It is generally found that horizontally placed conductors have sufficient clearance when they are separated by earthed steelwork. For exceptionally long spans, or when two conductors at the same level are on the same side of the structure, their minimum separation should be
where s is the maximum sag of the conductor in the span, l is the length of a suspension-insulator set, V is the line voltage (kV), K1 = 0.6 × K3 (usually 0.7 < K1 <0.9), ![]() where W is unit weight of conductor (kgf/m) and p is 50% of wind design pressure (kgf/m) per unit length; and
where W is unit weight of conductor (kgf/m) and p is 50% of wind design pressure (kgf/m) per unit length; and ![]() . The expression is empirically based on the performance of long spans.
. The expression is empirically based on the performance of long spans.
The phase geometry of single-circuit lines is either triangular or horizontal. Double-circuit lines are more likely to have a vertical formation. From the system viewpoint, a triangular arrangement results in minor imbalance of the phase impedances (see also Section 30.7).
30.6.4 Foundations
Foundations3 must be adapted to the loadings that they have to withstand and the properties of the soil, i.e. cohesion C, angle of internal friction ϕ, and density γ.
For single poles and narrow-based towers, the foundations are designed on overturning; for broad-based towers, on uplift/compression. Compression effects are well documented, but uplift has been the subject of lengthy investigation.23
Overturning (monobloc) foundations: Resistance to overturning is of the form M = kbd3 for a width b and a depth d. The coefficient k depends on the shape of the bloc and the properties of the soil.
Uplift foundations: In the UK, where ‘pad and chimney’ foundations are favoured, it is customary to assume that the resistance to uplift is due to (a) the dead weight of the foundation and (b) the weight of the earth contained in a volume of a frustum defined by the base of the foundation and an angle to the horizontal reflecting the soil properties. In addition, the ‘chimney’ is designed in bending. A general expression for the uplift resistance24 is
where A is the lateral area rising from the base of the foundation to the surface of the soil, d is the depth, pc is the weight of concrete and ps is the weight of soil above the foundation, and q is the overburden pressure for foundations set below the critical depth. The critical depth is a function of the geometry of the foundation and of the soil parameters. The constants k depend on the type of soil. In a pad and chimney foundation the pad can be shaped by formers or cast on site into an excavated hole. When access is difficult and concrete expensive (because of lack of available water or aggregates), grillage pads may be considered, as individual bars can be transported to site. In bad soils pile or raft foundations may be used; in good rock the foundation may employ rock anchors.
30.7 Lightning
Lightning results from a phenomenon in which the clouds in the ambient atmosphere acquire substantial electric charges, with corresponding potentials which may be several megavolts. When the limit breakdown value of the air is reached, a lightning discharge takes place between clouds, or between clouds and earth. Because of their height, overhead transmission lines ‘attract’ lightning discharge. Data are available for the percentage of days when thunder is heard20 and the number of flashes to earth per annum per unit area. The ‘keraunic level’ is the number of days thunder is heard in a year.
30.7.1 Mechanisms of insulation flashover
A lightning stroke to ground near a line discharges the energy in the cloud very rapidly, initiating by travelling wave action an induced voltage rise across the insulators. The problem arises only at line voltages of 66 kV and less, for which lines it would be uneconomic to provide a complete guard against this hazard.
30.7.1.2 Shielding failure
Shielding failure occurs when the leader stroke of the lightning discharge bypasses the earth wire (which is usually at ground potential) and strikes a conductor. Some protection against this hazard is provided by positioning the earth wire(s) above the conductors. Analytical models25 have been evolved for the calculation of the appropriate position(s). A shielding angle of 30° is generally adequate: the angle is that between the vertical through the earth wire and the line joining the earth wire and the protected conductor. However, in areas of high lightning intensity, zero (or even negative) angles have been used.
30.7.1.3 Back-flashover
Figure 30.13 shows that about 10% of lightning strikes involve a current i exceeding 50 kA of very steep wavefront. When lightning strikes (a) a tower or (b) an earth wire, their potential may be raised to a value well in excess of the insulation level, possibly high enough to cause flashover to the line conductors.
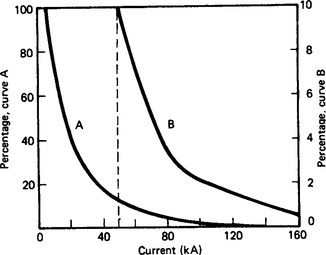
Figure 30.13 Lightning strike magnitude probability curves. Abscissa: lightning strike peak current (kA). Ordinate (left side): percentage of strokes exceeding abscissa. A, Ordinate (right side): percentage of strokes exceeding abscissa. B, for lightning currents exceeding 50 kA
Tower: If the tower resistance (mainly that of the footing) is R and the inductance as a vertical circuit element is L, then the potential of the tower top will be raised from zero to v = Ri + L(di/dt). This simple approach illustrates the effect of the basic parameters: a more critical study would be required to take account of capacitive and inductive couplings between conductors, the effects of multiple reflections, etc.
Earth wire: Given that the surge impedance of the earth wire is Z0, a lightning strike raises the earth wire potential from zero to v = 1/2 Z0i. Two travelling waves are propagated in opposite directions from the point of strike, until each reaches a tower top and is partially discharged through the tower to ground, as in A in Figure 30.13.
30.7.2 Lightning performance
Various methods (ERA,20 IEEE26 and EPRI27) have been evolved, and refined in the light of experience, for the estimation of the lightning performance of overhead lines. The basic step is the calculation of the potential rise of the tower top or earth wire as a function of the lightning current discharged to ground. It is then necessary to develop an analytical model to include the statistical distribution of current wave shapes, grounding parameters, leader approach angles, ground flash density, back-flashover and shielding failure.28,29 The ERA method employs a step-by-step procedure clearly demonstrating the factors affecting line performance; the IEEE method, easier to apply, is based on generalised graphs. The EPRI method is very explicit.
In overhead-line design, some parameters will depend on lightning as they affect the number and positioning of earth wires, the length of insulator strings and tower-footing resistance. Further considerations relate to tower height, phase configurations and span lengths. It is now accepted that an earth wire with 10% smaller sag than that of the associated conductor minimises the likelihood of mid-span flashover between them. The main purpose of an earth wire is to shield phase conductors from direct strokes, which would almost always result in insulator flashover.
Increased tower height attracts more lightning strokes. Thus, the lightning performance of a line is improved by shorter towers (and consequently shorter spans). Short towers with wide bodies have lower surge impedance. But in many cases it is economic considerations that settle the final choice.
30.8 Loadings
The mechanical loadings on an overhead line are due to conductor tension, wind, icing and temperature variations. The design regulations or codes of practice in most countries were based on the concepts of external working loads multiplied by different factors (often termed factors of safety, overload factors, etc.) to evaluate ultimate (or limit) loads which were compared with the strength of components. In the UK, the earlier Regulations30 gave some loadings which were to be compared with a proportion of the strength of components. For the first time, the expression ‘factor of safety’ was avoided, but the concept is still used in many international regulations. In the UK, the utilities (e.g. National Grid Corporation) in fact use higher loads than those specified in these Regulations. In many cases, the origins of the loads and the factors used are never very clear.
Actually, in 1988, a new set of Regulations was published in the UK31 which concentrates mainly on electrical safety, but is exceedingly concise regarding the loadings to be applied to an overhead line. In fact, they only state that the ‘… works shall be sufficient for the purposes for, and the circumstances in, which they are used…’. The onus for the adequate performance lies with the operator and the designer. As a result of international discussions a probabilistic approach is now gaining acceptance.40, 41
Accepting (Figure 30.14) that the load effects on an overhead line are random32, 33 and can be expressed by a probability density function of extreme values (Gumbel type 1) fQ(X), that the strength of the components can be expressed by a normal probability density function (Gaussian) fR(X), new probabilistic approaches have been evolved34 which are likely to be used by specification writers.3 (In Figure 30.14 the strength function is shown as a cumulative distribution, FR(X).) These two functions lend themselves to mathematical treatment and are defined when a mean value and a standard deviation can be evaluated from measurement data. The area under the two overlapping curves is a measure of the risk (in this zone there is a probability that the load is greater than the strength), and they can be located with respect to each other in such a way that a small value of risk can be obtained. The smaller the risk (probability of failure) the greater the reliability. It will be seen that mathematically 100% reliability cannot be achieved. This feature is not due to the approach, it is a hard real fact, except that in the conventional deterministic treatment there is no way to quantify the reliability of a construction.
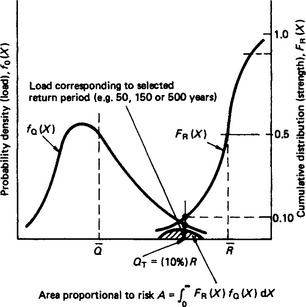
Figure 30.14 Principles of risk assessment35
Some documents34 have been revised and incorporate comments35 which have already been made. Several application examples have also been published.36, 37
Three important concepts have been introduced:
(1) Reliability (structural) is the probability that a system performs a given task under a set of conditions during a specified time. Reliability is thus a measure of the success of a system in accomplishing its task. Reliability, being a probabilistic concept, should always be quantified.
(2) Security (structural) is the ability of a system to be protected from a major collapse (cascading effect) if a failure is triggered in a given component. Security is a deterministic concept.
(3) Safety (structural) is the ability of a system not to cause human injuries or loss of lives. In these documents, safety relates mainly to protection of workers during construction and maintenance operations. The safety of the public should be covered by National Regulations.
A useful concept in deciding loading effects is that of the ‘return period’ of a given loading (e.g. wind speed and related pressure). Due to Gumbel, the return period is the mean time between the occurrences of a phenomenon equal to (or greater than) a specified value. As return period T is related to probability p by the expression T p = 1 it follows that a loading event with a return period T = 50 years has a probability p, of 2% of being exceeded in any one year.
In order to rationalise the concept of strength, it is suggested that the value corresponding to 10% exclusion limit (hence with a 90% probability of exceeding this value) would be used as reference. In Figure 30.14, the load equal to a return period of T (years) is compared with (or made equal to) the strength at 10% exclusion limit. The area under the two overlapping curves is a measure of the annual risk Pf. The annual reliability Ps of this arrangement is:
If σQ is the standard deviation of the load, σR that of the strength, and ![]() and
and ![]() are their mean values then the coefficients of variation are
are their mean values then the coefficients of variation are ![]() for the load and
for the load and ![]() for the strength.
for the strength.
As an order of magnitude, when VQ = 0.3 and VR = 0.10 then for a return period of load of 50 years, Ps = 0.98 and for a return period of load of 150 years Ps = 0.993.
One assumption made in the probabilistic approach is that one component would be selected to be weaker than the others, hence the reliability of the line would be that of the weakest component. All the other components would have to be designed in such a way that there is a given probability that they are stronger. Figure 30.15 expresses this concept.35
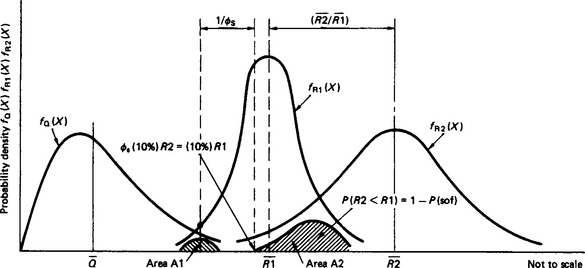
Figure 30.15 Definition of the strength coordination factor φs. P(R2 < R1) = 1 − P(sof) is the probability that strength R2 is smaller than strength R1. It is equal to one minus the required probability for the sequence of failure. Not to scale
Thus if the area (A1) is a measure of the risk that the load may exceed the strength of the component, the area (A2) is a measure of the probability that component R2 may be weaker than component R1.
Some typical values of the strength coordination factor φs are given below, for 90% probability that the desired probability of failure will be achieved (R1 to fail before R2):
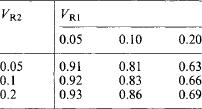
where VR1 is the coefficient of variation of component R1 and VR2 is the coefficient of variation of component R2.
The basic mathematical model used for the probabilistic design of the line is given by the following general design equation:
All documents dealing with reliability accept this design approach. Some may be more specific as to whether QT is a wind load, an ice load or wind on ice load. If QT is considered as any load due to meteorological influences, with a return period of T years, the above relationship is always valid.
In this relation, and for IEC documents:
γu is the use factor coefficient applied to load;
QT is the load corresponding to a return period T. This is the limit (or ultimate) load for design purposes (50, 150, and 500 years are accepted as references);
φR is the global strength factor;
Rc is the characteristic or nominal strength;
φc is the correction factor referred to the exclusion limit of material strength;
φN is the factor related to the number N of components subjected to the critical load;
φq is the factor related to the quality level of a component during fabrication and/or construction; and
Values for these factors are given in tables34, 35 together with the necessary justifications, and the equations required for their evaluation. A reasonable tool is thus available to the overhead line engineer for the mechanical design of the line. No doubt a fair amount of calibration will still be needed. However comparisons of alternative designs become possible not only with regard to economics, but also with regards to relative reliabilities.
1. Ash, D.O., Dey, P., Gaylard, B., Gibbon, R.R. ‘Conductor systems for overhead lines some considerations in their selection’. Proc IEE.. 126(4), 1979.
2. Orawski, G., Bradbury, J., Vanner, M.J. ‘Overhead distribution lines-some reflections on design’. IEE Proceedings, Part C. 133(7), November 1986.
3. September Adam, J.F., Bradbury, J., Charman, W.R., Orawski, G., Vanner, M.J. ‘Overhead lines-some aspects of design and construction’. IEE Proceedings, Part C. 131(5), 1984.
4. Study Committee 22 Report. ‘Aeolian vibration on overhead lines’. In CIGRE Paper 22-11. Paris; 1970.
5. Ieee Committee Report. ‘Standardisation of conductor vibration measurements’. IEEE Transactions on Power Apparatus and Systems. Pas-85(1), 1966.
6. Cigre, Study Committee 22, Working Group 04. Endurance Capability of Conductors, Final Report. (July):1988.
7. Price, S.J., Allnutt, J.G., Tunstall, M.J. ‘Subspan oscillations of bundled conductors’. IEE Conf Progress in Cables and Overhead Lines for 220 kV and Above. (September):1979.
8. Wates, R.H., Jackson, G.B., Davis, D.A., Erskine, A., Brown, R.C., Orawski, G. ‘Major high voltage long span river crossings in Great Britain’. In CIGRE Paper 226. Paris; 1964.
9. Bradbury, J., Dey, P., Orawski, G., Pickup, K.H. ‘Long term creep assessment for over-head line conductors’. Proc IEE.. 122(10), 1975.
10. CIGRE SC22-WG05 . ‘Permanent elongation of con-ductors Predictor equations and evaluation methods’. Electra. 75(March), 1981.
11. September Price, C.F., Gibbon, R.R. ‘Statistical approach to thermal rating of overhead lines for power transmission and distribution’. IEE Proceedings, Part C. 130(5), 1983.
12. Butterworth, S., Electrical Characteristics of Overhead Lines, ERA Report O/T4. 1954.
13. Specification for CIS PR Radio Interference Apparatus for the Frequency Range 0 15 MHz to 30 MHz, CISPR Publication No 1, IEC
14. Anon . ‘Survey of extra high voltage transmission line radio noise’. Electra. (January):1972.
15. Insulation Co-ordination, IEC Standard-Publications 71-1, 71-2 and 71-3
16. BS 5622: Guide for Insulation Co-ordination Part I, Terms Definitions, principles and rules. Part II, Application guide, Milton Keynes
17. Tests on Insulators of Ceramic Material or Glass for Overhead Lines with a Nominal Voltage Greater than 1000 V, IEC Standard—Publication 383
18. BS 137 Specification for Insulators of Ceramic Material or Glass for Overhead Line with a Nominal Voltage Greater than 1000 V Part 1, Tests, Part 2, Re
19. Paris, L., Cortina, R. ‘Switching and light-ning impulse discharge characteristics of large air gaps and long insulator strings’. IEEE Trans.. Pas-87(4), 1968.
20. Morris, T. A. and Oakeshott, D. F., Choice of Insulation and Surge Protection of Overhead Transmission Lines of 33 k V and Above, ERA Report O/T14
21. IEC. ‘Guide for the selection of insulators in respect of polluted conditions’. IEC Publication 815. 1986.
22. Artificial Pollution Tests on High Voltage Insulators to be Used on a.c. Systems, IEC Report, Publication 507
23. prepared within scope of WGO7 of CIGRE SC22 Martin, D. ‘Design of uplift foundations’. ELECTRA. (No 38):January 1979.
24. Vanner, M. J., ‘Foundations and the effect of the change in ground conditions over the seasons’, 2nd Int. Conf. Progress in Cables and Overhead Lines for 220 k V and Above
25. Whitehead, E. R., ‘Lightning protection of trans-mission lines’, Chap. 22, Lightning (ed. R. H. Golde), Academic Press, London
26. Clayton, J.H. and Young, F.S., ‘Estimating lightning performance of transmission lines’, IEEE Trans Pas-83 (Paper No. 64-138)
27. EPRI, Transmission Line Reference Book 345kV and Above, 2nd edition, 1982.
28. Gilman, D.W. and Whitehead, E.R., ‘The mechanism of lightning flashover on HV and EHV transmission lines’ ELECTRA, No. 27
29. March Whitehead, E.R. ‘CIGRE, survey of the lightning performance of EHV transmission lines’. Electra. (No 33):1974.
30. Statutory instruments, 1970 No 1355-Electricity. In The Electricity (Overhead Lines) Regulations. London: HMSO; 1970.
31. s’Electricity-the electricity supply regulations’. In Statutory Instruments No 1057. HMSO; 1988.
32. Manuzio, G., Paris, L., ‘Statistical determination of wind loading effects on overhead line conductors’. CIGRE Paper 231, 1964.
33. Armitt, J., Cojan, M., Manuzio, C., Nicolini, P. ‘Calculation of wind loadings in components of overhead lines’. Proc IEE.. 122(11), 1975.
34. IEC, Technical Report 826:1991, second edition, replaces the first edition which was published in four separate parts between 1985 and 1987
35. CIGRE WG22-06 ‘Loading and strength of overhead transmission lines (A commentary on IEC documents in the 826 series first edition). Electra. 1990;129;March. 1990:65–97. full as erratum to this paper. ELEECTRA, 137:130-169.
CIGRE, 3-5 Rue de Metz, 75010, Pans, France (August 1991)
36. Orawski, G., ‘Calculation of overhead lines tower loadings-wind loading only’. Convener CIGRE WG22-06, 1990.Electra. 1990;129:35. March.
37. ‘Calculations of wind and ice loadings-An example of the application of IEC Reports 826-2 and 826-4’. CIGRE WG22-06, ELECTRA. 1990;132(October):127–147.
38. Bradbury, J., Kuska, G.F., Tarr, D.J. ‘Sag and tension calculations m mountainous terrain’. IEE Conf Progress in Cables and Overhead Lines for 220 kV and Above. (September):1979.
39. (document established by Working Group 36-01 (Interferences)) IGRE, Interferences Produced by Corona Effect of Electric Systems-Description of Phenomena, Practical Guide for Calculation, 1974.
40. IEE London Wood, A.B., Fair, I.R., Liptrott, F.J. ‘Transmission line design the ultimate load concept applied to Java 500 kV transmission lines’. Power Engineering Journal. (March):1988.
41. IEE London Orawski, G. ‘Overhead lines-loading and strength the probabilistic approach viewed internationally’. Power Engineering Journal. (September):1991.
42. Looms, J.S.T. ‘Insulators for high voltages’. Paris: Peter Peregnnus Ltd on behalf of the Institution of Electrical Engineers; 1988.