
Kinds of errors you’ll encounter
Logging debug statements
Using the debugger
All but the most trivial programs are without errors. Dealing with errors will be a big part of your life as a developer. This chapter will discuss the kinds of errors you’ve faced and will still face in the foreseeable future. We will also discuss how you can use Android Studio to ease the difficulty of dealing with these errors.
Types of Errors
Syntax errors
Runtime errors
Logic errors
Syntax Errors
Syntax errors are exactly what you think they are, errors in the syntax. It happens because you wrote something in the code that’s not allowed in the set of rules of the Java compiler. The compiler doesn’t understand it. The error can be as simple as forgetting to close a parenthesis or a missing pair of a curly brace. It can also be complex like passing the wrong type of argument to a function or a parameterized class when using generics.

Main editor showing error indicators
It means something is syntactically wrong with the code. Android Studio puts the red squiggly lines very near the offending code. If you hover your mouse on the red squiggly line, most of the time, Android Studio can tell you, with a high degree of accuracy, what’s wrong with the code. What’s more, you can quickly fix these kinds of errors using a technique that’s aptly named “quick fix.”
To do a quick fix, bring the cursor anywhere within the red squiggly lines, then press Alt + Enter (if you’re on Windows or Linux) or Option + Enter (if you’re on macOS), and the IDE takes care of the rest; if there’s more than one way to fix the error, the IDE will show you some options.
Runtime Errors
Runtime error happens when your code hits a situation it doesn’t expect. As the name implies, this error happens only when your program is running. It’s not something you’ll see during compilation.

IDE reminder that you need to handle the Exception
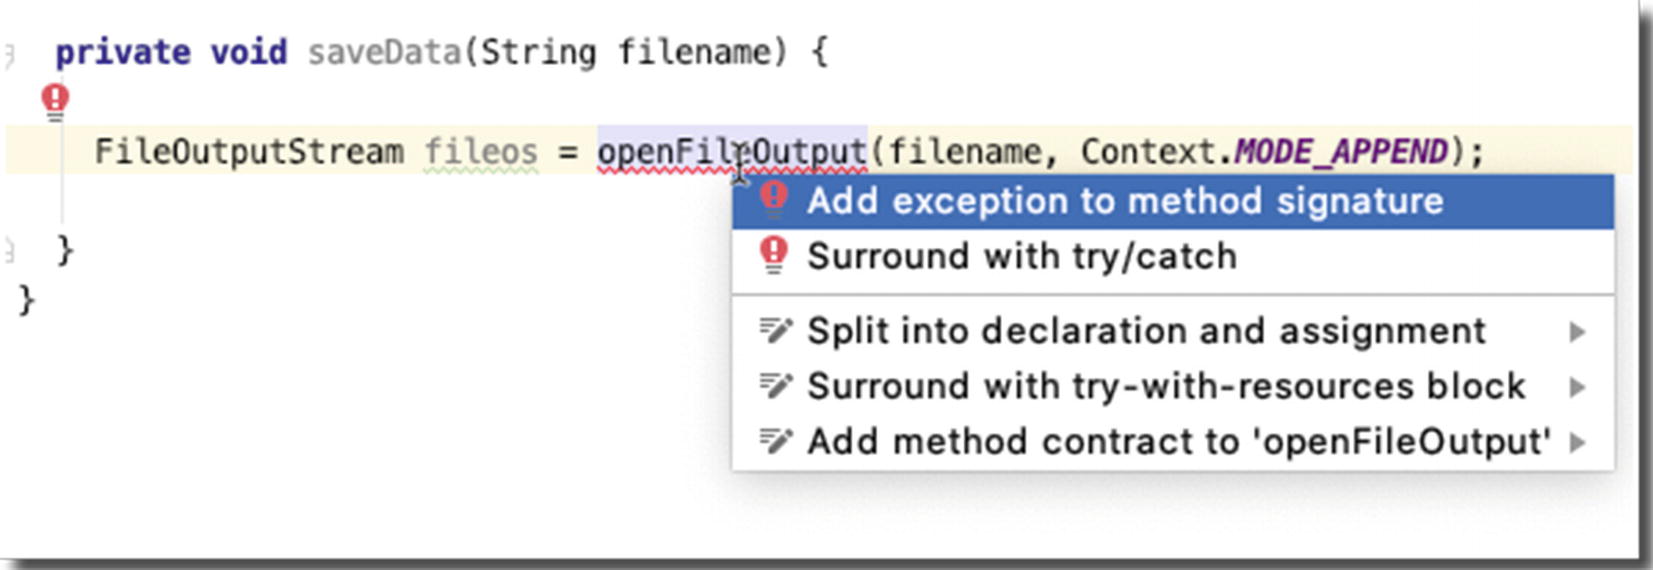
Quick fix
FileNotFoundException thrown in saveData()
Handling an Exception using try-catch
I would use a try-catch when I want to handle the Exception locally, meaning in the same block of code where the Exception might be thrown. Most of the time, the only things to do are to (1) log the error and (2) try to recover from the error, if at all possible, and let the user try again.
Using a throws clause on the other hand means you don’t want to handle the error on the local block; you’d like the calling method to take care of the error instead. If the calling method also uses a throws clause in its signature, then the error handling is passed along up the call stack.
Logic Errors
Logic errors are the hardest to find. As its name suggests, it’s an error on your logic. When your code is not doing what you thought it should be doing, that’s logic error. There are many ways to cope with it, but in this section, we’ll take a look at two—printing debugging statements in certain places of your code and walking through your code using the debugger.
As you inspect your codes, you will recognize certain areas where you’re pretty sure about what’s going on, and then there are areas where you are not so sure—you can place debugging statements in these areas. It’s like leaving breadcrumbs for you to follow. There are a couple of ways to print debugging statements. You can either use println, Log, or the Logger class.
When you set Logcat’s mode to verbose, info, or debug, you will see all the messages that Android’s runtime generates. If you want to be able to filter our messages, for example, warn or error, you need to use either the Log or the Logger class.
Typical use of the Log class

Logcat tool window
Debugger
Android Studio includes an interactive debugger which allows you to walk and step through the code while it’s running. With the interactive debugger, you can inspect snapshots of the application—values of variables, running threads, and so on—at specific locations in the code and at specific points in time. These specific locations in the code are called breakpoints ; you get to choose these breakpoints.

Debugger window
After the breakpoints are set, you have to run the app in debug mode. Stop the app if it is currently running, and then from the main menu bar, click Run ➤ Debug App.
Running the app in debug mode isn’t the only way to debug the app. You can also attach the debugger process in a currently running application. There are situations where this second technique is useful; for example, when the bug you are trying to solve occurs on very specific conditions, you may want to run the app for a while, and when you think you are close to the point of error, you can then attach the debugger.
Use the application as usual. When the execution comes to a line where you set a breakpoint, the line turns from pink to blue. This is how you know the code execution is at your breakpoint. At this point, the debugger window opens, the execution stops, and Android Studio gets into interactive debugging mode. While you are here, the state of the application is displayed in the Debug tool window . During this time, you can inspect values of variables and even see the threads running in the app.
You can even add variables or expression in the watch window by clicking the plus sign with the spectacles icon. There will be a text field where you can enter any valid expression. When you press Enter, Android Studio will evaluate the expression and show you the result. To remove a watch expression, select the expression and click the minus sign icon on the watch window.
Single Stepping
Resume—Resumes execution until you get to the next breakpoint. If there aren’t any more breakpoints, then the program runs like it would in normal execution.
Step into—If the next line has a method call, this will jump to the method and pause it at the first line.
Step over—Executes whatever happens on the next line and then jumps to the next line.
Step out—Executes the remainder of the current method and then pauses at the next statement after the method. It essentially gets out of the method.
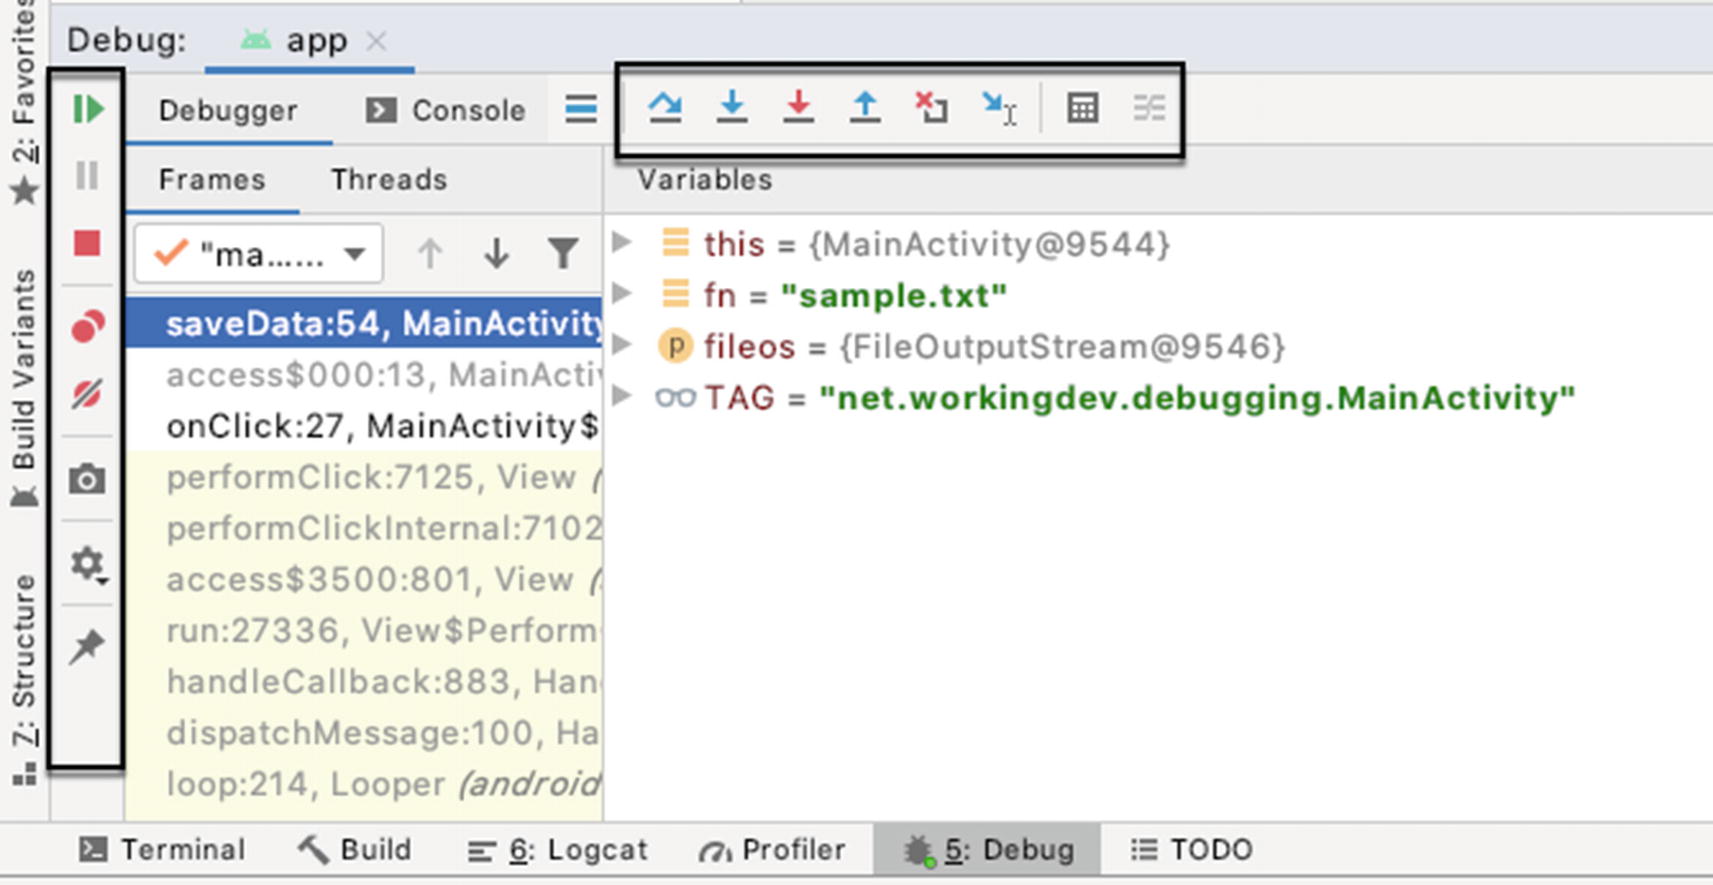
Debugger toolbar
Debugger keyboard shortcuts
Windows/Linux | macOS | |
|---|---|---|
Debug | Shift + F9 | Ctrl + D |
Resume | F9 | Command + Option + R |
Step into | F7 | F7 |
Step over | F8 | F8 |
Step out | Shift + F8 | Shift + F8 |
You can learn about more keyboard shortcuts (not just for debugging) from the Android Developers website: https://developer.android.com/studio/intro/keyboard-shortcuts.
Summary
The three kinds of errors you may encounter are compile type or syntax errors, runtime errors, and logic errors.
Syntax errors are the easiest to fix; Android Studio itself bends over backward for you so you can quickly spot syntax errors. There are various ways to fix syntax errors with AS3, but most of the time, the quick fix should do it.
You can walk through your code line by line by setting breakpoints and using the single-step actions.