Similar to Mozilla Firefox, Google Chrome also provides a built-in feature to inspect pages and elements. We can move the mouse over a desired element on the page, right-click to open the pop-up menu, and then select the Inspect element option. This will open Developer tools in the browser, which displays information similar to that of Firefox, as shown in the following screenshot:

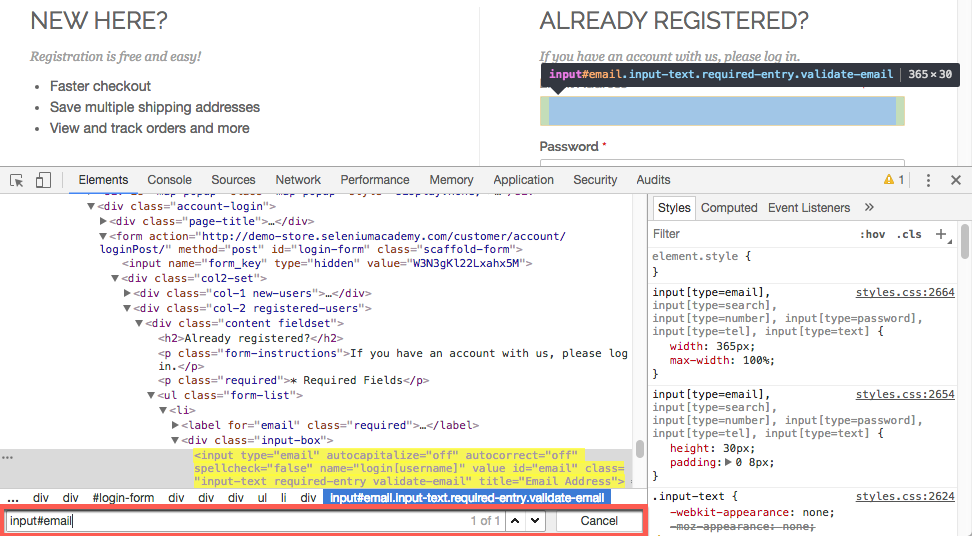
Similar to Firefox, we can also test XPath and CSS Selectors in Google Chrome Developer tools. Press Ctrl + F (on Mac, use Command + F) in the Elements tab. This will display a search box. Just enter XPath or CSS Selector, and matching elements will be highlighted in the tree, as shown in the following screenshot:

Chrome Developer Tools also provides a feature where you can get the XPath for an element by right-clicking on the desired element in the tree and selecting the Copy XPath option from the pop-up menu.
Similar to Mozilla Firefox and Google Chrome, you will find similar Developer tools in any major browser, including Microsoft Internet Explorer and Edge.
Browser developer tools come in really handy during the test-script development. These tools will help you to find the locator details for the elements with which you need to interact as part of the test. These tools parse the code for a page and display the information in a hierarchal tree.
WebElements on a web page may not have all the attributes declared. It is up to the developer of the test script to select the attribute that uniquely identifies the WebElement on the web page for the automation.
