Capacitance Measuring Circuits
The sources of the following circuits are contained in the Sources section, which begins on page 217. The figure number in the box of each circuit correlates to the source entry in the Sources section.
ACCURATE DIGITAL CAPACITANCE METER

The principle of operation is counting the pulse number derived from a constant-frequency oscillator during a fixed time interval produced by another lower frequency oscillator. This oscillator uses the capacitor being measured as the timing. The capacitance measurement is proportional during pulse counting during a fixed time interval. The astable oscillator formed by IC1C produces a pulse train of constant frequency. Gate IC1A also forms an oscillator whose oscillation period is given approximately by the equation: T =0.7 RC.
Period T is linearly dependent on the capacitance, C. This period is used as the time interval for one measurement. The differentiator network following the oscillator creates the negative spikes shaped in narrow pulses by IC1B NAND Schmitt Trigger. The differentiator formed by R1 and C1 produces a negative spike which resets the counters. The display shows the number of high-frequency oscillator pulses that enter the counter during the measurement period.
CAPACITANCE-TO-VOLTAGE METER


Timer U1 operates as a free-running oscillator at 60 Hz, providing trigger pulses to timer U2, which operates in the monostable mode. Resistor R1 is fixed and capacitor Cx is the capacitor being measured. While the output of U2 is 60 Hz, the duty cycle depends on the value of Cx. U3 is a combination low-pass filter and unity-gain follower whose dc voltage output is the time-averaged amplitude of the output pulses of U2, as shown in the timing diagram.
The diagram shows when the value of Cx is small the duty cycle is relatively low. The output pulses are narrow and produce a lower average dc voltage level at the output of U3. As the capacitance value of Cx increases, the duty cycle increases, which makes the output pulses at U2 wider and the average dc level output at U3 increases. The graph illustrates capacitance values of 0.01 to 0.1µF, plotted against the output voltage of U3. Notice the excellent linearity and direct one-to-one scale calibration of the meter. If this does not occur the 100 kΩ resistor, R1, can be replaced with a potentiometer, which can be adjusted to the proper value for the meter being used.
3½-DIGIT A/D CAPACITANCE METER
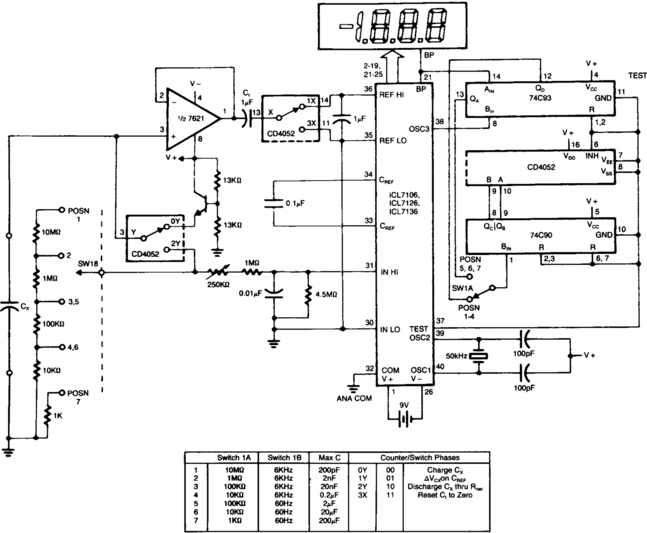
The circuit charges and discharges a capacitor at a crystal-controlled rate, and stores on a sample-and-difference amplifier the change in voltage achieved. The current that flows during the discharge cycle is averaged, and ratiometrically measured in the a/d using the voltage change as a reference. Range switching is done by changing the cycle rate and current metering resistor. The cycle rate is synchronized with the conversion rate of the a/d by using the externally divided internal oscillator and the internally divided back plane signals. For convenience in timing, the switching cycle takes 5 counter states, although only four switch configurations are used. Capacitances up to 200 μF can be measured, and the resolution on the lowest range is down to 0.1 pF.
The zero integrator time can be set initially at ⅓ to ½, the minimum auto-zero time, but if an optimum adjustment is required, look at the comparator output with a scope under worst-case overload conditions. The output of the delay timer should stay low until after the comparator has come off the rail, and is in the linear region (usually fairly noisy).
CAPACITANCE METER I
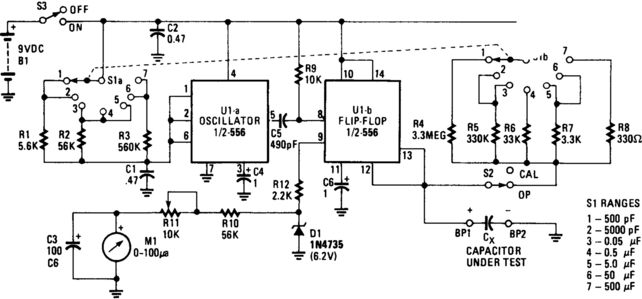
U1A is an oscillator and U1B is the measurement part of the circuit. It converts unknown capacity into a pulse-width modulated signal the same way an automotive dwell meter works. The meter is linear, so the fraction or percentage of time that the output is high is directly proportional to the unknown capacitance (CX in the schematic). Meter Ml reads the average voltage of those pulses because its mechanical frequency response is low compared to the oscillator frequency of U1A.
CAPACITANCE METER II

Output voltage is proportional to the capacitance connected to pin 2 of the charge pump. The meter works over a range of 0.01 to 0.1 μF with Raset at 111 kΩ. Over this range of capacitance, the output voltage varies from 1 to 10 V with a 15-V power supply. A constant frequency reference is taken from the 60-Hz line.