
Omitting a discussion of microformats like geo and hRecipe as not being particularly useful for mining the social web would be a big mistake. Although it’s certainly true that standalone geo data in no particular context isn’t necessarily social, important but much less than obvious relationships often emerge from disparate data sets that are tied together with a common geographic context. Geo data is ubiquitous and plays a powerful part in too many social mashups to even name, because a particular point in space can be used as the glue to cluster people together. The divide between “real life” and life on the Web continues to close, and just about any kind of data becomes social the moment that it is tied to a particular individual in the real world. For example, there’s an awful lot that you might be able to tell about a person based on where she lives, what kinds of food she prefers to cook at home, and even the specifics about ingredients in those recipes. This section works through some examples of finding, parsing, and visualizing geo and hRecipe data, since it’ll likely be sooner rather than later that you’ll think of something useful to do with it.
One of the simplest and most widely used microformats that embeds geolocation information into web pages is appropriately called geo. The specification is inspired by a property with the same name from vCard, which provides a means of specifying a location. There are two possible means of embedding a microformat with geo. The HTML snippet in Example 2-5 illustrates the two techniques for describing Franklin, the best small town in Tennessee.
Example 2-5. Sample geo markup
<!-- The multiple class approach -->
<span style="display: none" class="geo">
    <span class="latitude">36.166</span>
    <span class="longitude">-86.784</span>
</span>

<!-- When used as one class, the separator must be a semicolon -->
<span style="display: none" class="geo">36.166; -86.784</span>
As you can see, this microformat simply wraps latitude and
longitude values in tags with corresponding class names, and packages
them both inside a tag with a class of geo. A slew of popular sites—including
Wikipedia, Yahoo! Local, and MapQuest Local, among many others—use geo
and other microformats to expose structured data in their pages.
Note
A common practice when using geo is to hide the information
that’s encoded from the user. There are two ways that you might do
this with traditional CSS: style="display:
none" and style="visibility:
hidden". The former removes the
element’s placement on the page entirely so that the layout behaves
as though it is not there at all. The latter hides the content but
reserves the space it takes up on the page.
Example 2-6 illustrates a simple program that parses geo microformat data from a MapQuest Local page to show how you could extract coordinates from content implementing the geo microformat.
Example 2-6. Extracting geo data from MapQuest Local (microformats__mapquest_geo.py)
# -*- coding: utf-8 -*-

import sys
import urllib2
from BeautifulSoup import BeautifulSoup
import HTMLParser

# Pass in a URL such as http://local.mapquest.com/franklin-tn

url = sys.argv[1]

try:
    page = urllib2.urlopen(url)
except urllib2.URLError, e:
    print 'Failed to fetch ' + url
    raise e
    exit()

try:
    soup = BeautifulSoup(page)
except HTMLParser.HTMLParseError:
    print 'Failed to parse ' + url
    exit()

geoTag = soup.find(True, 'geo')

if geoTag and len(geoTag) > 1:
    lat = geoTag.find(True, 'latitude').string
    lon = geoTag.find(True, 'longitude').string
    print 'Location is at', lat, lon
elif geoTag and len(geoTag) == 1:
    (lat, lon) = geoTag.string.split(';')
    (lat, lon) = (lat.strip(), lon.strip())
    print 'Location is at', lat, lon
else:
    print 'No location found'
The implications of using microformats are subtle yet somewhat profound: while a human might be reading an article about a place like Franklin, TN and just intuitively know that a dot on a map on the page denotes the town’s location, a robot would not be able to come to the same conclusion very easily without specialized logic that targets various pattern-matching possibilities. Such page scraping is a messy proposition, and typically just when you think you have all of the possibilities figured out, you find that you’ve missed one. Embedding proper semantics into the page that effectively tag unstructured data in a way that even our pal Robby the Robot could understand removes ambiguity and lowers the bar for crawlers and developers such as yourself. It’s a win-win situation for the producer and the consumer, and hopefully the net effect is increased innovation for everyone.
The moment you find a web page with interesting geo data embedded, the first thing you’ll want to do is visualize it. For example, consider the “List of National Parks of the United States” Wikipedia article. It displays a nice tabular view of the national parks and marks them up with geo formatting, but wouldn’t it be nice to quickly load the data into an interactive tool for visual inspection? Well, microform.at is a terrific little web service that extracts several types of microformats from a given URL and passes them back in a variety of useful formats. It exposes a variety of options for detecting and interacting with microformat data in web pages, as shown in Figure 2-2.
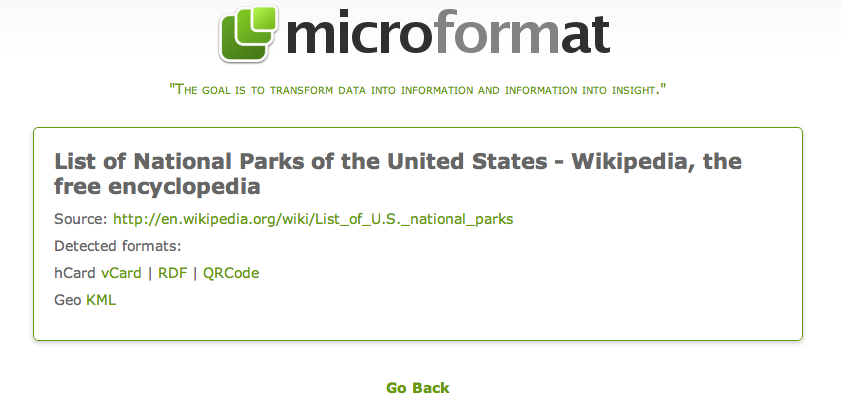
Figure 2-2. http://microform.at’s results for the Wikipedia article entitled “List of National Parks of the United States”
If given the option, KML (Keyhole Markup Language) output is perhaps the easiest way to visualize geo data. You can either download Google Earth and load the KML file locally, or type a URL containing KML data directly into the Google Maps search bar to bring it up without any additional effort required. In the results displayed for microform.at, clicking on the “KML” link triggers a file download that you can use in Google Earth, but you can copy it to the clipboard via a right-click and pass that to Google Maps.
Figure 2-3 displays the Google Maps
visualization for http://microform.at/?type=geo&url=http%3A%2F%2Fen.wikipedia.org%2Fwiki%2FList_of_U.S._national_parks—the
KML results for the aforementioned Wikipedia article, which is just
the base URL http://microform.at with
type and url query string
parameters.
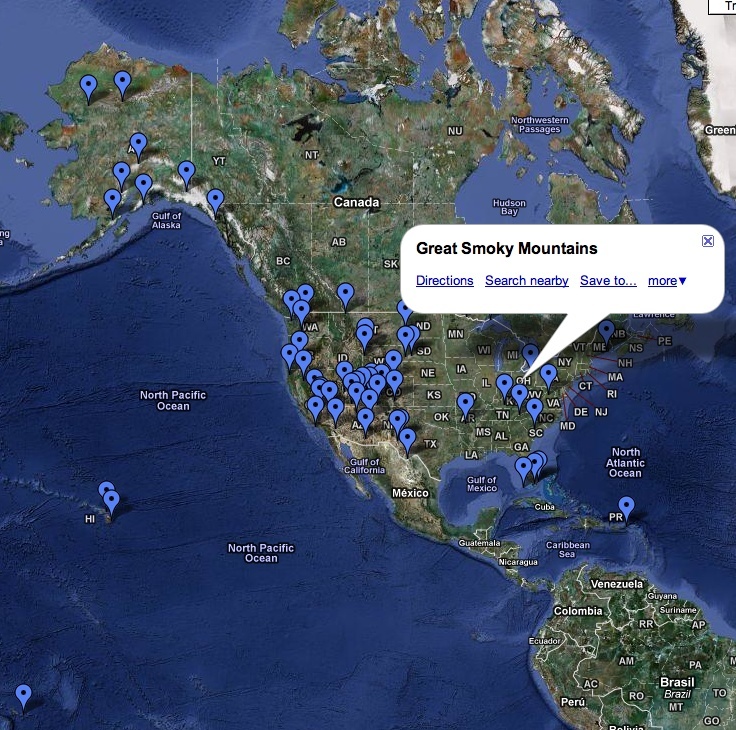
Figure 2-3. Google Maps results that display all of the national parks in the United States when passed KML results from microform.at
The ability to start with a Wikipedia article containing semantic markup such as geo data and trivially visualize it is a powerful analytical capability because it delivers insight quickly for so little effort. Browser extensions such as the Firefox Operator add-on aim to minimize the effort even further. Only so much can be said in one chapter, but a neat way to spend an hour or so would be to mash up the national park data from this section with contact information from your LinkedIn professional network to discover how you might be able to have a little bit more fun on your next (possibly contrived) business trip. (See Geographically Clustering Your Network for an example of how to harvest and analyze geo data by applying the k-means technique for finding clusters and computing centroids for those clusters.)