
Thermodynamics, performance analysis and computational modelling of small and micro combined heat and power (CHP) systems
Abstract:
Combined heat and power (CHP) production compared with single generation of power has two advantages: it helps to improve the utilisation of energy production and to reduce pollution. Cost-efficient operation of a CHP system can be planned using an optimisation model based on the thermodynamic principles involved in the behaviour of the system’s working fluid and operating conditions of the system’s components. However, the calculations are complex, lengthy and prone to errors. Hence a computerised model was written with the aim of helping the designer to examine the influence of the various parameters involved on the overall efficiency/utilisation of the plant under different conditions. The model in this chapter examines the effect of the varying demand on heat and power and calculates the performance parameters and the overall utilisation factor of the plant at any power/heat ratio. Finally, a case study is presented to demonstrate the system performance of a CHP system driven by biogas internal combustion engine.
3.1 Introduction
Fuels (such as coal, oil, natural gas, biomass and biogas) are burnt to release energy which is then harnessed to serve some useful purpose. The most basic form of the released energy is heat (as in a domestic boiler) and this can then be distributed via a heat-exchanger and a circulating fluid to be used for water and space heating. Good domestic boilers have good thermal efficiency in the range of 60-80% or even higher, so some heat is lost depending on the design, maintenance of the burner and on the type of fuel.
In power plants, heat is used to drive steam turbines which are in turn coupled to an alternator thus producing electricity. In this mode, typically the system is only 30-40% efficient, hence two-thirds of the energy in the fuel is wasted. Most power stations are designed and built for the sole purpose of producing electricity, and all heat is dumped to the atmosphere.
If these two requirements are well planned and the choice of system or location is carefully selected, it is possible to make use of the reject heat from the power utility, and hence improve the returns from the fuel, hence increase the efficiency of the system. This method of producing/using two outputs is known as cogeneration or combined heat and power (CHP). In CHP systems, the waste heat is used to provide process heat or space heating/cooling for industrial facilities, district energy systems, and commercial buildings. By recycling this waste heat, cogeneration systems achieve typical effective electric efficiencies of 50-80% - a dramatic improvement over the average 33% efficiency of conventional fossil-fuelled power plants. The higher efficiencies of cogeneration improve productivity by reducing fuel costs and reduce greenhouse emissions.
3.2 Types of combined heat and power (CHP) systems
A cogeneration unit consists of the following three basic components:
• a primary mover in which fuel is converted into mechanical and/or thermal energy
• a generator to transform the mechanical energy into electricity
Gas engines are normally used in situations where the heat is used for spatial heating. When higher temperature heat is needed, e.g. for process heating, gas turbines tend to be more appropriate. Traditionally, gas engines have been used for small-scale applications (200 kWe-5 MWe), while gas turbines and steam turbines have been used for large-scale applications (> 5 MWe). In recent years, however, the micro turbine (30 kWe-0.5 MWe) has come onto the market and entered use for many small-scale applications.
Prime movers for CHP systems can be any of the following options:
In conventional thermal power plants, only about one-third of the energy in the coal or oil appears as electrical power - two-thirds of the energy is thrown away in the form of lukewarm water, in cooling towers, to rivers or to the sea. Alteration of the design and operation of an electrical power plant to cogenerate useful heat and work improves energy utilisation. The heat must be provided at the correct temperature for space and hot water requirements of domestic, commercial and public buildings, or alternatively steam may be provided to meet industry’s needs for processes.
The design of CHP systems will depend on the individual application. In order for CHP systems to be economically viable, it is essential to exploit every possibility of minimising cost by a fully logical approach both in the area of generation and in the transport and distribution of heat. Among other considerations are the following parameters:
• period of use of the existing generating plant
• electrical and thermal load capacities of the appropriate plant
• load variations, daily, diurnal, diversity of household, industrial, commercial loads
• flow temperatures in the supply network related to pipe diameter required
• methods used for metering, operation of tariffs, collection of charges.
There are three general areas of cogeneration:
The reject heat from a conventional power plant is at too low a temperature for district heating purposes, but with some design changes, it can be raised with some loss in the production of electricity. From the point of view of electricity production the result is a loss of efficiency but, when combined electricity and useful heat production is considered, there is a considerable increase in the overall effectiveness over the same quantities of electricity and heat produced from the separate sources. As a general guide the overall efficiency of a domestic cogeneration (CHP/DH) system can be of the order of one and a half times greater than the efficiency from separate sources. Such an increase results in large projected fuel savings. For any CHP/DH scheme to be viable, the savings in fuel costs must be sufficient to provide for the extra capital costs of the scheme together with any inducements necessary to persuade potential customers to switch from their existing methods of heating.
Industrial cogeneration (CHP) has been widely applied in industry for the production of electricity and process heat, especially in areas that have a high demand for process heat. In certain cases it may be necessary to utilise a boost fired burner to ensure the correct thermal quality of process heat as required by the consumer. If a large company has suitable electrical and process heat requirements, then it may be more economical to operate and maintain their own CHP system.
3.3 Thermodynamics of cogeneration
When designing CHP installations there are a number of design issues, design variables and operating factors to consider to achieve optimum plant performance. In order to analyse CHP systems, it is necessary to review the thermodynamics of the basic stand-alone power processes and the heat producing system and then to consider the CHP alternative. In this chapter typical analysis is based on the steam plant cycle as it shares the working fluid with the process heat. The following subsections present three scenarios in which such plants can operate.
3.3.1 Scenario one: power only
Consider the basic power plant. The sole purpose is to convert a proportion of the input energy transferred to the working fluid into useful work. The remaining portion of the heat is rejected to rivers, lakes, oceans, or the atmosphere as waste heat. Wasting a large amount of heat is a price we have to pay to produce work, because electrical or mechanical work is the only form of energy on which many engineering devices can operate. Power only cycles have typical efficiencies in the region of 35%.
Figure 3.1 shows a schematic diagram of the simple power-only plant operating on the basic Rankine cycle with superheated steam. The figure also displays the temperature-entropy property diagram of the cycle. It can be seen that this simple cycle is made up of four components/processes. The focus in this cycle is on the turbine unit, process 3-4, which represents the power output developed. Hence, optimising this process is vital to getting the best out of the system.
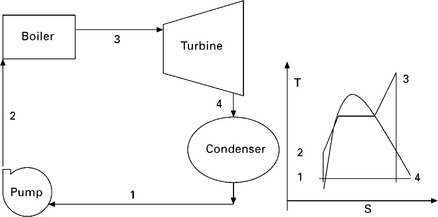
The net power output from this system is given in terms of steam mass flow rate and enthalpies as:
Where Wnet is the net work output from the system, ms is the mass flow rate system, hx is the enthalpy of steam at stake point xT (x represents any number corresponding to the cycle Fig. 3.3).
3.3.2 Scenario two: heat only
Many systems or devices, however, require energy input in the form of heat, called process heat. Some industries that heavily rely on process heat are chemical, pulp and paper, oil production and refining, steel making, food processing, and textile industries. Process heat in these industries is usually supplied by steam at 5-7 bar and 150-200 °C. Energy is usually transferred to the steam by burning coal, oil or natural gas in a furnace.
The process heat output from this system is given in terms of steam mass flow rate and enthalpies as (see Fig. 3.2):
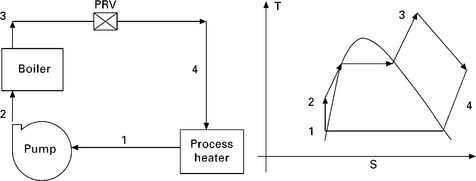
The generation of high quality steam for process heating only is generally efficient, however, as in any practical situation, it suffers from losses due to:
• inefficient heat transfer surfaces
• irrecoverable thermal energy of the steam at exit from process heater.
In spite of the above losses, a typical heat-only scheme has efficiency in excess of 80%.
3.3.3 Scenario three: combined heat and power
In practice, industries that use large amounts of process heat also consume a large amount of electric power. Therefore, it makes economical as well as engineering sense to use the already existing work potential to produce power while utilising thermal energy for process heat, instead of letting it go to waste. Such a plant is called a cogeneration plant. In general, cogeneration is the production of more than one useful form of energy (such as process heat and electric power) from the same energy source.
A schematic of a typical steam-turbine cogeneration plant is shown in Fig. 3.3. Under normal operation, some steam is extracted from the turbine at some predetermined intermediate pressure (point 5). The rest of the steam expands to the condenser pressure (point 6) and is then cooled at constant pressure. The heat rejected from the condenser represents the waste heat for the cycle.
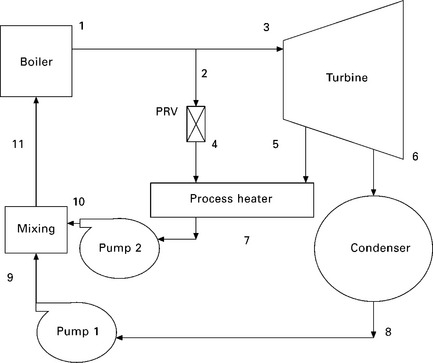
At times of high demand for process heat, all the steam is routed to the process heating units and none to the condenser. The waste heat is zero in this mode. If this is not sufficient, some steam leaving the boiler is throttled by an expansion or pressure-reducing valve (PRV) to the extraction pressure (point 5) and is directed to the process heating unit. Maximum process heating is realised when all the steam leaving the boiler passes through the PRV. No power is produced in this mode. When there is no demand for process heat, all the steam passes through the turbine and the condenser, and the cogeneration plant operates as an ordinary steam power plant.
3.4 Performance analysis of cogeneration cycles
The following parameters are considered in evaluating the performance of a CHP. Referring to the CHP cycle in Fig. 3.3, the net power output from this system is given in terms of steam mass flow rate and enthalpies as:
The process heat output from this system is given in terms of steam mass flow rate and enthalpies as:
The work ratio gives an indication of the proportion of useful power to that produced in the turbine.
The utilisation factor in cogeneration is used in place of the thermal efficiency, to describe the ratio of useful energy output divided by the energy input:
The specific steam consumption (SSC) indicates the relative size of plant, i.e. mass flow per unit power output. This determines the compactness of the system so it is desirable to have this as low as possible, as less steam used to generate power implies less energy is wasted in pumping, heating, etc.
3.5 Theory of heat exchangers
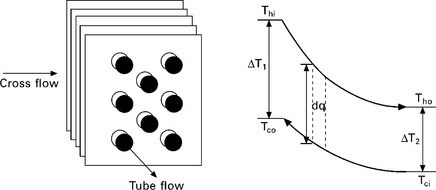
A heat exchanger is a device used for transferring heat from a hot fluid to a cold fluid. There are three different types of heat exchangers, depending on the geometry and the way in which the two fluids interact:
• shell-and-tube heat exchangers
• cross-flow heat exchangers (see Fig. 3.4).
Heat exchange between a hot fluid and a cold fluid across the metal boundary of a heat exchanger is represented by equations:
where Q is the total heat transfer rate, A is the total internal contact area, and Um is the mean overall coefficient of heat transfer.
There are three methods for evaluation/sizing heat exchangers.
3.5.1 The logarithmic mean temperature difference (LMTD)
The LMTD is defined by the four temperatures involved as follows:
3.5.2 The modified LMTD
This is applicable to other types of heat exchangers, with factors taken from correction charts to allow for deviation from the double pipe LMTD values. In most practical designs the two fluids will not flow in pure co-current, counter-flow or cross-flow fashion but will be some combination of all three. In the common ‘shell and tube’ heat exchanger, the temperature profile is further complicated by the fact that the shell side flow is not in one direction due to the presence of baffles. Baffles are installed to increase shell side fluid velocities and mixing and hence improve the shell side heat transfer coefficient. Clearly the simple logarithmic mean temperature difference equation cannot be directly applied in these cases and a correction factor (F) has to be applied to ∆Tm (LMTD) for a simple double pipe heat exchanger.
The analysis of multipass and cross-flow geometries is usually presented graphically utilising two system characteristic temperature ratios.
where T and t denote the shell-side and tube-side temperatures, respectively, and i and o denote inlet and outlet respectively.
The rate of heat transfer (Q) is given by
Correction factor charts for common geometric are available in standard textbooks on heat transfer or heat exchangers.
3.5.3 The number of transfer units (NTU)-effectiveness method
This method for evaluating the performance of heat exchangers has the advantage that it does not require the calculation of the logarithmic mean temperature difference. Its main use is to calculate achievable outlet temperatures by an existing heat exchanger of known area and construction upon a change in operating requirement or duty. The method depends on the evaluation of three dimensionless parameters: the effectiveness, the NTU and the capacity ratio, these are defined in the following paragraphs.
Effectiveness (ԑ)
This is defined as the ratio of actual heat exchange to the maximum possible heat transfer
The Capacity ratio
It can be shown that for any heat exchanger, the effectiveness is:
ԑ = Function of (NTU, capacity ratio, system geometry)
The analytical solutions to the above for various geometries are represented graphicall by [R = Cpmin/Cpmax].
It is possible to use this method in three different ways: with any two unknowns, the third can be predicted:
• knowing the effectiveness and the NTU to predict the capacity ratio
• knowing the effectiveness and the capacity ratio to predict the NTU
• knowing the NTU and the capacity ratio to predict effectiveness.
The NTU, capacity ratio (R), and the effectiveness are inter-related. They are often presented in the form of a chart for a specfic heat exchanger; so knowing any two quantities will help find the third quantity from the chart.
Then, by calculating the Cmin/Cmax and the NTU, the effectiveness can be read from these charts. Once the effectiveness has been found, the heat load is calculated by:
3.6 Worked example
In a CHP plant (see Fig. 3.3), steam enters the turbine at 7 MPa and 500 °C. Some steam is extracted from the turbine at 500 kPa for process heating. The remaining steam continues to expand to 10 kPa. Steam is then condensed at constant pressure and pumped to the boiler pressure of 7 MPa. At times of high demand for process heat, some steam leaving the boiler is throttled to 500 kPa and is routed to the process heater. The extraction fractions are adjusted so that steam leaves the process heater as a saturated liquid at 500 kPa. It is subsequently pumped to 7 MPa. The mass flow rate of steam through the boiler is 10 kg/s. Disregarding any pressure drops and heat losses in the piping, and assuming the turbine and the pump to be 100% isentropic, determine:
(a) the rate at which process heat can be supplied when the turbine is bypassed,
(b) the power produced when the process heater is bypassed, and
(c) the rate of process heat supply and power output, when the PRV is closed, 50 percent of the steam is extracted from the turbine at 500 kPa for process heating and the remaining 50% expands through to the condenser.
Solution
In this worked example, there are three scenarios of power and/or heat to be investigated. In order to evaluate each, it is important to determine the behaviour of the working fluid (water/steam) during the processes involved. The behaviour of water/steam undergoing various processes is best examined by following a property chart, and the best chart to use in such situations is the temperature-entropy chart for steam, as shown in Fig. 3.5.
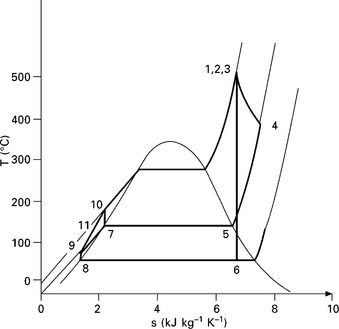
The CHP cycle is marked by locating the known points and condition at key points in the plant under a given working condition. Conditions such as operating pressure and temperature will help locate the various joints. The T-s chart, once completed, will allow the user to find the enthalpy (heat content) at each point, according to the analysis carried out in Section 3.4.
Steam tables can also be used to find more accurate values, but using steam tables is time consuming compared with locating points on the T-s charts, and using charts is standard practice for designers and engineers. However, there is an even better method, using look-up tables or fitting equations to the behaviour of water/steam. Using computer-aided macros, it is nowadays possible to carry out such complex calculations, but for the sake of explaining how the performance of a CHP is evaluated, this worked example is completed by manual calculations base on properties found from the steam chart and tables. First of all, determine the enthalpy values at key points in the cycle:
(a) Heat only
The maximum rate of process heat is achieved when all the steam leaving the boiler is throttled and sent to the process heater and none is sent to the turbine:
3.7 Computational modelling of a combined heat and power (CHP) cycle
It is clear that analysing a combined heat and power cycle is a lengthy process. Especially when optimum performance is to be achieved, the search for optimum operating conditions is determined by very many parameters. In order to assess how variable conditions affect a typical cycle, computational software is essential. To allow amendments to be made to cycle conditions, and to assess results in detail, an Excel program was created. The software approach has the added advantage of eliminating errors and improving the accuracy of calculations. In this chapter it was decided to investigate the influence of varying some key conditions in the cycle and examine their effect on the performance of the CHP plant. The variable conditions included the boiler pressure superheated temperature, heat extraction pressure, turbine and pump isentropic efficiency, and percentage of heat extracted. To enable this to be evaluated in detail, it is important that only one variable is changed at a time, with all other conditions remaining constant. The program was created in Microsoft Excel 2007.
Firstly, the steam table data were copied into Excel (Keenan et al., 1969).
Using a combination of ‘If’, ‘VLookup’ and ‘And’ functions, the steam table properties were extracted from the tables for the key points within the cycle.
The isentropic efficiency of a pump or turbine is defined as the ratio of the actual work output vs the work output if the process between inlet and outlet is isentropic. Pump efficiency can be adjusted, amending h2 and h8 data as appropriate. The following calculations were used:
Turbine efficiency can be adjusted, changing h5 and h6 data. The following calculations were used:
The enthalpy value at h'5 can be accurately calculated, even If the process heat inlet falls inside or outside of the saturation line, i.e., whether mixed phase or superheated. This process uses an ‘If’ function. If the dryness fraction of the extract process heat is mixed phase (i.e. x5 < 1), then h5 is calculated using the dryness fraction calculation below:
If the dryness fraction is above 1 (i.e. superheated), then a lookup function matches the entropy value at s4, with the data in the extract process heat steam table at the superheated condition. Some interpolation goes ahead, and the exact value for h5 can be calculated.
3.8 Analysis of the computational model of the combined heat and power (CHP) system
The software developed for the combined heat and power plant was verified against manual calculations, and the results are compared and shown in Table 3.1. The maximum error between manual and Excel program methods is only a fraction of a percent. Such small errors can be explained by inconsistent rounding of numbers in the manual calculations.
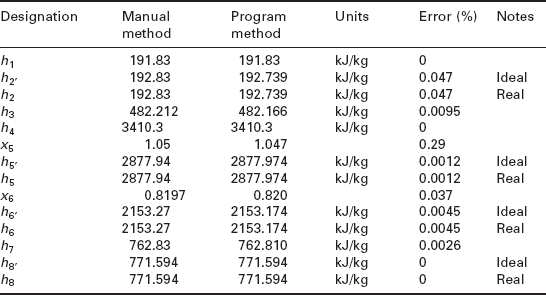
The simulation package developed here proved a very useful tool to investigate the various parameters involved in an accurate and fast way. One area for improvement is that the Excel program could use the industrial formulation for calculation of properties of water and steam (known as ‘IAPWS Industrial Formulation 1997 for the Thermodynamic Properties of Water and Steam (IAPWS-IF97)’). This would increase cycle analysis availabilities, as there are instances where the steam tables have limited data.
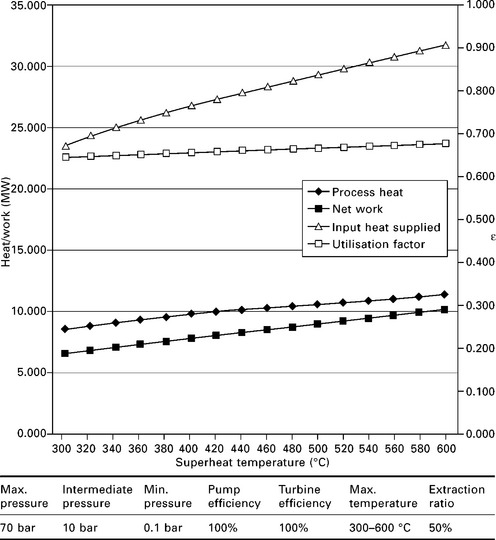
3.8.1 Variable 1: superheat temperature
It can be noticed that by increasing the superheated boiler exit temperature from 300 °C to 600 °C, the process heat available (at constant process heat pressure) increases by 32%, from 8.59 MW up to 11.35 MW. Pump work remains constant, regardless of the superheated maximum temperature. As the superheated boiler exit temperature increases from 300 °C to 600 °C, the net work increased by 53% and the utilisation factor increased by 5% (see Fig. 3.6). It is clear that, to maximise the process heat available, the boiler exit temperature should be superheated. The hotter the boiler exit gas, the more process heat will be available.
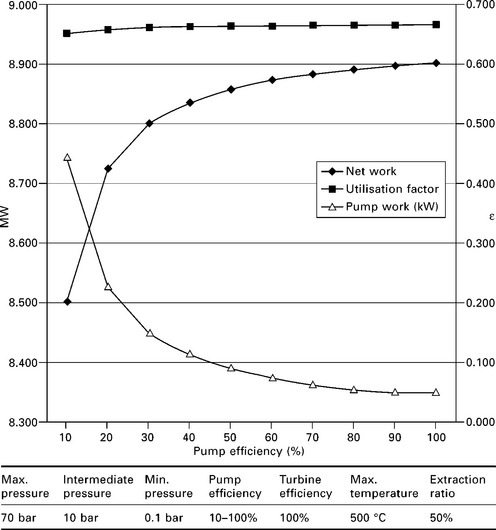
3.8.2 Variable 2: pump efficiency
Keeping all other points constant, adjusting the pump efficiency can be analysed in isolation. It is clear that the pump work increases dramatically as the pump isentropic efficiency drops. A decrease in pump efficiency of 90% to 70% implies higher pumping power and less net work output, but has little effect on the utilisation factor of the plant. However, a drop in pump efficiency below 50% will have a more serious effect (see Fig. 3.7). Service and maintenance is therefore key in ensuring the plant performance is maintained at the highest level.
3.8.3 Variable 3: turbine efficiency
Keeping all other points constant, adjusting the turbine isentropic efficiency results in some concerning results (Fig. 3.8). A drop in turbine efficiency has a large effect on the turbine work available. A drop in efficiency from 90% down to 70% results in a drop in turbine work of 28.5%. Not only that, a drop in turbine efficiency has a direct effect on process heat available and net work, resulting in a reduction of the utilisation factor. During this analysis, pump work and input heat supplied remain constant.

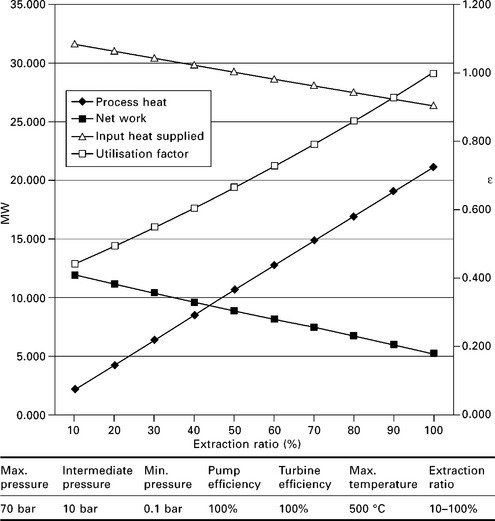
3.8.4 Variable 4: extraction ratio
Keeping all other points constant, adjusting the extraction ratio provides an interesting analysis (Fig. 3.9). As expected, dropping the extraction ratio reduces the utilisation factor. At an extraction ratio of 100% (i.e. maximum process heat), the utilisation factor is 1. Also, as the extraction ratio increases, the process heating available also increases. No great surprises here. However, the extraction ratio also has a direct impact on the turbine work. As the extraction ratio increases, more process heat becomes available. However, turbine work decreases.
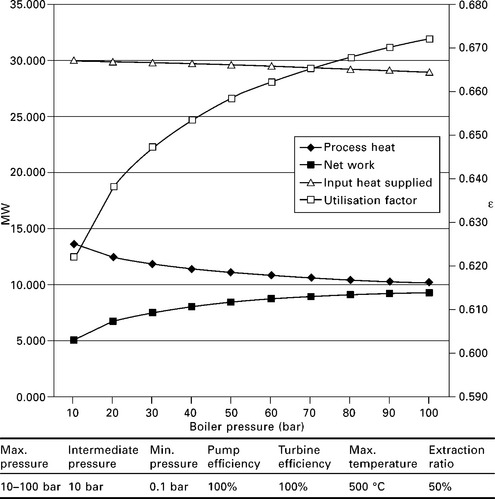
3.8.5 Variable 5: maximum pressure – boiler
Keeping all other points constant, adjusting the maximum boiler pressure reveals some important information (Fig. 3.10). Increasing the boiler pressure and keeping the superheated temperature constant reduces the process heating available. Conversely, turbine work increases. An increase from 10 to 50 bar for maximum pressure, results in an increase from 5.088 to 8.439 MW of turbine work. This is an increase of 40%. However, increasing the maximum pressure from 50 to 100 bar results in a turbine work increase from 8.439 to 9.378 MW. A rather disappointing 11% increase, based on a doubling of maximum pressure. As the maximum pressure increases, input heat supplied reduces slightly. Conversely, pump work and utilisation factor increase slightly.
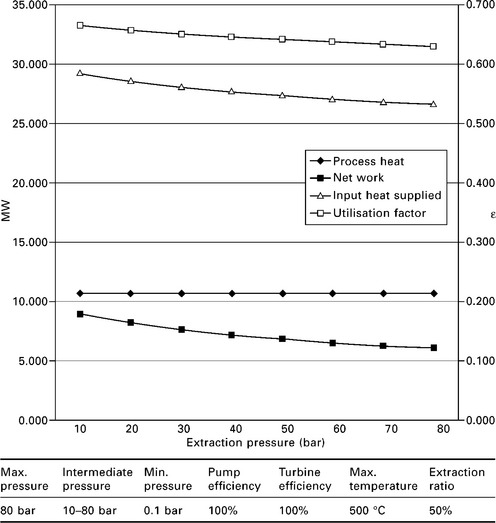
3.8.6 Variable 6: heat extraction pressure – process heat
Keeping all other points constant, adjusting the process heat extraction pressure reveals some somewhat surprising information (Fig. 3.11). Increasing the process heat extraction pressure from 10 to 80 bar results in a tiny increase in process heat available of just 1.1%, from 10.576 to 10.697 MW. However, as the process heat extraction pressure increases, turbine work decreases quite significantly, whereas the utilisation factor decreases marginally.
3.9 Case study: system performance of a biogasdriven small combined heat and power (CHP) system in a sewage works
This case study was reported as part of a Masters degree thesis submitted by Brian Rose, who worked on this project. The project was concerned with the design, supply and commissioning of a CHP plant for the treatment of sewage waste. A significant amount of digester gas is generated as a by-product and, following a feasibility study, it was decided to install a CHP plant to enable the site to become totally self-sufficient in heat and power.
Anaerobic digestion is a process in which organic matter is broken down naturally by bacterial action. As the name suggests, the process takes place in the absence of air, and in conditions of warmth and darkness. Anaerobic digestion is commonly used to convert residues from farming, food manufacture and human waste.
Sewage sludge is supplied to a heated vessel (the digester) where fermentation takes place in an oxygen-free environment. Microbial bacteria, which reside in the digester, feed on the organic matter and gases are evolved. The resulting digester gas is approximately 65% methane, 35% carbon dioxide, and has a gross calorific value in the range 20-23 MJ/m3. This level of energy content is sufficiently high to power an internal combustion engine.
3.9.1 Choice of prime mover
Following an extensive feasibility study, a lean-burn spark ignition engine was selected as the prime mover for the CHP plant. The main advantages of the lean burn engine deemed relevant to this application were:
• low emissions levels attainable with lean-burn
• heat-to-power ratio closely matched the requirements of the process
• high-grade heat suitable for the digestion process
Each engine is an 8-cylinder turbo-charged lean-burn engine, operating at a constant speed of 1000 rev/min with a compression ratio of 9:1 and a displacement of 142.5 litres. The engine is coupled to a 6-pole synchronous alternator, which generates 1.49 MWe rated electrical power at 11 kV and 50 Hz. A total of five engines are installed, giving the installation a maximum installed capacity of approximately 7.5 MWe. In practice, however, only three or four engines are operated at any given time to allow for routine engine maintenance and servicing. Each engine is fitted with a specially enlarged carburettor orifice to handle the increased gas flows through the engine. The engine is tuned for lean-burn operation, i.e. 100% excess air (equivalence ratio ϕ = 2.0).
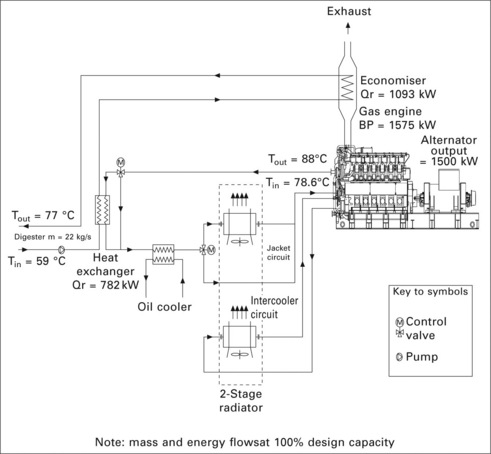
A compact plate-type heat exchanger is employed to recover rejected heat from the engine-cooling jacket (Fig. 3.12). The heat exchanger is arranged so that it receives return water from the digester process at 59 °C and raises its temperature to about 70 °C prior to further heating in the exhaust heat economiser. High-grade heat is recovered from the engine exhaust gas by means of an extended surface type heat exchanger. Exhaust gases at 360 °C are used to produce hot water at a temperature of 77 °C as required for the digester process.
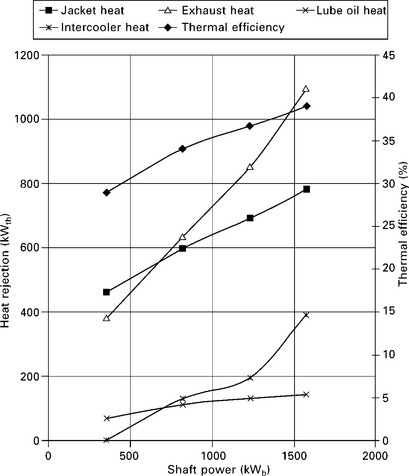
3.9.2 Engine performance
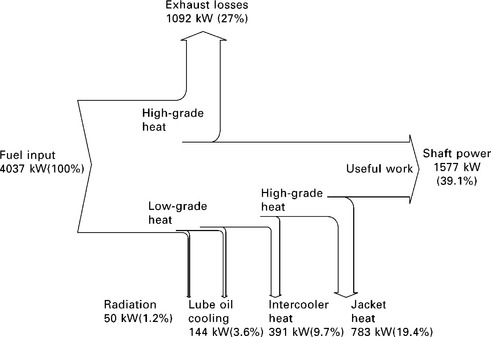
An initial appraisal of the engine thermal efficiency at full load capacity indicates a heat-to-power ratio of 1.56:1, representing a thermal efficiency of 39.1%, when calculated on the saturated lower calorific value of the fuel = 32.9 MJ/m3 (≅ 39.1 MJ/m3 dry gross saturated lower calorific value). When the engine is operating at part load, the gross thermal efficiency falls to approximately 28.9% at 22% load rating. The inter-relationships between efficiency heat rejection and thermal efficiency of the engine are illustrated in Fig. 3.13.
Approximately 1.87 MW of high-grade heat is available when the engine operates at its maximum capacity of 1.57 MW brake power. The overall energy balance for the engine operating at 100% capacity can be illustrated in the form of a Sankey diagram (Fig. 3.14).
3.9.3 Heat recovery system
The requirement for process heat is 1.7 MW at an outgoing temperature of 77 °C (± 3 °C). The temperature of the process water is raised in two stages by passing it first through the jacket water heat exchanger then finally through the exhaust heat economiser. The heat exchanger employed is a compact type plate heat exchanger, which has a multiple pass arrangement. This type of heat exchanger has a very small hydraulic radius in the fluid flow channels, which reduces the effect of the laminar fluid film at the interface between the fluid and the heat exchanger. The overall heat transfer coefficient is enhanced by the use of turbulence-inducing patterns within the fluid flow channels of the heat exchanger. As a result, very high energy transfer rates per unit area can be achieved when compared to a traditional shell and tube type heat exchanger. The compact heat exchanger (CHE) employed in this particular application operates under the conditions given in Table 3.2.
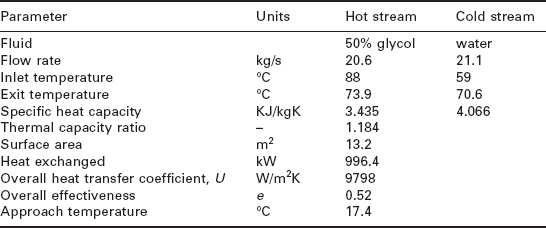
The overall heat transfer coefficient was very high (9798 W/m2K), as would be expected for this type of heat exchanger. The overall effectiveness was quite low, but this could be attributed largely to the higher thermal capacity ratio of the fluid streams. It can be shown that heat exchanger effectiveness decreases with increasing thermal capacity ratio (where thermal capacity ratio R = Cpmin/Cpmax). The approach temperature was also higher than would be expected of a CHE unit, but this was unavoidable in this particular application. Cooling of the engine coolant would result in high thermal stresses in the engine.
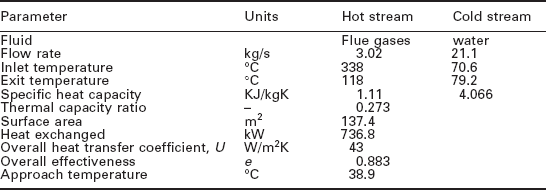
3.9.4 Exhaust Heat Recovery
The exhaust heat exchanger is an extended surface heat exchanger, which consists of a double bank of finned tubes inserted in the flue gas stream of the engine. Exhaust gases flow over the external surfaces of the finned tubes, which contain the heat transfer media. The overall heat transfer coefficient was very low (U = 43 W/m2K), mainly due to large hydraulic radius of the fluid passages in the heat exchanger. The economiser was specially designed for low flow resistance on the flue gas side of the economiser, due to a limitation on the exhaust system backpressure of 508 mm H2O. The overall effectiveness though was very high (e = 0.883), this being due to the low thermal capacity ratio between the flue gas and the water (see Table 3.3).
3.9.5 Overall system performance
With the incorporation of heat recovery equipment, the performance of the combined heat and power system becomes 82% at maximum design capacity (Fig. 3.15). Using biogas fuel to operate the system displaces emissions from combustion of fossil fuels from centralised power generation plants.
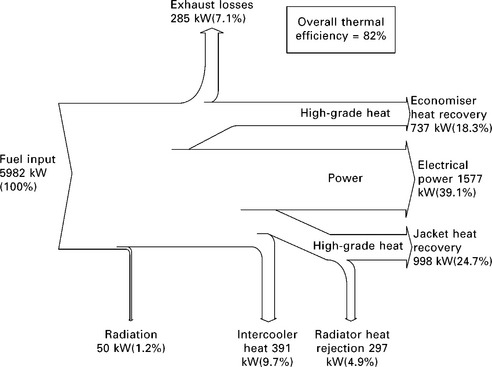
The degree of displacement is further improved by the incorporation of heat recovery to offset fuel consumption, which would otherwise be consumed in process heating. The overall displacement effect is summarised in Table 3.4, and assumes that the plant would be operational for 8760 hours per annum.
Table 3.4
Emissions reduction per generator
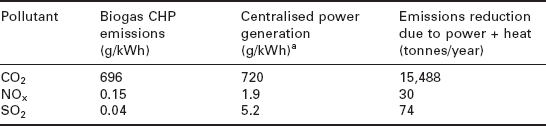
aThe data given for centralised power generation assumes a mix of 50% coal, 47% gas, and 3% oil, inclusive of 5% transmission losses. A boiler efficiency of 80% was assumed in the calculation of emissions reductions due to heat recovery.
3.9.6 Conclusions
• The use of biogas fuel in this installation demonstrates the viability of a renewable energy source. This system not only reduces dependency on fossil fuel, but also exhibits a high level of thermal efficiency through heat recovery consumption local to the point of generation.
• The installation enables the sewage treatment processing plant to be self-sufficient in its energy needs, i.e. no energy is imported from the national grid.
• The installation uses a free source of energy which would otherwise vent to atmosphere, which, if imported as premium natural gas, would cost £389,000 per generator (based on 3536 MWh imported at 1.1 p/kWh tariff).
• This type of installation offers further diversity in sources of energy, and helps reduce national dependence on finite reserves of traditional fossil fuel.
• Due to its high level of efficiency, the installation is exempt from the climate change levy taxation of 0.15 p/kWh, producing an annual saving of £2,900 per generator.
• This particular installation uses 100% renewable energy and is therefore exempt, producing an annual saving of approximately £43,700 per generator based on 10% of the potential 1.32 GWhe energy produced per annum.
In economic terms, the plant is able to exploit a free energy source, which would otherwise be vented to atmosphere from the digestion process. As a result, the sewage treatment plant is self-sufficient in energy, and is in fact able to export electrical energy to the national grid at times of low in-house demand.
3.10 Sources of further information and advice
http://www.theiet.org/publishing/books/renewable/cogeneration.cfm
http://www.cibse.org/index.cfm?go=page.view&item=385
http://www.publications.parliament.uk/pa/cm199899/cmselect/cmenvaud/159/9022306.htm
http://www.carbontrust.co.uk/emerging-technologies/current-focus-areas/pages/micro-combined-heat-power.aspx
3.11 References and further reading
Boyce, M.P. Handbook for Cogeneration and Combined Cycle Power Plants, 2nd edn, New York: ASME Publications, 2010.
Keenan, J.H., Keyes, F.G., Hill, P.G., Moore, J.G. Steam Tables. New York: John Wiley & Sons; 1969.
Kehlhofer, R., Hannemann, F., Stirnimann, F., Rukes, B. Combined-Cycle Gas and Steam Turbine Power Plants, 3rd edn, Tulsa, OK: PennWell Corp, 2009.
Horlock, J.H.Combined Power Plants: Including Combined Cycle Gas Turbine (CCGT) Plants. Malabar, FL: Krieger Publishing Company, 2001.