
Techno-economic assessment of small and micro combined heat and power (CHP) systems
Abstract:
This chapter introduces the economics of small-scale CHP systems. Beginning with a review of how decentralised energy resources can achieve economic value, it then discusses the sometimes ill-defined concept of techno-economics, and the variety of modelling techniques that underpin it. An optimisation method that pinpoints the key characteristics of commercially successful CHP is presented and applied to the case of micro-CHP in the UK, demonstrating that the heat-to-power ratio prime mover is the key driver of economic and environmental performance. Finally, the emerging tension between CHP and heat pumps is discussed in relation to future stringent emissions reduction targets.
2.1 Introduction
small-scale combined heat and power (CHP) is a class of technologies that have the potential to simultaneously tackle a number of energy policy aims surrounding the economics, environmental impacts and security of energy supply. Perhaps foremost among its credentials is the perceived ability to reduce greenhouse gas emissions arising from energy consumption at low private and social cost. As such, and given broader national and international efforts to mitigate climate change, CHP has benefitted from recent industry and political attention. In this process it has become apparent that tools to further assist development and introduction of systems could aid decision making and push this technology more into the mainstream. This chapter presents a techno-economic modelling framework designed to assist investors, CHP technology developers and policy makers in achieving conception to commissioning of ‘successful’ CHP products and installations. The modelling and supporting analysis is used to weigh up the ability of the technologies to meet commercial and policy aims, and to gauge the suitability and effectiveness of policy instruments in encouraging uptake where that uptake will aid in meeting policy objectives.
CHP is a distinctive technology. Along with energy efficiency measures, it is one of the very few ‘interventions’ to address all three primary aims of energy policy convincingly. Both energy efficiency measures and CHP can be economically rational investments in that they can pay back within their lifetimes, and can reduce greenhouse gas and pollutant emissions, and improve energy security by reducing demand and diversifying and decentralising supply. But despite these benefits, the extent to which CHP can be deemed as ‘successful’ depends greatly on site-specific characteristics and the nature of the technology applied, not to mention an assortment of ‘external’ uncontrollable factors such as relative electricity and fuel prices, the speed and nature of change in the broader energy system, and the business models by which CHP systems are introduced.
This chapter does not intend to tackle all of these issues in detail, but rather focuses on a specific facet of the economics of CHP. In order to achieve this, it is split into four main parts: a discussion of the general economic opportunities and challenges faced by decentralised energy resources, discussion of the concept of ‘techno-economic’ analyses, description of a technique to scope and assess CHP technologies, and a case study of an important subset of small-scale systems - micro-CHP for residential applications. It is hoped that this will give readers insight into the fundamentals of decentralisation, with specific focus on a method for development and assessment of CHP systems.
2.2 The economics of combined heat and power (CHP)
In any discussion of the economics of CHP, the topic of the relative price of electricity and fuel cannot be overlooked. This quantity is expressed via a metric known as the ‘spark spread’, which is a measure of the gross income a generator can expect to receive when they sell one unit of electricity after purchasing the fuel necessary to produce that electricity. For the case of CHP, the spark spread concept needs to be altered slightly to cater for the fact that CHP also produces heat, which has economic value. If we assume that the value of heat from the CHP is identical to the cost of producing heat in a boiler, it is possible to derive the following relationship between CHP spark spread, price and efficiencies:
where EP is the electricity price, GP is the gas price, and ηe, ηo and ηb are the CHP electrical efficiency, CHP overall (i.e. heat plus power) efficiency, and competing boiler efficiency, respectively. In the case where ηo ≈ ηb, this reduces to Equation 2.2:
and in the case of an extremely well-engineered system, where ηO ≈ 1, the relationship further reduces to:
Both Equations 2.2 and 2.3 are independent of the electrical efficiency of the generator, which is substantially different from the case of electricity-only generators for which the standard spark spread metric (where no value is afforded to heat) is usually calculated. Furthermore, the quantity in Equation 2.3 is sometimes referred to as the ‘ spark gap’, and is a relatively common measure of the competitiveness of CHP at any given point in time. Of course, CHP spark spread or spark gap does not include all the necessary information about the economics of CHP, and other sources and limitations of value can come from, for example, emissions trading permits, levies or levy exemptions for CHP, operational expenses, connection, distribution, the ability to utilise thermal energy, etc. Nonetheless, spark gap is a useful metric for a first approximation, and as stated above no discussion of CHP economics would be complete without it.
Before moving on, it is worth briefing touching on the risk faced by investors in CHP as a result of fluctuation in the CHP spark spread. As one would expect, it varies from year to year, as displayed in Fig. 2.1. This figure shows fairly wide variation in the CHP spark spread, primarily as a result of electricity price drops after full energy market liberalisation in 2001. The situation has since improved, but the historical volatility certainly does not lend itself to this increased investment. In essence, exposure to the CHP spark spread does represent a risk, which is a noteworthy barrier for CHP uptake.
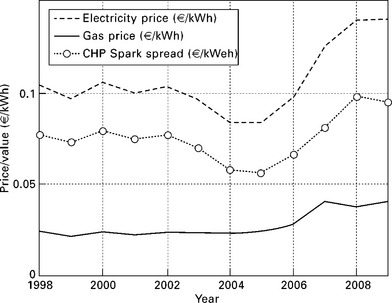
2.1 Historical electricity and gas price of the UK from European Commission (2010), plotted against calculated CHP spark spread.
In addition to the customary spark spread economics, there are a range of less tangible factors that bear upon the economics of CHP, both at each individual site and further upstream. These stem from the fact that CHP is a class of technologies that are a subset of the broader ‘decentralised’ or ‘distributed’ generation (DG) concept. Such systems are often attributed a variety of advantageous characteristics relating to their economics. Whilst 207 separate benefits can be identified according to Lovins et al. (2002), they typically fall into one of the following categories:
1. The ability to utilise waste heat. Specific to the case of CHP and integral in the preceding discussion of CHP spark spread, co-location of supply and demand allows thermal energy that would otherwise be wasted to be utilised onsite or nearby for some productive purpose.
2. Modularity and speed of installation. Unlike large centralised generators, distributed generators are modular and have short lead times for installation. Therefore, all other aspects being equal, there is less financial risk involved in investing in a large number of decentralised generators than one of their centralised counterparts.
3. Reduced requirement for upstream infrastructure. Installing generation assets near the point of demand implies that less centralised generation and transmissions and distribution (T&D) infrastructure will be required upstream, thus reducing total final cost.
4. Reduction in electricity T&D losses. Similarly to (3), siting electricity generation at or near the point of demand means that some T&D losses (which currently account for approximately 7% of all electricity generated in the UK) will be avoided because some electricity does not need to be transmitted.
5. Backup power or uninterruptable power supply (UPS). The ability to install generation onsite offers the possibility to provide backup power that improves the reliability of the total power supply (i.e. supplementing standard power system reliability). DG also offers flexibility in meeting reliability needs, where specific customers can be afforded appropriate levels of reliability depending on the value of the load being served.
6. Diversification of primary energy sources. A wide range of primary fuels are available for DG systems (e.g. wind, biomass, solar, waste-to-energy). Such diversification has evident energy security benefits, along with further ‘ portfolio’ benefits of hedging risk via the ability to switch from one primary energy source to another when operating an aggregation of DG resources.
7. Access to ‘stranded’ or ‘distributed’ primary energy sources. The small scale and relative portability of generators means they can be located where the fuel is. For example, wind power needs to be located in windy places, and some bio or waste-to-energy sources may benefit from avoiding transportation of the fuel.
The precise value of all of these benefits is challenging to estimate, as it depends on many factors relating to both the technology and site. Some studies have attempted to quantify them, but wide error bars are usually conceded, and results can rarely be generalised. In spite of the potential benefits, market rules and regulations can hinder the ability of smaller generators to access the value they create, via preventing market access on equitable terms or complicating permitting, installation and commissioning processes. In some senses such barriers may be reasonable as some DG technologies will not create value in one or more of the listed categories, and it is arguable that each installation needs to be judged on its own merits. This leads to one of the most important challenges with regard to DG: the uncertainty of performance or suitability of a particular technology in a specific setting creates the wish to assess each installation. This leads to imposition of measures such as permitting and licensing, impeding uptake and sometimes creating regulatory risk for the installer. As such, even installations that are likely to be acceptable and perform well are subject to procedures that discourage managers from investing time in even the first stages of scoping DG projects.
Clearly the array of opportunities and challenges facing CHP are substantial, and not all can be addressed here. Instead we focus on one specific aspect: the techno-economics of CHP, beginning with an exploration of definitions and the scope of applicable techniques, followed by presentation of a modelling methodology and a case study of residential micro-CHP.
2.3 Techno-economics for onsite generation
Conventional power system models are rarely appropriate for analysing onsite generation. This is because they do not adequately capture the dynamics of site energy demand, and rarely consider the economics of ‘ behind-the-meter’ generation or the range of site-specific constraints a typical installation faces. To address their shortcomings, models designed to analyse the economic and environmental performance of onsite generation technologies such as CHP are becoming more common. Whilst the aims, assumptions and structures of these models vary greatly, most can be classified as ‘techno-economic’, based on either simulation or optimisation approaches.
Before delving into the details of a specific modelling approach, it is useful to explore the term ‘techno-economics’, which is only loosely defined and yet widely applied. In its most general form, it refers to studies that cross the disciplinary boundary between the physical sciences and economics. Many techno-economic studies are typified by a technical characterisation of an engineering system and the environment in which it operates, accompanied by modelling of its technical performance given particular state/s of input parameters (e.g., factors relevant to the performance and lifetime of the system). The results of such analyses are designed to be quantities that can be attributed economic value (e.g., annual electricity and fuel consumptions, maintenance requirements, etc). The economic part of the analysis takes these values and calculates standard metrics such as net present value, equivalent annual cost, payback periods, or risk-related metrics for the investment. Whilst this all-purpose description is very straightforward, the methods by which techno-economic modelling is performed vary greatly from study to study, and each approach presents specific strengths and weaknesses. A primary distinction between modelling methodologies lies in comparison of simulation and optimisation.
Simulation models performance over time using a set of (potentially temporally interdependent) physical relationships. Conversely, optimisation models performance (potentially over time) where some variables are not fixed and can be adapted in order to maximise or minimise some defined objective, subject to constraints. Either modelling approach can be very simplistic or extremely sophisticated. Optimisation approaches can be further disaggregated into those regarding system design, and those regarding system operation. Equally, simulation approaches exist in a variety of forms and consider many different boundaries for analysis. The primary advantage of simulation is that it can be more easily used to explore transients in the technology itself and in the environment in which it operates, because highly non-linear interactions and even first-principles relationships can be readily incorporated into models. Whilst techno-economic optimisation rarely attempts to capture such detail explicitly, it has the advantage that technical and/or operational parameters do not need to be fixed. This means that it is possible to explore the characteristics of the technology, its control and/or its operational environment that lead to the ‘best’ outcome, as defined by the objective function of the optimisation.
For this chapter, a unit commitment optimisation model based on steady-state efficiency characterisation has been chosen to assess the performance of CHP. For the interested reader, a definition and review of various unit commitment methodologies can be found in Padhy (2004). Dynamic/transient performance of the CHP is emulated via a set of operational constraints, adding elements of system and building response into the formulation. This optimisation approach is intended to provide useful information regarding the best system design and control, and can be used to explore the performance potential of emerging technologies. The superior thermal demand/response modelling of credible simulation models is drawn upon to create fixed thermal demand profiles for use in the case study presented later.
2.4 A specific modelling methodology
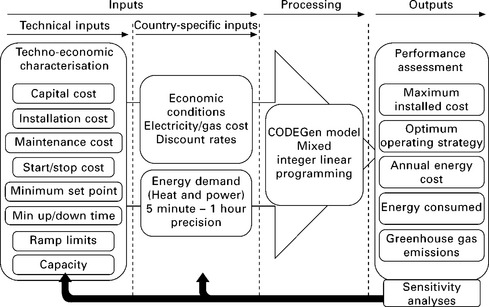
As discussed above, in order to investigate CHP economics, optimisation is applied. The inputs and outputs of this process are described in Fig. 2.2. The ‘processing’ element in Fig. 2.2 forms the core computational effort of the modelling, and is a mixed integer linear programming method implemented using Visual C++.NET and CPLEX 10. The model has been named CODEGen, which stands for ‘Cost Optimisation of Decentralised Energy Generation’. The mathematical formulation of the optimisation problem is not presented here, and the reader is referred to Hawkes et al. (2009a) for a complete description. Instead, a narrative of the basis of choice of the optimisation objective function and a conceptual outline of the mathematics are provided in the sub-sections below.
2.4.1 Choice of the central performance metric
This section explores the choice of the objective (i.e., the primary performance metric to minimise or maximise) of the optimisation through consideration of the modelling aims. The modelling framework must of course be tuned to these aims, which are:
• to understand the potential of CHP technology, and use it to assess the key market drivers, and assess the ability to meet policy aims;
• to investigate key technical parameters to understand their influence on economic and environmental credentials, with the aim of improving the knowledge of system developers;
• to use the modelling results to critique current, proposed and potential new policy and regulation surrounding the introduction of CHP.
In one sense the aims all speak to the primary considerations of energy policy: economics, environment, and energy security and the ability of CHP to contribute to beneficial outcomes in these three areas. However, in order for the technologies to be commercially successful, consumers must adopt them in large numbers, so deployment pathways become relevant. Deployment models for microgeneration are considered to gain an understanding of what metrics may drive adoption/diffusion and demarcate successful CHP products. This leads to choice of a primary performance metric for the optimisation modelling (i.e. an objective function), and further assessment metrics.
CHP commercial exploitation pathways
The driving force in a CHP investment decision depends greatly on which stakeholder is making that investment. It order to gain understanding of appropriate metrics for modelling of the systems, it is useful to consider which actors are associated with each potential route to market. Watson (2004) developed a set of deployment models for microgeneration in general, and applied it in Sauter and Watson (2007) to investigate social acceptance of microgeneration. The deployment pathways they developed are:
• Plug-and-play. Where the decision to invest in microgeneration is taken autonomously by the building owner or occupier who independently finances it.
• Company control. Where more passive consumers provide a site for the system which is owned and/or operated by an energy service company (ESCO) or energy supplier.
• Community microgrid. Where a group of individuals and/or businesses group together to provide some of their collective energy needs, and own and may operate the units.
As discussed in Hawkes et al. (2009a), the company control pathway is possibly the most effective for mass market introduction of efficiency and other measures in the built environment because it largely takes the investment decision out of the hands of the dwelling occupier, and therefore allows that decision to be more explicitly economically driven than in the plug-and-play pathway.1 This is also true in comparison with the community microgrids pathway, but in this case decisions may also be driven by the community’s particular needs and the potential for bolstering of the local economy in ways such as increased employment. Community microgrids are also less likely to constitute a mass market, although they may be a stepping-stone that proves concepts and raises the profile of successful approaches, leading to further uptake. Between the three pathways, only ESCO (or energy suppliers acting as ESCOs; the company control pathway) actors can almost always be assumed to be economically rational, making investment decisions based on classic parameters such as net present value. Therefore the success of the company control deployment pathway in allowing CHP to reach a mass market can be closely linked to the economic advantage the systems offer. Likewise with the plug-and-play pathway and community microgrids, other factors relating to diffusion of innovations as discussed in Rogers (2003) will also play a role, but economics is likely to remain central to decision making.
Central performance metric
It is clear that economics forms the central concern in terms of achieving a mass market for CHP under all three deployment pathways. It is not the sole issue, but where other factors such as social prestige of ‘greenness’ are addressed, economic profitability will be critical to achieving a large market share.
For CHP, attitudes and expectations regarding performance are inextricably linked to those of incumbent heating and electricity systems. Therefore, the investment decision for CHP should be considered in comparison with that of the competing reference grid/boiler systems, and it is the capital cost difference between the two options (that provide an essentially comparable service) that the potential adopter faces. Therefore, the primary metric chosen to address these issues is the net present value of the CHP system with respect to the competing reference system. This metric is calculated as the discounted value of the annual profits the ECSO could obtain from installing CHP in the customer’s dwelling and operating it over its lifetime. The ESCO makes profit by charging the customer the same amount that they would have been charged if they had used the incumbent grid/boiler reference system. Therefore this metric is cost-neutral for the dwelling occupier in that it assumes gains afforded through reduced operational costs are offset by the leasing cost (i.e., the annualised capital cost) of the CHP equipment. The net present value of the ESCO’s profits can act as a guide for maximum installed capital costs the ESCO would pay for the CHP system. The reader should also note that the metric could equally be interpreted as the maximum capital cost a dwelling occupier or community would pay for outright purchase of the CHP system in the plug-and-play or community microgrid models, if they were to accept the chosen cost of capital.
The chosen central performance metric caters directly to the company control pathway, and also has relevance to the other deployment pathways. Importantly, it is formulated to avoid the issue of incorporating uncertain capital costs into economic calculations, indicating the maximum allowable capital cost rather than guessing at a specific capital cost.
Carbon dioxide (CO2) performance metrics
In addition to the economic metric, further gauges are required to understand the capability of CHP to aid in achieving the goals of energy policy. At present, foremost among these goals is reduction of greenhouse gas emissions. For greenhouse gas emissions reduction, the adopted metric is straightforward: the annual CO2 savings provided by the CHP system when compared to that of the competing reference system. This measure considers only the operational greenhouse gas emissions. Lifecycle emissions due to manufacturing, fuel chain, disposal/recycling are not included and for these aspects readers are referred to Pehnt (2008). The CO2 metric is calculated based on the results of the optimisation. Therefore it relates to a situation where the economic performance of the system has been optimised, leading to the CO2 related result. This implies that the primary driver for CHP adoption is assumed to be economic, and the influence of CHP on CO2 is consequential.
2.4.2 Description of the optimisation problem
The complete mathematical formulation for the optimisation problem will not be presented here, and the reader is referred to published descriptions of the method in Hawkes et al. (2009a). Instead, a brief description of the objective function, decision variables, and constraints of the optimisation are provided to clarify the conceptual framework.
The objective function of the optimisation is the annual cost of meeting a given energy demand profile, which is minimised. The energy demand profiles consist of heat and electricity demand, and are represented by a set of ‘sample days’ that are deemed to adequately characterise the complete annual demand. Depending on the CHP application, the demands are represented as 5-minute, half hourly, or hourly demand over each sample day, with more peaky demand profiles (such as residential demand) requiring finer temporal resolutions to properly capture demand dynamics following Hawkes and Leach (2005).
• the output of the CHP prime mover in each time period (kWhe, kWhth), split piecewise by level of prime mover output to allow characterisation of non-linear efficiency profiles,
• the output of the supplementary thermal system in each time period (kWth),
• import of grid electricity in each time period (kWhe),
• charge to and discharge from electricity storage in each time period (kWhe),
• charge to and discharge from thermal energy storage in each time period (kWhe),
• yes/no variable to determine whether to switch on/off in each period.
• electricity demand must be met in each time period,
• thermal energy demand must be met in each time period, or exceeded by a small margin,
• the capacity of each system must not be exceeded, and charge/discharge rates for storage must not be exceeded,
• the minimum operating point of each system must be respected,
The primary economic metric can be calculated from the value of the optimised objective function. This is achieved by calculating the cost of meeting the same energy demand with a defined reference system (e.g. a condensing boiler and grid electricity) and subtracting the value of the optimised objective function. The result is the annual saving provided by the system and, where a certain lifetime is assumed, the net present value of that annual saving can be calculated. This net present value is the primary economic metric as discussed above; it is the amount a rational investor would pay for the micro-CHP system over-and-above what they would pay for the competing reference system.
Once this mathematical formulation is implemented, it may be used to explore a variety of technical, economic and policy-related aspects of CHP. In the following sections the case of micro-CHP for residential applications in the UK is considered, from the point of view of an investor/policy maker, and then a technology developer, each of which have differing interests. The CO2-related performance is also considered, culminating in a synthesis of the key characteristics of micro-CHP installations that are more likely to be commercially successful.
2.5 Case study: micro combined heat and power (CHP)
This case study applies the technique discussed above to examine an interesting emerging class of CHP technologies: that of micro-CHP for residential applications. These are essentially ‘home heating solutions’ designed to replace existing systems such as boilers or furnaces, and can provide both space heating and hot water, in addition to some electricity. The potential market for such systems is large, with ten-of-millions of boiler replacements occurring each year in Europe alone according to Micro-Map (2002). There are several examples of their development, demonstration, and commercialisation in, for example, Tokyo Gas Co. (2005) and Anon. (2007, 2008).
The main prime mover technologies for micro-CHP are polymer electrolyte fuel cells (PEMFC), solid oxide fuel cells (SOFC), internal combustion engines (ICE), and Stirling engines. Each of these core technologies have individual limitations and performance characteristics, and they are at very different stages of development. This case study focuses on two key near-to-medium term technologies for Europe: ICEs and SOFCs. Specific results are based on the energy demand characteristics, energy prices and CO2 emissions rates of the UK in 2009, but the technique could be applied to any country and any time period.
A summary of the input parameters for the case study is as follows. At the time of writing the average annual dwelling electricity demand in the UK was 4.3 MWh, and average annual total thermal demand was approximately 18 MWh, although wide variation around these values is observable. Energy prices were approximately 10p/kWh (U$0.15/kWh) for electricity and 2.5p/kWh (U$0.0375/kWh) for gas. Grid-embodied CO2 rates were approximately 0.52 kgCO2/kWh, and gas was assumed to embody 0.19 kgCO2/kWh (net calorific value). Finally, details of the technical limitations and performance characteristics of the micro-CHP systems investigated can be found in Hawkes et al. (2009b). The primary distinction between prime movers in terms of techno-economics is their heat-to-power ratio (HPR), as discussed below. SOFCs have the lowest HPR of about 1 kWthh to 1 kWeh (1:1), whilst PEMFCs, ICEs and Stirling engines exhibit HPRs of approximately 2:1, 3:1, and 8:1, respectively. Finally, the lifetime of each system is assumed to be 10 years (equivalent to the average service life of the existing boiler stock), and the service interval is assumed to be the same as for a boiler (once per year, at an additional cost of £25 relative to a boiler service).
The following analysis takes these inputs and applies them in the modelling methodology in two distinct ways: firstly, to inform investors regarding the key drivers and potential of each prime mover technology, and secondly, to inform system developers regarding which technical aspects upon which to focus research and development.
2.5.1 Techno-economic assessment for investors and policy makers
It has been widely reported that there is a relationship between the thermal demand met by CHP units and their economic viability, with high and consistent thermal demand often associated with positive results. Whilst it is not expected that micro-CHP is an exception to this rule, it is informative to investigate the extent to which annual demand influences value, given the distinctive nature of residential tariffs and demand. It is also informative to investigate the influence of annual electricity demand.
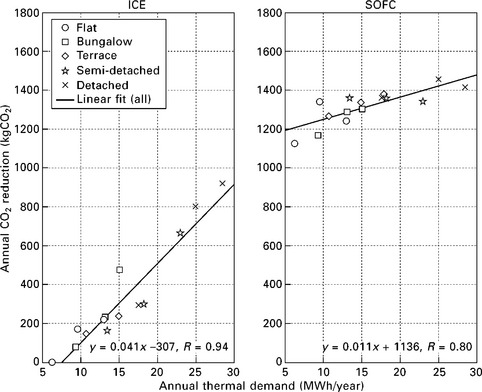
Figure 2.3 displays the variation in economic results for two key micro-CHP technologies with respect to the dwelling’s annual thermal demand (for this figure annual electricity demand has been held constant at the UK mean value of 4.3 MWh/year). Therefore the only source of variation in each plot is the annual thermal demand profile applied. Thermal demand scenarios correspond to each of the five dwelling construction types reported on in the UK census, with each construction type denoted by three markers corresponding to ‘existing’, ‘refurbished’ and ‘new’ insulation standards (i.e., decreasing thermal demand). Inspection of the figure reveals that the dependence of the economic result on annual thermal demand is evident in all cases, but is more obvious in the case of the micro-CHP prime mover with higher heat-to-power ratio (i.e., the internal combustion engine). The ICE is more exposed to lack of thermal demand, demonstrated by the relatively steep slope of the linear fit in the left subplot. The fuel cell-based system shows a more consistently positive economic result which does not change significantly as annual thermal demand decreases (with corresponding shallower slope on the linear fit). The key inference here is that SOFC-based systems are more economically resilient to changes in annual thermal demand than ICE-based systems.
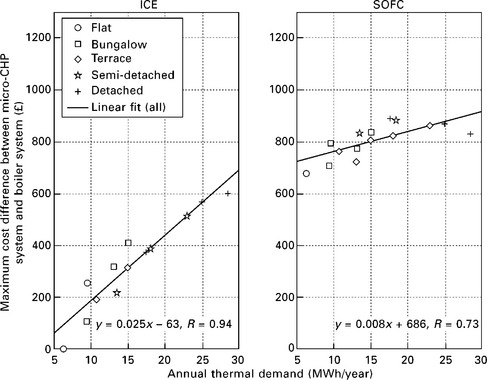
2.3 Sensitivity of economic performance of two micro-CHP systems (ICE – internal combustion engine, and SOFC – solid oxide fuel cell) to annual thermal demand in the target dwelling. Each subplot contains data for five typical UK construction types, and a linear fit to all data points.
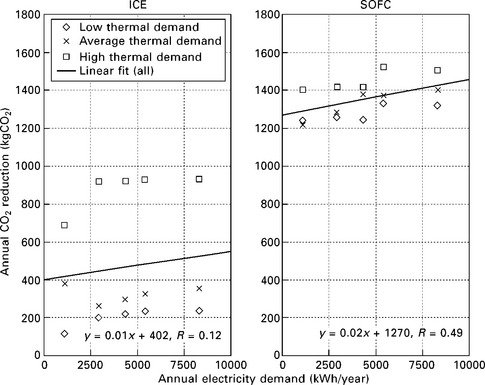
Figure 2.4. displays the sensitivity of the economic result to the dwelling’s annual electricity demand (plotted across three cases of annual thermal demand; an existing flat - ≈ 13 MWh/year (low); average existing terrace - ≈ 18 MWh/year (average); and an existing detached house - ≈ 28.5 MWh/year (high)). These thermal demands include both space heating and domestic hot water demand. It is apparent from this figure that the fuel cell-based system shows strong dependence of economic result on annual electricity demand; much stronger than its sensitivity with respect to annual thermal demand observed in Fig. 2.3. Conversely, the engine-based system shows approximately the same sensitivity to annual thermal demand as it does to annual electricity demand. It can be deduced that electricity demand and thermal demand are both important for a positive economic result for the engine-based system, but onsite electricity demand is the primary driving factor for the fuel cell-based system.
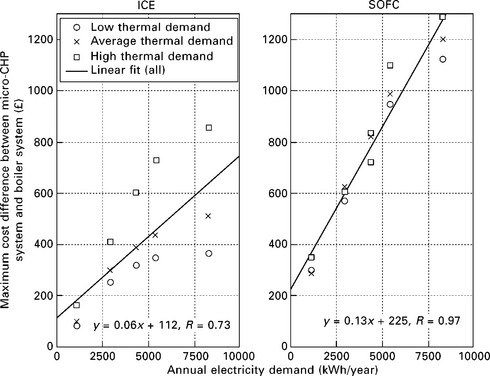
2.4 Sensitivity of economic performance of two micro-CHP systems (ICE – internal combustion engine, and SOFC – solid oxide fuel cell) to annual electricity demand in the target dwelling. Each subplot contains data for five typical UK construction types, and a linear fit to all data points.
Overall the results in Figs 2.3 and 2.4 can be synthesised to arrive at a key conclusion for micro-CHP: those prime movers that produce heat are more likely to be more influenced by the level of annual thermal demand. Lack of thermal demand, or significant heat production for a given electricity output (i.e., a high heat-to-power ratio of the micro-CHP prime mover), corresponds to a constraint on system operation. Essentially these ‘thermal constraints’ limit the ability of a system to benefit economically from displacing onsite electricity demand. Conversely, the economic performance of systems that produce less heat (i.e., low heat-to-power ratio) is driven more by annual electricity demand. This relates to the fact that thermal constraints do not interfere so much with their operation, and they can therefore access the value associated with generating electricity to displace onsite demand which would otherwise have been met by more expensive grid electricity. Lack of onsite electricity demand obviously limits the ability of the system to displace it and gain access to this value. In summary, primary value for micro-CHP lies in generating to displace onsite electricity demand; access to this value is enabled by the presence of such demand, and the presence of thermal demand and/or application of a prime mover with a low heat-to-power ratio to avoid thermal constraints on operation.
2.5.2 Techno-economic assessment for technology developers
Choice of prime mover nameplate capacity is an important concern for micro-CHP systems developers in terms of where their product fits into the market, and those concerned with assessing the economic credentials of micro-CHP. Therefore the sensitivity of economic performance to capacity choice is investigated here. This is important because examination of a single capacity system may miss valuable opportunities for micro-CHP developers to scale up or scale down their products. Figure 2.5 displays the difference in value between the micro-CHP system and the reference grid-boiler system (i.e., the central performance metric) for ICE and SOFC-based micro-CHP, with sensitivity of results to annual energy demands of three construction-type variants.
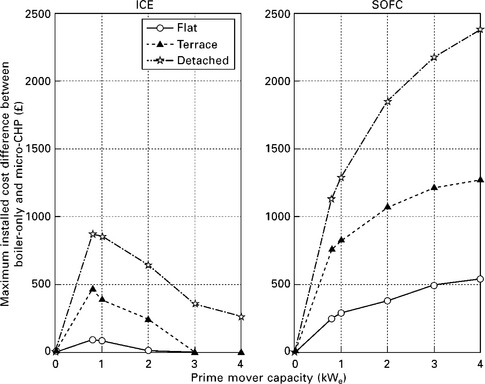
2.5 Sensitivity of micro-CHP system value to prime mover capacity. Plotted for two prime mover types (ICE – internal combustion engine, and SOFC – solid oxide fuel cell) and for three dwelling construction types in the UK.
Figure 2.5 shows the notable variation in value between the two micro-CHP technologies with respect to competing conventional boiler systems. For a 1 kwe SOFC-based system operating in a mean demand situation (i.e., the terraced house in the right subplot) an investor with 12% cost of capital would pay approximately £800 (US$12002) more than what they would pay for the competing boiler. Conversely, a rational investor would only pay approximately an extra £400 (US$600) for the modelled ICE system.3 Moreover, Fig. 2.5 demonstrates that the current economic situation presents a challenge for any micro-CHP developer. This is because the manufacturing cost of including the micro-CHP prime mover and balance of plant (in addition to the boiler) in the system is likely to be considerable, and a challenge for system developers to attain with an allowable margin of less than £1000 (US$1500) including any potential profit. As such, early markets are likely to focus on houses with larger demands which have access to higher value, up to £1300 (US$1950) per installation, and on installations driven by non-economic aspects such as environmental benefits.
Also with regard to Fig. 2.5, it is instructive to note how the value per kWe installed changes with increasing prime mover capacity. Almost all the plotted lines have the largest positive slope between 0 kWe and 1 kWe prime mover capacity. As prime mover capacity increases thereafter, value per additional kWe installed decreases. Therefore there is probably no justification in providing a product to the UK residential market with prime mover capacity greater than approximately 1 kWe. This result does vary between technologies; the value per kWe installed for fuel cell-based systems is clearly not as sensitive to increasing capacity as the engine-based systems. At the far end of the scale, a comparatively large SOFC-based system has a value of roughly £2400 (US$3600) more than the competing boiler, and this could be a reasonable manufacturing proposition if economies of scale entail cheaper production (per kWe) of larger systems. Regardless of such possibilities, micro-CHP systems with 1 kWe capacity present the best per kWe installed value, and are probably the best proposition for a mass market which is dominated by single-residence dwellings in a mild climate.
Aside from choice of capacity, many other high-level technical characteristics are of interest to micro-CHP system developers. For example, Fig. 2.6 displays the sensitivity of the economic result to a range of maximum allowable ramp rates. Ramp rates are important particularly for fuel cell-based systems, which may face durability issues under regular thermal cycling, and the developer faces a choice regarding whether or not to invest time in improving ramping performance. This question can be answered in that the figure clearly shows that variation in the maximum allowable ramp rate of the micro-CHP system does not have a significant influence on economic credentials. Only at very low maximum ramp rates below 20 Watts per minute is any influence discernable, and even then it is minor, corresponding to less than 5% of the value of the fuel cell-based micro-CHP systems. From a technology developer’s point of view, this means that they should not invest in creating systems that are able to ramp up and down quickly in response to changing conditions. Rather, they should focus on development of somewhat predictive control systems that can forecast when operation will be required and/or profitable. In a single residential dwelling this is relatively easily achieved, where the user programs a desired temperature profile, thus giving the system much advance warning of expected modes of operation.
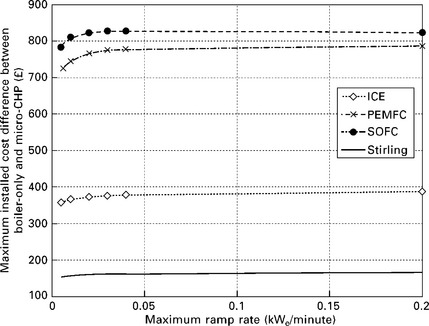
2.6 Sensitivity of economic result to the maximum ramp rate for four micro-CHP technologies (ICE – internal combustion engine, PEMFC – polymer electrolyte membrane fuel cell, SOFC – solid oxide fuel cell, and Stirling engine). Results plotted for 1 kWe system operating in an average terraced house.
For the final example of the use of techno-economics to provide information to developers, Fig. 2.7 presents the sensitivity of the case for investment to minimum operating point (i.e., a proxy for turndown ratio) for four micro-CHP systems. Once again a clear differentiation is apparent between the prime mover technologies. The low heat-to-power ratio fuel cell-based systems are much more resilient to limited turndown characteristics than the higher heat-to-power ratio engine-based systems. For example, the Stirling engine-based system is unable to provide a positive case for investment if it cannot turn down below 0.4 kwe, whilst the fuel cell-based systems retain value even when they cannot turn down at all.
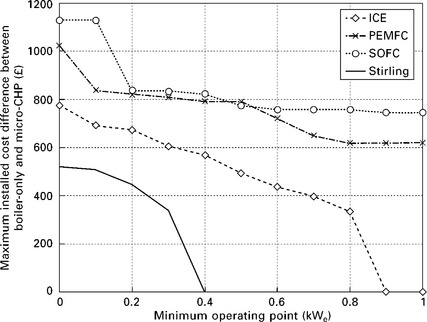
2.7 Sensitivity of economic result to the minimum operating point for four micro-CHP technologies (ICE – internal combustion engine, PEMFC – polymer electrolyte membrane fuel cell, SOFC – solid oxide fuel cell, and Stirling engine). Results plotted for 1 kWe system operating in an average terraced house.
The result in Fig. 2.7 presents a challenge for micro-CHP prime mover developers, because achieving efficient turndown in small systems is problematic, where the conventional wisdom is that balance of plant (BoP) energy consumptions become dominant and system efficiency drops off rapidly. The majority of 1 kwe engine-based units in field trials and commercially available (in Japan) are not able to turn down at all. They offer on/off operation only. whilst this engineering decision could have been taken for a variety of technical reasons, the results of the analysis presented suggest turndown should be considered as a valuable system characteristic, even if that turndown involved operation at a few selected set-points. should BoP components be improved to the point where turndown to near-zero output whilst maintaining efficiency is possible, particularly for fuel cell-based systems, substantial additional value would become available to the owner/operator, arguably increasing the value of the unit to the developer.
This and the previous sub-sections have presented examples of how techno-economic optimisation modelling might be used to assess the economic performance CHP. The following two sub-sections build on this analysis from a different perspective; that of the stakeholder who considers environmental performance to be important. A policy maker may be one example of such a stakeholder.
2.5.3 CO2 emissions reduction performance
Figure 2.8 shows the sensitivity of annual CO2 emissions reductions to system nameplate capacity for the two key micro-CHP systems. There is clear differentiation between these prime mover technologies, with the fuel cell-based system offering a definitive performance advantage. Similarly to the results relating to the relative economics of micro-CHP systems presented in the previous sections, these CO2-related results can be attributed to the different heat-to-power ratios between the technologies. Those technologies with a low heat-to-power ratio prime mover are less constrained by lack of thermal demand and are subsequently able to generate more electricity and thereby gain CO2 credit for offsetting more grid electricity.
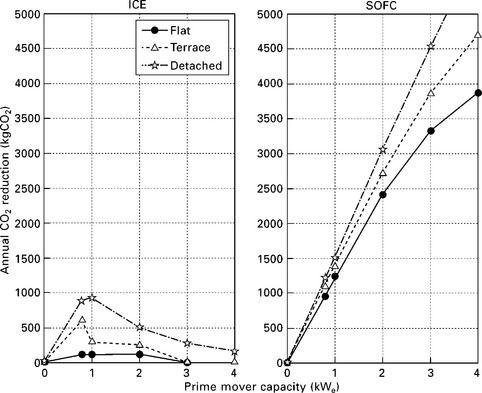
2.8 Sensitivity of CO2 reductions to prime mover capacity. CO2 reduction is with respect to the reference grid/boiler system, and plotted points are for two prime mover types (ICE – internal combustion engine, and SOFC – solid oxide fuel cell) and three dwelling construction types in the UK.
A further point of interest from Fig. 2.8 is that the SOFC-based micro-CHP is able to virtually eliminate the entire operational CO2 footprint of the dwelling when a 4 kwe system is installed. whilst such large nameplate capacity systems may be prohibitively expensive in the near term, the result still presents an interesting possibility for delivering housing in the line with the UK’s current low carbon policy. For example, the 4 kwe system could single-handedly achieve the UK government’s 2050 80% emissions reduction target for that dwelling. However, extension of this concept to a large number of dwellings is problematic because the result is underpinned by a high CO2 rate for grid electricity, which would not be the case if fuel cell micro-CHP produced a large portion of this grid electricity.
It is also instructive to consider the sensitivity of the CO2 result to annual thermal demand (holding electricity demand constant), and annual electricity demand (holding thermal demand constant), once again mirroring the economic analysis. Figures 2.9 and 2.10 present these sensitivities for 1 kWe systems, operating in each of the five dwelling construction types and across ‘existing’, ‘refurbished’, and ‘new’ building thermal performance standards.
2.9 Sensitivity of CO2 performance of two micro-CHP systems (ICE – internal combustion engine, and SOFC – solid oxide fuel cell) to annual thermal demand in the target dwelling. Each subplot contains data for five typical UK construction types, each with three insulation levels, and a linear fit to all data points.
2.10 Sensitivity of CO2 performance of two micro-CHP systems (ICE – internal combustion engine, and SOFC – solid oxide fuel cell) to annual thermal demand in the target dwelling. Each subplot contains data for five typical UK construction types, each with three insulation levels, and a linear fit to all data points.
Figure 2.9 shows that annual thermal demand can be important in micro-CHP achieving CO2 reductions. This is particularly apparent for the higher heat-to-power ratio (HPR) ICE-based systems. In contrast, the SOFC-based system provides reductions largely independent of annual thermal demand. These two cases relate once again to HPR; the ICE engine (higher HPR) is unable to provide reductions for low annual thermal demands because its operation is frequently curtailed by thermal constraints, whilst the SOFC-based prime mover (low HPR) can operate almost all the time because it rarely encounters these constraints regardless of the thermal demand scenario.
Figure 2.10 shows the CO2 reduction achievable by 1 kWe micro-CHP systems across a range of annual electricity demand scenarios. This figure demonstrates that there is little reliance of CO2 reduction on annual electricity demand for any specific construction type. This can be contrasted with the equivalent economic result presented in Fig. 2.4, which showed great dependence of economic result on annual electricity demand, particularly for low HPR prime movers. The reason for this contrasting CO2 result is that displaced grid electricity CO2 rates are the same regardless of whether generation is consumed onsite or exported to the grid (conversely, in the economic case, export attracts a lower value than onsite generation under central estimate values).
2.5.4 Key characteristics of commercially successful micro CHP
The conclusion to be drawn from the case study of residential micro-CHP can be summarised as follows. The economic value of these systems (with respect to competing boiler systems) is driven by the combination of the ability to produce electricity and presence of onsite electricity demand to be met. It is limited by excessive thermal production and/or lack of thermal demand in the target dwelling. For appropriately sized prime movers, heat-to-power ratio is the key technical metric that speaks to these issues because it captures the propensity of a prime mover to deliver electricity despite low thermal demands. At times of low thermal demand a micro-CHP prime mover with a low heat-to-power ratio will be able to continue operating (and displacing expensive electricity import) where a higher heat-to-power ratio technology will be required to modulate or switch off.
The driving forces of CO2 reduction for micro-CHP are identical to those of economic value, with the exception that the annual electricity demand of the target dwelling is not important. This is because the CO2 credit obtained for displacing imported electricity is identical to that for exported electricity. Conversely, for the economic case, the value of displacing onsite electricity demand is substantially higher than the value of electricity exported to the grid.
On the whole, technologies with low heat-to-power ratios, low thermal capacity, contributing to serving dwellings with larger annual electricity and thermal demands are best placed to access economic value. For CO2 reductions, technologies with low heat-to-power ratio, low thermal capacity, serving dwellings with larger annual thermal demand are best placed to provide savings. Therefore appropriately sized fuel cell-based micro-CHP technologies, which have the lowest heat-to-power ratios of the investigated systems, benefit from all of these attributes and provide the best performance. The SOFC-based systems as characterised here provide the largest allowable installed cost difference (with respect to competing boiler systems) and the greatest potential CO2 emissions reduction. Higher heat-to-power ratio ICE-based systems still exhibit competitive performance credentials, but are more challenged to provide savings when thermal demands are low.
The primary caveat to these statements is that the final mass-manufactured installed costs of each technology are not yet observable. For example, the relative advantages of SOFCs may be less relevant if the final commercial products are much more expensive than internal combustion engines, which is arguably likely to be the case. Investigation of potential final installed cost of systems is beyond the scope of this chapter, but the analysis above has been designed to be applicable regardless of this.
2.6 Future trends
On the whole, small-scale CHP is a relatively established technology, with a variety of systems already commercially available, and with a growing market share. But the range of technologies captured by the term CHP is vast, spanning from the well-established internal combustion engine through to the most sophisticated bio-energy or fuel cell-based systems. As such, there are always emerging technologies under the CHP banner, and much potential for scale-up or scale-down of established systems. Over the past decade perhaps the most interesting development has been that of micro-CHP, which has not yet entered the market in force except in Japan, where internal combustion engines dominate. New technologies, particularly fuel cells as discussed in this chapter, could form an important part of this market in future. Indeed, several developers are planning market launch of relevant products within the next few years. Of course, history tells us that many of these systems may not turn out to be viable or may require more development.
Looking further into the future, the international low carbon aspirations may force attention to be directed more towards technologies that can meet long-term greenhouse gas emissions reduction targets. CHP fuelled by fossil fuel-based gases will always be challenged in this regard, because even perfectly efficient utilisation of relatively clean natural gas results in production of approximately 0.19 kgCO2/kwh, so there is little room for achieving reductions of the magnitude required. Therefore alternative fuels and technologies must be considered in the future. At the time of writing, much attention is focused on two potential routes to deeper carbon reductions. These are the mass market introduction of heat pumps, and the decarbonisation of piped natural gas for use in CHP or boilers/furnaces. Given inherent limitations in decarbonising piped gas by injection of waste-to-energy and biomass sources, it seems likely that the key competitor to CHP in the coming decades will be heat pumps (for space and water heating applications). Nevertheless, heat pumps face their own set of unique challenges, primarily surrounding installation and technology cost and upstream infrastructure impacts, and as yet there is no considered solution to these issues.
Research is required into classes and combinations of demand-side technologies that can meet low carbon targets, and it is fitting that CHP remains a consideration in this regard due to its potential for fuel flexibility, relatively low cost, and arguably complementary upstream infrastructure impacts. Ultimately CHP is likely to form part of a diversified solution to meeting energy needs, where its informed use in combination with alternative technologies such as heat pumps could serve to meet stringent carbon aspirations whilst simultaneously minimising infrastructure investment requirements in coming decades.
2.7 Sources of further information and advice
Interested readers may find the following bodies of work of interest:
• IEA ECBCS Annex 42 on Residential Cogeneration, investigating the performance of several micro-CHP systems using experimental data and building simulation approaches: available at http://cogen-sim.net/.
• IEA ECBCS Annex 54 on the Assessment of Microgeneration Technologies, a new Annex investigating integration of microgeneration technologies.
• The CHPA-funded report questioning ‘all-electric’ heating approaches versus combined heat and power in Speirs et al. (2010).
2.8 References
Anon. Ceres Power funding to develop manufacturing. Fuel Cells Bulletin. 2007; 2007(7):8.
Anon. CFCL invests in German facility, wins Nuon order. Fuel Cells Bulletin. 2008; 2008(4):9–10.
European Commission. Eurostat Database: Energy Prices. http://epp.eurostat.ec.europa.eu/portal/page/portal/energy/introduction, 2010. [Retrieved 24 March 2010, from].
Hawkes, A.D., Leach, M.A. Impacts of temporal precision in optimisation modelling of micro-combined heat and power. Energy. 2005; 30(10):1759–1779.
Hawkes, A.D., Brett, D.J.L., Brandon, N.P. Fuel cell micro-CHP techno-economics: Part 1 - model concept and formulation. International Journal of Hydrogen Energy. 2009; 34(23):9545–9557.
Hawkes, A.D., Staffell, I., Brett, D.J.L., Brandon, N.P. Fuel cells for micro-combined heat and power generation. Energy & Environmental Science (Royal Society of Chemistry). 2009; 2(7):729–744.
Lovins, A., Datta, E.K., Feiler, T., Rabago, K.R., Swisher, J.N., Lehmann, A., Wicker, K. Small Is Profitable: The Hidden Economic Benefits of Making Electrical Resources the Right Size. Snowmass, CO: Rocky Mountain Institute; 2002.
Micro-Map. Mini and Micro CHP - Market Assessment and Development Plan: Summary Report. London: FaberMaunsell Ltd; 2002.
Padhy, N.P. Unit commitment - a bibliographical survey. IEEE Transactions on Power Systems. 2004; 19(2):1196–1205.
Pehnt, M. Environmental impacts of distributed energy systems - the case of micro cogeneration. Environmental Science & Policy. 2008; 11(1):25–37.
Rogers, E.M. Diffusion of Innovations. New York: Free Press; 2003.
Sauter, R., Watson, J. Strategies for the deployment of micro-generation: implications for social acceptance. Energy Policy. 2007; 35(5):2770–2779.
Speirs, J., Gross, R., Deshmukh, S., Heptonstall, P., Munuera, L., Leach, M., Torriti, J. Building a roadmap for heat: 2050 scenarios and heat delivery in the UK. London: A Report by Imperial College London and University of Surrey for the Combined Heat and Power Association; 2010.
Tokyo, Japan Tokyo Gas Co, Sales of the residential gas engine cogeneration system ‘ECOWILL’ and establishment of the optional agreement ‘ Residential cogeneration system contract’. 2005.
Watson, J. Co-provision in sustainable energy systems: the case of micro-generation. Energy Policy. 2004; 32(17):1981–1990.
1It should be noted that provision of quality information is of great importance in the plug-and-play model. This is because household owners/occupiers frequently do not have the time or knowledge to assess the economics of a particular CHP installation. Provision of such advice by independent experts could go a long way to achieving appropriate uptake of micro-CHP under a plug-and-play model.
2The exchange rate at the time of writing was applied here, where £1GBP ≈ US$1.50.
3Whilst one cannot draw conclusions regarding comparison between the economic attractiveness of the two technologies based on this result (because manufacturing and installation costs for systems incorporating each prime mover type are not yet readily observable), it is clear that fuel cell system developers have more breathing space.