Sometimes, your infrastructure is all healthy except applications having an issue due to some bug in your code or any third-party software issues. You may have applied some vendor-provided operating system security patch that messed up your application. Application monitoring may include metrics, such as following:
- Endpoint invocation: Number of request counts in a given period
- Response time: Average response time to fulfill the request
- Throttle: Number of valid requests spilled out as the system runs out of capacity to handle the additional requests
- Error: Application throw an error while responding to a request
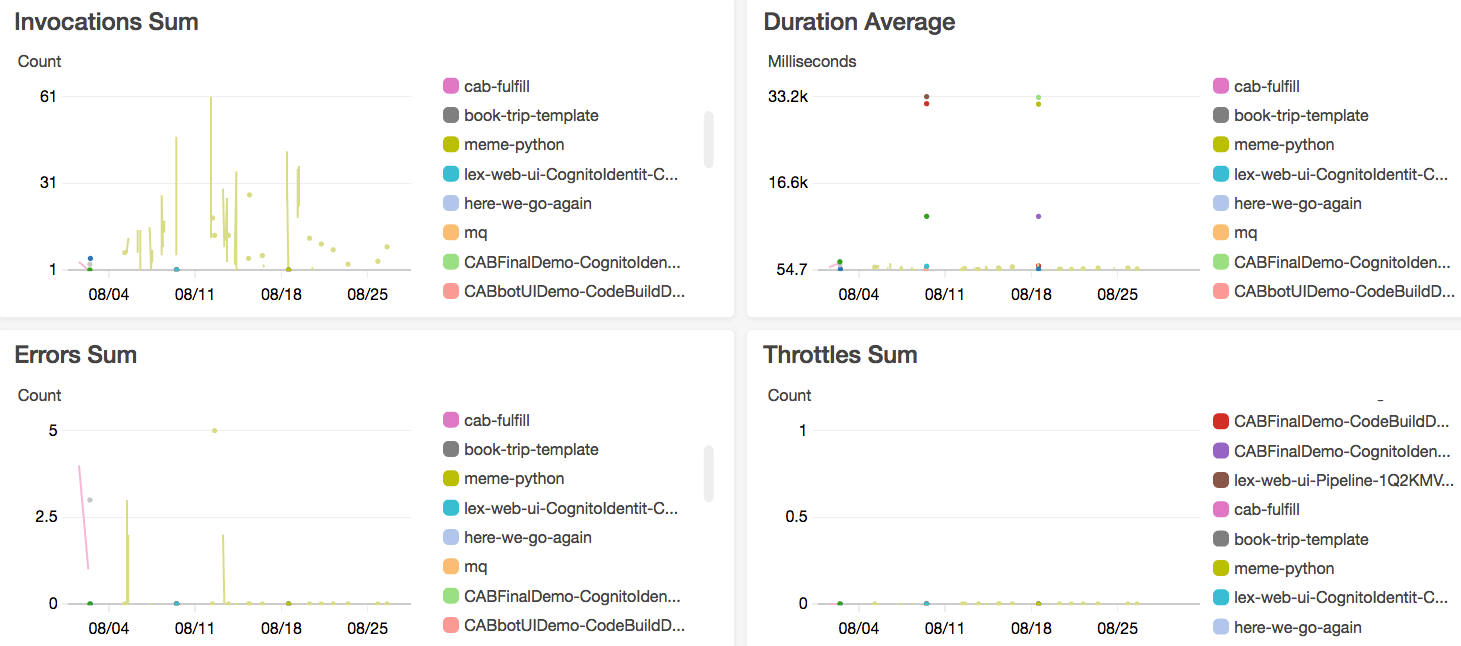
The following screenshot shows a sample application endpoint-monitoring dashboard:

Application monitoring dashboard
There could be many more metrics based on application and technology—for example, a memory garbage collection amount for a Java application, a number of HTTP POST and GET requests for a RESTful service, a count of 4XX client errors, a count of 5XX server errors for a web application, and so on.
