
Traditionally, log monitoring was a manual process, and organizations took a reactive approach to analyze logs when issues were encountered. However, with more competition and increasing expectations from users, it has become essential to take quick action before the user notices the issue. For a proactive approach, you should have the ability to stream logs in a centralized place and run queries to monitor and identify the issue.
For example, if some product page is throwing the error out, you need to know the error immediately and fix the problem before the user complains, else you will suffer a revenue loss. In the case of any network attack, you need to analyze your network log and block suspicious IP addresses. Those IPs may be sending an erroneous number of data packets to bring down your application. Monitoring systems such as AWS CloudWatch, Logstash, Splunk, Google Stackdriver, and so on provide an agent to install in your application server. The agent will stream logs to a centralized storage location. You can directly query to central log storage and set up alerts for any anomalies.
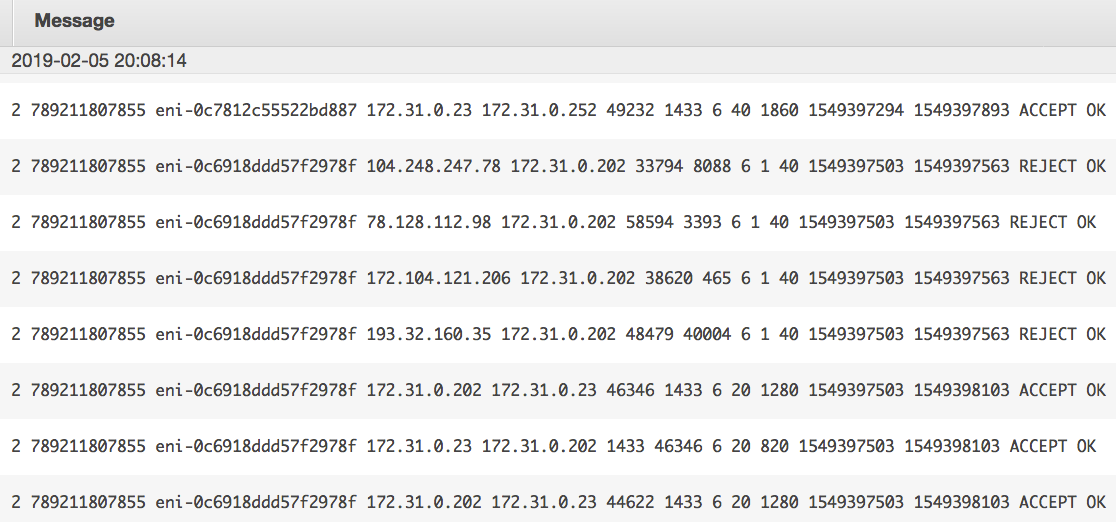
The following screenshot shows a sample network log collected in a centralized place:
You can run a query in these logs and find out the top 10 source IP addresses with the highest number of reject requests, as shown in the following screenshot:

As shown in the preceding query editor, you can create a graph and put an alarm in, if the number of rejections detected crosses a certain threshold, such as more than 5,000.