Chapter 5. Galleries, Live Preview, and Themes
In this chapter
A goal of Microsoft Excel 2007 is to make it easy to make great-looking documents. To this end, Microsoft has included 20 professionally designed themes. A theme is a combination of colors, fonts, and effects. If you change the theme, your whole document instantly gains a new look. Themes can be used across Excel, PowerPoint, and Word.
In addition to the 20 built-in themes, you can download new themes from Office Online, or create new custom themes (for example, to match your company’s logo colors).
Galleries are new to Excel. Organized in rows and columns, a gallery is a drop-down that may contain 20 thumbnails of professionally designed choices. If you are formatting a table, creating a chart, or choosing an effect for an image, you can select built-in effects from a gallery. Many galleries allow you to customize new styles to be added to the gallery on your computer.
Live Preview is a testament to just how fast computers have become. If you would like to change a font style, you simply select the cells and then open the font name list box. As you hover over a font, the worksheet behind the list box instantly updates to show what the worksheet would look like if you chose the font.
The process of choosing a font or an effect often involves hovering here, hovering there, finding the appropriate font or effect, and clicking it.
Using Galleries
A gallery is a new, super-sized selection box that appears from either a drop-down on a ribbon or from one of a number of icons on a ribbon.
The Format as Table icon on the Home ribbon is an example of a gallery that appears from a drop-down on the ribbon. When you select this drop-down, the first six rows of the gallery appear, as shown in Figure 5.1. Below the 42 choices shown, some menu items appear. These menu items usually take you to a More dialog box or to a dialog box to create a new style.
Figure 5.1. Choose Format as Table, and a large gallery appears.

The gallery shown in Figure 5.1 has a scrollbar along the right side. You can scroll down to see the additional styles available in the gallery.
If you hover over any gallery thumbnail, a ToolTip appears, giving you information such as the name of the style.
Figure 5.2 shows the gallery after you scroll to the bottom. A ToolTip identifies one selection.
Figure 5.2. You have to scroll through some galleries to see the entire selection.

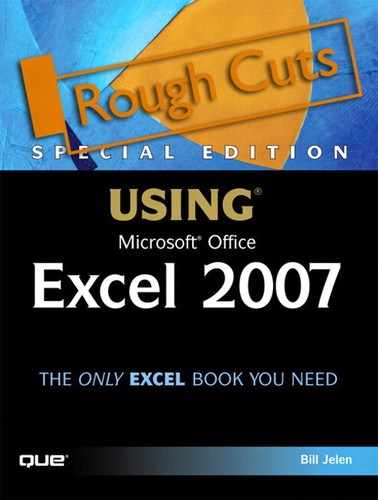
The Chart Styles gallery on the Chart Tools – Design ribbon is an example of a gallery that appears as several icons on the ribbon. As shown in Figure 5.3, the gallery initially shows six icons. There are three arrow icons to the right of the gallery. The first two arrows scroll one row at a time into view in the ribbon.
Figure 5.3. The up and down scroll buttons adjacent to the gallery in the ribbon enable you to scroll through one row at a time.
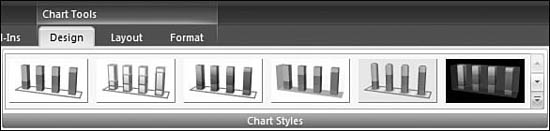
A more efficient method for viewing more items in the gallery is to use the More button to show all items in the gallery. The More button is the third button to the right of the gallery, as shown in Figure 5.4
Figure 5.4. You use the More button to open the entire gallery.
Using Live Preview
Live Preview provides an answer to the question, “What would this selection look like in the worksheet?”
If you open a drop-down list from the ribbon, Live Preview is often enabled. As you hover over various items in the list, the selected cells in the worksheet automatically preview what they would look like if you selected that option.
When you hover over a different selection, Live Preview quickly changes to reflect the new selection. Figure 5.5 shows a Live Preview of some text in the Parkway Resorthotel font.
Figure 5.5. If you hover for a second over one font, Excel shows a preview of the font in the selected cells.

The preview shown with Live Preview is not permanent. If you hover over another item, the view of the workbook changes. In the process of scrolling up to the Cocktail Shaker font shown in Figure 5.6, for example, Excel flips through dozens of previews of the data.
Figure 5.6. If you move to a new font the preview changes.

If you close the list box without clicking an item, the workbook reverts to the original style.
The Live Preview feature works with items as mundane as the font size and font face drop-downs. It also works with many new features, such as table format and conditional formatting color scales.
There are a few items with which Live Preview does not work. When you are trying to decide on a chart type, for example, Live Preview is not enabled. This is because Excel would actually have to add an object to the sheet in order to show you the preview. There are also a few drop-downs where Live Preview doesn’t work. Microsoft figures you know what an underline or double underline would look like, so this drop-down does not allow Live Preview.
As with the Mini toolbar, you can choose to turn off Live Preview if it annoys you. From the Microsoft Office menu, you choose Excel Options. In the Personalize category of the Excel Options dialog, you can select the Enable Live Preview check box to enable Live Preview or clear it to disable Live Preview.
Understanding Themes
A theme is a collection of colors, fonts, and effects. Office 2007 has 20 themes built in. You can also download new themes from Office online, and you can design your own themes, too.
Themes are shared in simple XML files, so they can easily be propagated throughout a company.
A theme has the following components:
- Fonts—A theme has two fonts: one for body text and one for titles. The fonts come into play a lot more in PowerPoint and Word, but there are styles in Excel that use them as well.
- Colors—There are 12 colors: 4 for text and backgrounds, 6 accent colors that are used in charts and table accents, and 2 for hyperlinks (1 for followed hyperlinks and 1 for unclicked hyperlinks). You see the 10 colors besides the hyperlink colors in the color chooser, as shown in Figure 5.7. The first 4 colors are for text and backgrounds. The next 6 colors are the accent colors. In each column, you then see various shades of these 10 colors.
Figure 5.7. The color chooser shows 6 shades of each of the 10 theme colors.

- Effects—A theme includes a number of object effects, such as bevel and line style.
Choosing a New Theme
You manage themes on the Page Layout ribbon. There are four drop-downs in the Themes group:
- Themes—This drop-down allows you to switch among the 20 built-in themes.
- Colors—This drop-down allows you to change the color scheme to use the colors from another theme.
- Fonts—This drop-down allows you to use the fonts from another theme.
- Effects—This drop-down allows you to use the effects from another theme.
Changing a theme affects charts, tables, SmartArt diagrams, and inserted objects. Note that you can use only one theme per workbook. If you are changing the theme on Sheet33, the same changes are made on all the other worksheets in the workbook.
To switch to another theme, you follow these steps:
- Arrange your worksheet so that you can see any themed elements, such as tables or charts, on the right side of the screen.
- From the Page Layout ribbon, choose the Themes drop-down from the Themes group.
- Hover over the various themes. The worksheet updates to show the new colors, fonts, and effects.
- When you have found a theme you like, click the theme to apply it to the workbook.
Figures 5.8 and 5.9 show the same worksheet with two different themes.
Figure 5.8. The Solstice theme features a sans serif font and bright colors.

Figure 5.9. The Apex theme features a serif font, muted colors, and different effects.

If you are strictly interested in the accent colors, you can select the Colors drop-down from the Themes group to get a great view of the accent colors used in each theme. Figure 5.10 shows the options in the Colors drop-down.
Figure 5.10. The Colors drop-down shows the accent colors for all 20 themes at once.

Creating a New Theme
You might want to develop a special theme. This is fairly easy to do: You basically need to select two fonts and six accent colors. For example, let’s say you want to create a theme to match your company’s color scheme. The hardest part is probably finding six colors to represent your company because most company logos have two or three colors. The following sections describe how to create a new theme and suggest resources for choosing complementary colors for your company colors.
Understanding RGB Color Codes
Colors on computer monitors are described as a mix of red (R), green (G), and blue (B). Each color channel is assigned a value from 0 to 255. For example, a color of R=255, G=0, B=0 is a bright red. As you add more blue, the red shifts toward a pink or violet color. A color of R=255, G=0, B=128 is a pinkish violet color.
A color of R=0, G=0, B=0 is black. A color of R=255, G=255, B=255 is white. You can create 16.7 million different colors by using combinations of red, green, and blue.
To discover the codes for your company’s color scheme, follow these steps:
- Open your company’s home page in a browser.
- In Internet Explorer, Select View, Source. In Firefox, choose View, Page Source. You now see the underlying HTML code.
- Find the colors used in the page by searching for a pound sign (#). A webpage specifies colors by using a pound sign followed by six characters (for example, #4F81BD).
Although every webpage uses the #123456 notation for describing colors, Microsoft Excel’s theme specification instead needs the RGB value for the color. Luckily, it is fairly easy to convert between the two.
Hexadecimal is a numbering system that has digits 0 through 9 and A through F. Including 0, there are 16 digits in the hexadecimal numbering system. In the decimal system, a 2-digit number can represent 10×10 different combinations. There are 100 numbers, from 00 to 99. In a hex system, a 2-digit number can represent 16×16 different numbers—that is, 256 numbers, from 0 to 255.
In the #123456 nomenclature, the # sign indicates that the number is in hexadecimal. The first two digits are the hex representation of the red value. The next two digits are the hex representation of the green value. The next two digits are the hex representation of the blue value.
Converting from Hex to Decimal
If you don’t have Photoshop or another tool that converts from a hex color to an RGB value for you automatically, you can use functions in Excel to do the conversion. For example, the worksheet in Figure 5.11 converts from a hex color in Cell B1 to the RGB values in B7:B9:
- The formulas in B2:B4 use the
MIDfunction to extract each pair of numbers from the color code. The formula for Cell B2 is shown in Cell C2. - The formulas in B7:B9 use the
HEX2DECfunction to convert the 2-digit hex number to decimal.
Figure 5.11. This quick Excel worksheet can convert from a 6-digit hex color code to a decimal RGB value.

To represent the color #FF9108 in Excel, for example, you would use R=255, G=145, B=8.
Finding New Colors
If you look at your company’s logo and website, you can probably identify two or three colors to use in the theme. You need to come up with a total of six accent colors for a theme.
You can use the free web-based tool at http://wellstyled.com/tools/colorscheme2/index-en.html# to find colors that look good together.
To find complementary colors, you follow these steps:
- Start with a hex representation of one of your logo colors.
- Open http://wellstyled.com/tools/colorscheme2/index-en.html# in a browser.
- In the lower-left corner, click the link for Enter RGB (rough conversion).
- In the window that pops up, enter the portion of the color code after the pound sign (for example, FF9108).
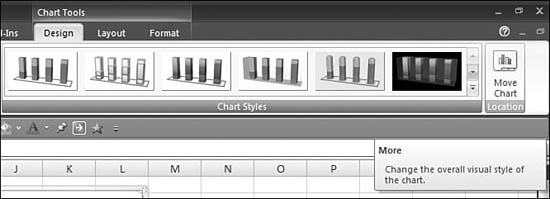
- Click each of the five icons under the color wheel on the left (for contrast, triad, tetrad, and analogic). In the Triad view, the website shows your original color, three others, and three variations of each, as shown in Figure 5.12. The right side of the website specifies the hex color codes for all the colors shown.
Figure 5.12. This webpage suggests colors that complement your logo colors.
Specifying a Theme’s Colors
To specify new theme colors, you follow these steps.
- Select Page Layout, Themes, Colors, Create New Theme Colors. The Create New Theme Colors dialog appears. Remember that a theme is composed of 2 text colors, 2 background colors, 6 accent colors, and 2 hyperlink colors. These 12 colors are shown in the Create New Theme Colors dialog, as shown in Figure 5.13.
Figure 5.13. The 12 colors in the current theme are shown here.

- To change the first accent color, choose the drop-down next to Accent 1. The color chooser appears.
- From the bottom of the color chooser drop-down, choose More Colors. The Colors dialog appears.
- In the Custom tab of the Colors dialog, enter values for red, green, and blue, as shown in Figure 5.14. The New color block shows the color. Click OK to accept the color.
Figure 5.14. You specify the RGB values for the first color.

- Repeat steps 2–4 for each of the accent colors.
- If you want to change the colors for Hyperlink, Followed Hyperlink, and Text, repeat steps 2–4 for any of those.
- In the Name box, give the theme a name, such as your company name.
- Click Preview to see the theme applied to your workbook.
- Click Save to accept the theme.
Specifying a Theme’s Fonts
To specify new theme fonts, you follow these steps:
- Select Page Layout, Themes, Fonts, Create New Theme Fonts. The Create New Theme Fonts dialog appears, as shown in Figure 5.15. Remember that a font theme contains a heading font and a body font.
Figure 5.15. A theme is composed of two fonts.

- Select a font from the Heading Font drop-down. If a custom font is used in your company’s logo, using it might be appropriate.
- Select a font from the Body Font drop-down. This should be a font that is easy to read. Avoid stylized fonts for body copy.
- Give the theme a name. It is okay to reuse the same name from the color theme.
- Click Save to accept the theme changes.
Reusing Another Theme’s Effects
There is not a dialog box to choose the effects associated with a theme. Other than editing the XML by hand, you are stuck using the effects from one of the built-in themes.
To select effects for a theme, from the Page Layout, you select Themes, Effects and choose one of the existing themes.
The Effects dropdown is initially vexing. There are only subtle clues about the effects used in the theme, as shown in Figure 5.16. Each effects icon consists of a circle, an arrow, and a rectangle. These shapes give you clues about the effects in the theme.
Figure 5.16. The Effects dropdown offers subtle clues about the effects in a theme.

When you insert a shape on a worksheet, there are six rows of Shape Styles available in the gallery on the Drawing Tools – Format ribbon. These styles range from simple (row 1) to moderate (row 4) to intense (row 6).
- The circle in the icon relates to simple shape styles.
- The arrow in the icon relates to moderate shape styles.
- The rectangle in the icon relates to intense shape styles.
Examine the circle in the upper-left of each theme icon. Aspect, Concourse, Currency, and Opulent use a double line for the simple shape styles. Civic uses a broken line.
The effects used on the arrow indicate the shape effects used for moderate shape effects. For example, Equity uses a vertical pattern of lines in moderate styles. Currency applies a slight gradient. Trek uses more of a shadow than Technic.
The rectangle indicates the effects applied to intense styles. It is barely perceptible, but there is a bit of a reflection under the rectangle in Deluxe, and a glow around the rectangle in Metro.
These effects apply to various shape styles. In Figure 5.17, a dozen pairs of rounded rectangles are shown with 12 different Theme Effects. The top shape in each pair uses a moderate shape style. The bottom shape in each pair uses an intense shape style. The 12 pairs are arranged in the same order as effects in the theme box—Office, Apex, Aspect, and Civic in the first two rows; Concourse, Currency, Deluxe, and Equity in the next two rows; and Flow, Foundry, Median, and Metro in the last two rows.
Figure 5.17. These shapes illustrate changes introduced by the Theme Effects dropdown.
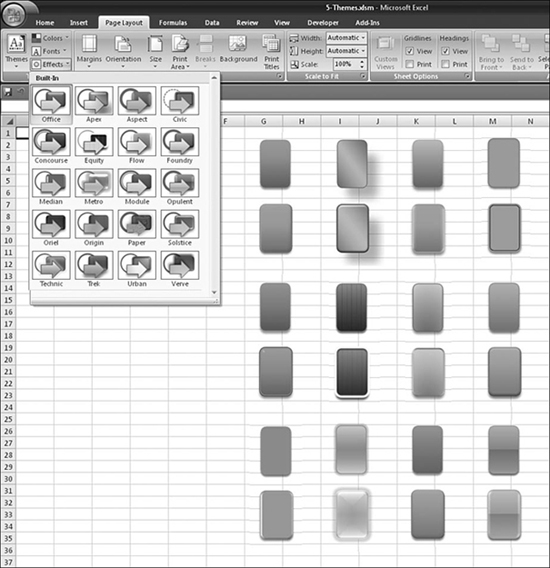
These real examples show that Apex offers a more pronounced shadow than the other themes. Equity is darker. Metro has more of a glow. (For a color version of this figure, see http://www.mrexcel.com/05fig17.jpg).
Note
Figure 5.17 is a composite of 12 screenshots put together in Photoshop. There is not a way to represent more than one theme in a single Excel workbook.
Saving a Custom Theme
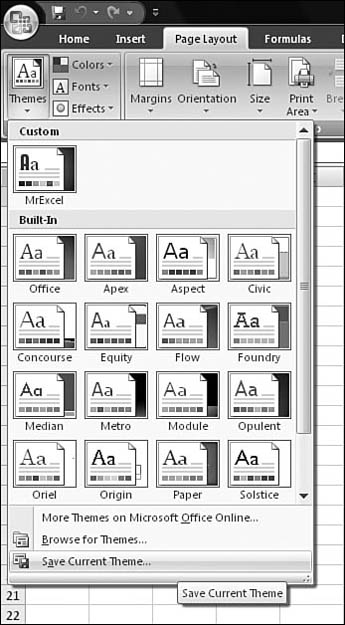
In order to reuse a theme, you must save it. From the Page Layout ribbon, you select Themes, Themes, Save Current Theme, as shown in Figure 5.18.
Figure 5.18. The option to save a theme is at the bottom of the Themes drop-down.
By default, themes are stored in the Document Themes folder. In Windows XP, this folder is in C:Documents and Settingsuser nameApplication DataMicrosoftTemplatesDocument Themes. In Windows Vista, the folder is in C:Usersuser nameAppDataRoamingMicrosoftTemplatesDocument Themes.
You need to give your theme a useful name and click Save.
Using a Theme on a New Document
When you open a new document on the same computer, the Custom theme is in the Themes drop-down on the Page Layout ribbon. You can easily use this theme on all future documents.
Sharing a Theme with Others
If you want to share a theme with others, you need to send them the .thmx file from the theme folder.
The people you share the theme with can either copy the .thmx file to their equivalent folder or save the .thmx file to their desktop and use the Browse for Themes option, by choosing Page Layout, Themes, Themes, Browse for Themes.