
Memory footprints are the signs and ways of using memory during runtime. From the point of game memory usage optimization, monitoring the memory footprint is very important:
- Checking log messages
- Checking heap updates
- Tracking memory allocation
- Checking overall memory usage
- Tracking memory leaks
Using log messages has been the most effective and immediate debugging technique. Message logs are very useful for tracking the program control flow and runtime object tracking.
The Dalvik message log is useful for tracking memory. Whenever garbage collection happens, the garbage collector can print the following information through Dalvik log messaging:
- Garbage collection reason: This info reveals the reason for triggering garbage collection. The reasons can be
GC_CONCURRENT,GC_FOR_MALLOC,GC_HPROF_DUMP_HEAP,GC_EXPLICIT, orGC_EXTERNAL_ALLOC. - Amount of memory freed: This section states the amount of memory freed by the garbage collector in KB.
- Current heap memory status: This shows the percentage of heap memory used and live objects memory/total heap.
- External memory status: There may be some operations that allocate memory externally. This section shows the allocated memory/garbage collection limit.
- Garbage collector pause time: Pause time is triggered twice, at the beginning of garbage collection and at its end. Normally, the pause time is higher in the case of a large heap.
The ART message log is also capable of showing or tracking memory footprints. However, it is not triggered unless explicitly requested.
If the garbage collector pause time exceeds 5 ms or the garbage collector takes more than 100 ms to execute, then garbage collector logs are printed. In the case of ART, the following information can be shown as logs:
- Garbage collection reason: In ART log messages, the developer can have
Concurrent,Alloc,Explicit,NativeAlloc,CollectorTransition,HomogeneousSpaceCompact,DisableMovingGc, orHeapTrimas the reason for collection. - Name of garbage collector: ART has few different garbage collectors that can be involved in a collection process. The name can be known by the field of the collection log. ART has these collectors: Concurrent Mark Sweep (CMS), Concurrent Partial Mark Sweep (CPMS), Concurrent Sticky Mark Sweep (CSMS), and Marksweep plus Semispace.
- Count of objects freed: This shows the total number of objects freed from memory by the garbage collector.
- Amount of memory freed: This shows the total amount of memory freed by the garbage collector.
- Count of large objects freed: This shows the number of objects freed from the large object scope. These objects are freed by the collector.
- Memory amount freed from large objects: This shows the amount of memory freed from the large object scope. This memory is freed by the collector.
- Current heap memory status: This is the same as the one for Dalvik logs—live objects count/total heap memory.
- GC pause time: In the ART pause time section, this is directly proportional to the number of object references modified by the running garbage collector. Unlike Dalvik, the ART CMS garbage collector has only one pause time during the end of the collection process.
The developer can check the heap usage per update. It gives a clear picture of the memory footprint. Heaps can be monitored with the help of several tools. There are plenty of device memory monitors available in the market. DDMS device monitor is one of them. It is a powerful tool that observes heap usage during the game's runtime.
The Android SDK comes with an inbuilt device monitor at <sdk>/tools/monitor.
The memory monitor in Android Studio is useful for Android Studio users. Monitors can interact with the Android application to watch heap update with each garbage collection. Through this, the Android developer can know about exact memory usage for each segment of an application.
Sometimes, developers switch on/off methods to check exact heap usage. Thus, it becomes easier to optimize it further.
This is helpful for memory optimization. Memory allocation can be monitored through an allocation tracker.
Memory allocation tracking is required after a certain stage of memory optimization. This helps identify each and every object's memory allocation. Often, many useless objects stay back in memory. The developer can identify these objects and remove them for greater memory optimization.
Memory allocation tracker is available with both Device Monitor in Android SDK and Allocation Tracker in Android Studio.
However, it's not necessary to remove all allocations from performance-critical code paths; yet, the allocation tracker can help developers identify important issues in code. For instance, some apps might create a new Paint object on every draw. Moving this object into a global member is a simple fix that helps improve performance:
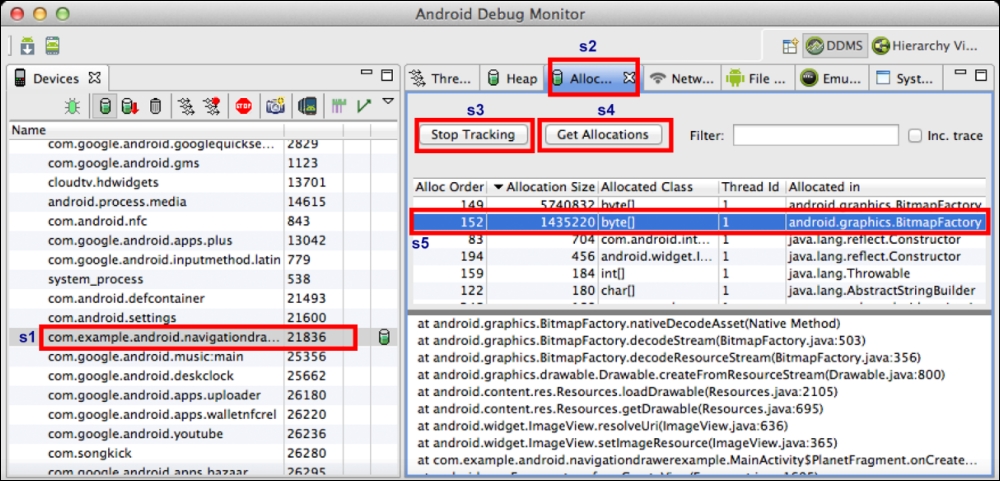
Let's have a quick look at the allocation information obtained:
- s1: This is the object package currently being tracked
- s2: This shows the Allocation tab is selected
- s3: This is used to start/stop tracking of the object
- s4: This updates the package allocation
- s5: This shows the allocation details
In game development, the number of objects in memory is immense, so it is very difficult to keep track of allocation and deallocation of objects manually. This monitoring tool helps find out the hidden spots that could have been easily ignored during the optimization process.
Overall memory usage of an Android game is distributed in different segments in RAM. This creates a general idea about application performance and memory security.
Basically, there are two types of allocation.
This is the dedicated memory portion used by the game during runtime. The Android operating system allocates this memory to the application. Private RAM is distributed in two segments:
- Clean RAM
- Dirty RAM
Private dirty RAM is the most expensive one as it can only be used by specific applications (in our case, it is an Android game).
This segment of RAM is used by multiple processes. It is basically shared memory. Any RAM pages that are unique to the application process directly contribute to its PSS, while pages that are shared with other processes contribute to the PSS value only in proportion to the amount of sharing.
Memory leakage is a serious threat to software development. So, it is absolute necessary to track memory leakage and resolve it. When a process allocates memory and loses the reference pointer, then it is impossible to free the memory within the process.
There are few debug tools that can do this job to track down memory leakage. However, there is another free and more effective solution. The developer can always monitor memory consumption at any given point of time. A game runs within an update loop. So, it is possible to track the memory peaks of different game cycles. If the peak keeps increasing, it means there are leaks in the allocation/deallocation of memory. Now, the developer can check the size of each object and hunt down the leakage. Another benefit of this process is finding unnecessary objects in memory alongside memory leakage.