6.8. what is a Natural Energy Source?
Fossil fuel energy follows a very different pathway, even though fossil fuel is also being used to generate electricity. Fossil fuel is also the most abundant, only second to biomass (including wood).
There are three major forms of fossil fuels: coal, oil, and natural gas. All three were formed many hundreds of millions of years ago before the time of the dinosaurs—hence the name fossil fuels. The age they were formed is called the Carboniferous Period. It was part of the Paleozoic Era. “Carboniferous” gets its name from carbon, the basic element in coal and other fossil fuels. The Carboniferous Period occurred from about 360 to 286 million years ago. At the time, the land was covered with swamps filled with huge trees, ferns and other large leafy plants. The water and seas were filled with algae—the green stuff that forms on a stagnant pool of water. Algae is actually millions of very small plants.
Some deposits of coal can be found during the time of the dinosaurs. For example, thin carbon layers can be found during the late Cretaceous Period (65 million years ago)—the time of Tyrannosaurus Rex. But the main deposits of fossil fuels are from the Carboniferous Period. As the trees and plants died, they sank to the bottom of the swamps of oceans. They formed layers of a spongy material called peat. Over many hundreds of years, the peat was covered by sand and clay and other minerals, which turned into a type of rock called sedimentary.
More and more rock piled on top of more rock, and it weighed more and more. It began to press down on the peat. The peat was squeezed and squeezed until the water came out of it andeventually, over millions of years, it turned into coal, oil or petroleum, and natural gas. Conventional theories suggest that coal is the least processed in nature while natural gas is the longest processed. Table 6.6 shows the heat of combustion for various fuels. Note that data on crude oil are not available as crude oil is not used directly. On the other hand, natural gas shows very high heat of reaction. Even though hydrogen has the highest heat of reaction, it is practically impossible to find hydrogen gas in its elemental form. Natural gas, on the other hand is the most abundant gas from underground, below the vadose zone.
Table 6.7 shows the constituents and their volume concentrations of the atmosphere. Table 6.8 shows the composition of earth's crust. Table 6.9 shows the general composition of humans. These numbers are significant for demonstrating that fossil fuel combustion is the best way to generate energy to be utilized by humans.
Natural gas can be found in a variety of different underground formations, including shale formations, sandstone beds, and coal seams. Just like oil is the second most available liquid, natural gas is the most available gas in the earth crust beyond the vadose zone. Traditionally, the gas available in the high permeability zone has been developed with conventional techniques. However, much more gas remains in reservoirs that are considered to be unconventional, mainly because they are not producible with conventional techniques. This natural gas is in fact cleaner than the conventional gas and has higher heating value. Figure 6.13 shows how the volume of natural gas increases exponentially when one moves away from conventional gas reserves. Similar trend is seen in oil reservoirs. However, oil from unconventional sources are increasingly more difficult to refine. Opposite trends exist for gas. For instance, cleanest and most readily combustible gas resides within gas hydrates (Picture 6.3).
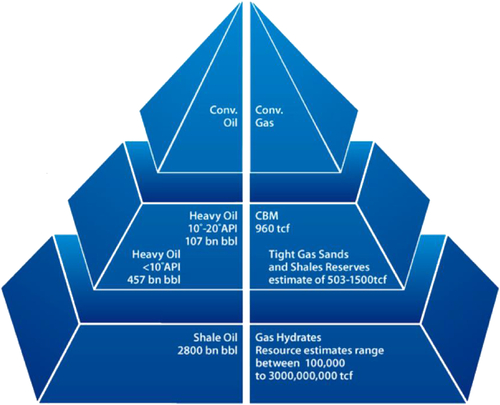
Figure 6.13 The amount of gas available in natural resources increases as one moves from conventional to unconventional resources.
Table 6.8
| Element | Percent by Volume |
| Oxygen | 46.60% |
| Silicon | 27.72% |
| Aluminum | 8.13% |
| Iron | 5.00% |
| Calcium | 3.63% |
| Sodium | 2.83% |
| Potassium | 2.59% |
| Magnesium | 2.09% |
| Titanium | 0.44% |
| Hydrogen | 0.14% |
| Phosphorus | 0.12% |
| Manganese | 0.10% |
| Fluorine | 0.08% |
| Barium | 340 ppm |
| Carbon | 0.03% |
| Strontium | 370 ppm |
| Sulfur | 0.05% |
| Zirconium | 190 ppm |
| Tungsten | 160 ppm |
| Vanadium | 0.01% |
| Chlorine | 0.05% |
| Rubidium | 0.03% |
| Chromium | 0.01% |
| Copper | 0.01% |
| Nitrogen | 0.005% |
| Nickel | Trace |
| Zinc | Trace |
Table 6.9
Elemental Composition of a Human Body
| Elements | Fraction (%) |
| Oxygen | 65% |
| Carbon | 18% |
| Hydrogen | 10% |
| Nitrogen | 3% |
| Calcium | 1.5% |
| Phosphorus | 1.0% |
| Potassium | 0.35% |
| Sulfur | 0.25% |
| Sodium | 0.15% |
| Magnesium | 0.05% |
| Copper, zinc, selenium, molybdenum, fluorine, chlorine, iodine, manganese, cobalt, iron | 0.70% |
| Lithium, strontium, aluminum, silicon, lead, vanadium, arsenic, bromine | Trace amounts |
Figure 6.14 shows the locations of unconventional gas around the world. Figure 6.15 shows coalbed methane and shale gas in Europe, whereas Figure 6.16 shows tight gas plays of the United States.
..................Content has been hidden....................
You can't read the all page of ebook, please click here login for view all page.