
Chapter 4
Future Potentials of Unconventional Gas
Challenges and Opportunities
Abstract
Conventional gas sources will not be able to satisfy the future energy demand and thus unconventional gas sources (tight gas, shale gas, and coalbed methane) are expected to be a major component of the energy outlook. In the long term, methane from gas hydrates will add to the unconventional production of natural gas. At present, gas hydrates are only a research theme and there is no existing project on production of natural gas from gas hydrates. In terms of technological development, only horizontal well and fracturing have been used to produce natural gas from unconventional reservoirs. While these technologies will continue to produce more natural gas from unconventional resources, more resources will be added to the “proven” reserve as well as newer technologies (or older technology from enhanced oil and gas recovery schemes) will determine the truly long-term future of unconventional gas.
Keywords
Enhanced gas recovery; Enhanced oil recovery; Fracking; High pressure air injection; Horizontal well; Thermal cracking4.1. Introduction
The United States has led the world in unconventional gas production. Natural gas demand in the United States is expected to increase from 25 Tcf/year currently to 30–34 Tcf/year by the year 2025. Conventional gas sources (sandstone reservoirs) will not be able to satisfy this demand and thus unconventional gas sources (tight gas, shale gas, and coalbed methane (CBM)) are expected to be a major component of this production. In the long term, methane from gas hydrates will add to the unconventional production of natural gas. At present, gas hydrates are only a research theme and there is no existing project on production of natural gas from gas hydrates. In terms of technological development, only horizontal well and fracturing have been used to produce natural gas from unconventional reservoirs. While these technologies will continue to produce more natural gas from unconventional resources, more resources will be added to the “proven” reserve as well as newer technologies (or older technology from enhanced oil and gas recovery schemes) will determine the truly long-term future of unconventional gas. This chapter discusses enhanced gas recovery (EGR) potential of unconventional gas and then presents the best way to increase recovery of unconventional gas. EGR has been a fleeting concept mainly because conventional gas reservoirs have very high recovery factor, thereby making EGR techniques redundant. In addition, the prevalent concept in the petroleum industry is that any enhanced recovery scheme requires large investment, which cannot be justified considering low gas prices. This scenario changes for unconventional reservoirs that has much bigger prize embedded in large formations and have the potential of multifold increase in recovery factors over conventional techniques of horizontal drilling and fracking.
4.2. Lessons Learnt from Enhanced Oil Recovery
This section is an overview of enhanced oil recovery (EOR) schemes. Even though the focus is oil, the discussion helps the readership identify technologies that are proper for gas recovery from unconventional sources.
Primary recovery is the oil recovery by natural drive mechanisms. Such natural drives may be through solution gas expansion, water drive, gas-cap drive, or simply gravity drainage. Secondary recovery is known to be the oil recovery technique in which gas or water is injected in order to maintain the reservoir pressure. Tertiary recovery is any oil recovery scheme, conventionally applied after secondary recovery. However, for over two decades, there is a tendency to use the term enhanced oil recovery in order to define a wide range of recovery processes. The EOR is an oil recovery scheme that uses the injection of fluids, not normally present in the reservoir. For instance, chemical injection, steam injection, in situ combustion (ISC), or even microbial enhanced recovery will be considered as EOR. This definition, while encompasses many recovery schemes beyond the scope of tertiary recovery (recovery scheme that follows secondary recovery), does not include techniques such as electromagnetic heating even when this could be an effective technique for increasing oil production from a reservoir. However, recent publications acknowledge electromagnetic heating as an EOR process. A proper definition of EOR should, therefore, be any oil recovery technique that improves oil recovery from a reservoir beyond primary recovery. While fluid injection may be required for some techniques, energy dissipation may be sufficient in some cases. This definition may seem to be too broad because it does not exclude waterflood or pressure maintenance gas injection from the definition of EOR. In fact, many waterflood and gas injection schemes are indeed displacement-type recovery processes and should be called an EOR scheme. A purely pressure maintenance scheme is usually well defined and no confusion as to its distinction from EOR schemes exists.
The word “EOR” fell out of grace shortly after tax incentive for EOR schemes were repealed in 1980s. This saw the sudden drop of EOR projects in the United States that peaked in 1986.
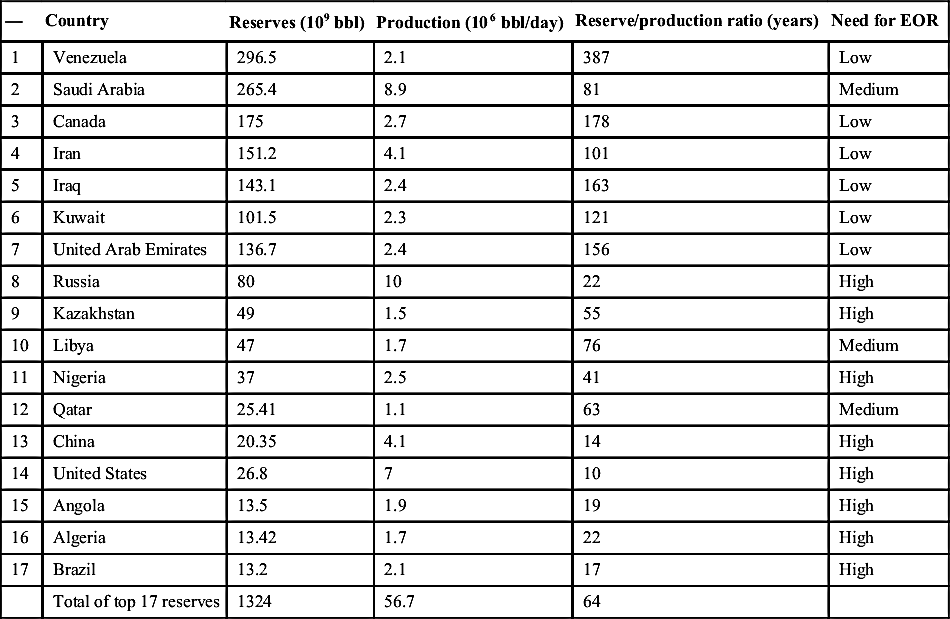
Table 4.1 shows total oil reserve as well as reserve/production ratio of top oil producing countries. Each country is marked for its need for EOR. Note that the need does not imply suitability nor does it mean that other countries would not benefit from an EOR scheme.
Table 4.1
Summary of Proven Reserve Data as of 2012
| — | Country | Reserves (109 bbl) | Production (106 bbl/day) | Reserve/production ratio (years) | Need for EOR |
| 1 | Venezuela | 296.5 | 2.1 | 387 | Low |
| 2 | Saudi Arabia | 265.4 | 8.9 | 81 | Medium |
| 3 | Canada | 175 | 2.7 | 178 | Low |
| 4 | Iran | 151.2 | 4.1 | 101 | Low |
| 5 | Iraq | 143.1 | 2.4 | 163 | Low |
| 6 | Kuwait | 101.5 | 2.3 | 121 | Low |
| 7 | United Arab Emirates | 136.7 | 2.4 | 156 | Low |
| 8 | Russia | 80 | 10 | 22 | High |
| 9 | Kazakhstan | 49 | 1.5 | 55 | High |
| 10 | Libya | 47 | 1.7 | 76 | Medium |
| 11 | Nigeria | 37 | 2.5 | 41 | High |
| 12 | Qatar | 25.41 | 1.1 | 63 | Medium |
| 13 | China | 20.35 | 4.1 | 14 | High |
| 14 | United States | 26.8 | 7 | 10 | High |
| 15 | Angola | 13.5 | 1.9 | 19 | High |
| 16 | Algeria | 13.42 | 1.7 | 22 | High |
| 17 | Brazil | 13.2 | 2.1 | 17 | High |
| Total of top 17 reserves | 1324 | 56.7 | 64 |
More recently, environmental concerns have become part and parcel of EOR activities. In part this is fueled by renewed awareness of the environmental impact of unsustainable engineering practices, even though it is perceived as a greenhouse gas emission problem.
Energy production and use are considered major causes of greenhouse gas emissions. The emission of greenhouse gases, particularly CO2, is of great concern today. Even though CO2 is considered one of the major greenhouse gases, production of natural CO2 is essential for maintaining life on earth. Note that all CO2 is not the same and plants do not accept all types of CO2 for photosynthesis. There is a clear difference between old CO2 from fossil fuels and new CO2 produced from renewable biofuels (Dietze, 1997; Islam et al., 2010). The CO2 generated from burning fossil fuel is an old and contaminated one. Because various toxic chemicals and catalysts are used for oil and natural gas refining/processing, the danger of generating CO2 with higher isotopes cannot be ignored. Hence, it is clear that CO2 itself is not a culprit for global warming, but the industrial CO2 that is contaminated with catalysts and chemicals likely becomes heavier with higher isotopes and plants cannot accept this CO2. Plants always accept the lighter portion of CO2 from the atmosphere (Bice, 2001). Thus, CO2 has to be distinguished between natural and industrial CO2, based on the source from which it is emitted and the pathway that the fuel follows from the source to combustion. Islam et al. (2010) showed that even though the total CO2 is increasing in the atmosphere, the natural CO2 has been decreasing since the industrial revolution. They further argued that industrial CO2 is responsible for global warming. Thus, generalizing CO2 as a precursor for global warming is an absurd concept and is not valid. See discussion below for more details.
In absence of solidly founded scientific investigations, world governments have at least agreed that the greenhouse emission is a concern and have been under pressure to ratify Kyoto Agreement. Even though the Kyoto protocol as well as Copenhagen agreement (or lack of it) have not been implemented, they managed to extract more funding for greenhouse mitigation projects than EOR projects. For instance, in 2011, the petroleum sector in the United States invested US$ 71.1 billion, whereas US$ 73.7 billion came from the private sector other than the petroleum industry. The rest (23%) that amounts to US$ 43.4 billion came from the government that tagged the amount to greenhouse gas mitigation projects. It turns out the 39% from the “other industry” also invested in these “environmental” projects.
Most recent U.S. Department of Energy (DoE)/Energy Information Association (EIA) report (2013) shows how climate change concerns and specifically greenhouse gas emissions have been instrumental in determining future energy outlook and regulatory policies. Regulators and investment companies have been pushing energy companies to invest in technologies that are less greenhouse gas intensive. Federal government grants are often linked to environmental aspects of petroleum engineering. Even within the petroleum industry, the focus has shifted toward mitigation of greenhouse gases. This provides a unique opportunity for coupling EOR projects that can bring in double dividends, namely environmental integrity and financial boon.
Figure 4.1 shows CO2 emissions per sector. On average, energy-related CO2 emissions in the reference case decline by 0.2% per year from 2005 to 2040, as compared with an average increase of 0.9% per year from 1980 to 2005. Reasons for the decline include: an expected slow and extended recovery from the recession of 2007–2009; growing use of renewable technologies and fuels; automobile efficiency improvements; slower growth in electricity demand; and more use of natural gas, which is less carbon intensive than other fossil fuels. In the reference case, energy-related CO2 emissions in 2020 are 9.1% below their 2005 level. Energy-related CO2 emissions total 5691 million metric tons in 2040, or 308 million metric tons (5.1%) below their 2005 level.
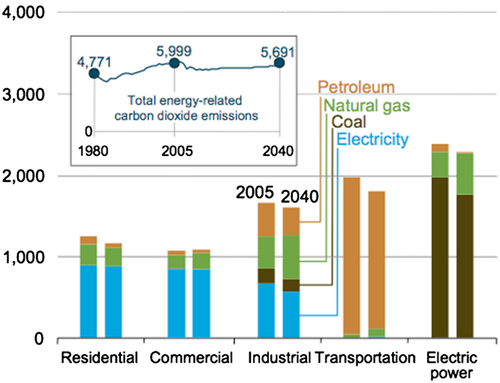
Figure 4.1 Past performance and future projections of greenhouse gases by sector (million metric tons).
As indicated earlier, the reserve/production ratio of oil is declining around the world, some hitting critical need for EOR. The exception is the middle eastern region that continues to produce under par, as evident from Figure 4.2. World proved oil reserves at the end of 2012 reached 1668.9 billion bbl. This is sufficient to meet 60 years of global production, without tapping into additional sources. Note that additional sources include heavier or nonconventional resources and new discoveries. Global proved reserves have increased by 26%, or nearly 350 billion bbl, over the past decade. This trend is likely to continue.
Of significance is the fact that there is much more nonconventional petroleum reserve than the convention “proven” reserve. This point is made in Figure 4.3. Even though it is generally assumed that more abundant resources are “dirtier,” hence in need of processing that can render the resource economically unattractive, sustainable recovery techniques can be developed that are more efficient for these resources and also economically attractive and environmentally appealing (Islam et al., 2010). In addition, natural gas quality is little affected by the environment. For instance, gas hydrate that represents the most abundant source of natural gas is actually far cleaner than less abundant resources.
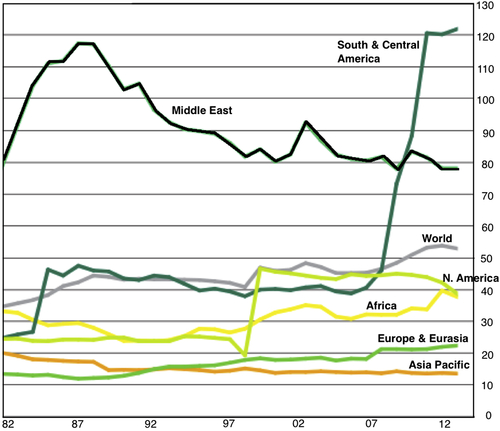
Figure 4.2 Reserve production ratio by regions. Redrawn from BP Outlook, 2013.
It has been shown in previous chapter that the need for higher price and/or increased technological challenge is fictitious and is erased if scientific energy pricing along with sustainable technology are used. Current investment strategy has fueled this misconception.
In terms of oil industry, the main focus has been in nonconventional petroleum extraction. For instance, Figure 4.4 shows major investments in oil sands in Canada. In 2013, 7299 Tcf of shale gas 345 billion bbl of shale/tight oil has been added. In the United States, the focus has been on unconventional oil and gas. A government report published in summer of 2013 revealed “U.S. domestic crude oil production exceeded imports last week for the first time in 16 years. Output was 32,000 bbl a day higher than imports in the seven days ended May 31, according to weekly data today from the Energy Information Administration, the Energy Department's statistical arm” (Bloomberg, 2013). Production had been lower than international purchases since January 1997. This surge in oil is attributed to the influx of horizontal drilling and hydraulic fracturing (popularly known as “fracking”). For over 20 years, horizontal drilling has been the most common drilling technique in the United States. However, the unlocking of tight formations, including shale, has become the most important reason for the surge. Large schemes of fracking have been implemented in the states of North Dakota, Oklahoma, and Texas. According to the EIA data, the surge in oil and gas production helped the United States meet 88% of its own energy needs in February, the highest monthly rate since April 1986. Crude inventories climbed to the highest level in 82 years in the week ended May 24, 2013.
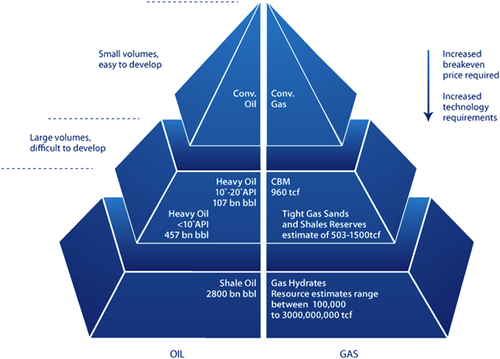
Figure 4.3 There is a lot more oil and gas reserve than the “proven” reserve.
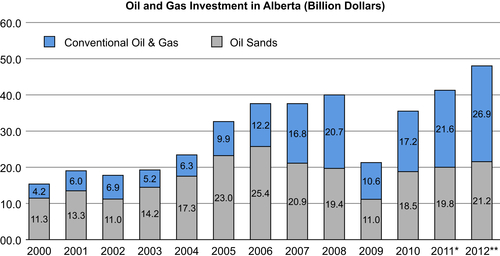
Figure 4.4 Major investment in oil sands in Canada. ∗2011 data are preliminary actuals, ∗∗2012 data are intentions. Statistics Canada, public and private investment.
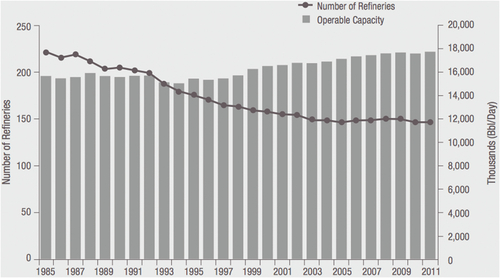
Figure 4.5 Last few decades have seen an increase in efficiency of refineries.
This has been accentuated with an increasing efficiency in refining. Figure 4.5 shows how refining capacity has grown despite declining number of refineries.
4.2.1. Need for EOR
There are primarily three reasons given for increasing oil recovery:
1. Primary recovery techniques leave behind more than half of the original oil in place. This is a tremendous reserve to forego.
2. Increased drilling activities do not increase new discoveries of petroleum reserve. While this has been replaced with new technological opportunities (e.g., fracking technology creating oil and gas reserve in unconventional reserve), the argument is made to justify EOR.
3. Environmental concern of CO2 emission. Ever since signing of Kyoto Agreement, US government has led the movement of CO2 sequestration, thereby increasing oil recovery.
From the beginning of oil recovery, scientists have been puzzled by the huge amount of oil leftover following primary recovery. Naturally occurring drive mechanisms recover anything from 0% to 70% of the oil in place. In most cases, recovery declines rapidly as viscosity of oil increases. For instance, primary recovery is less than 5% when oil viscosity exceeds 100,000 cp. This is not to say that heavy oil recovery was the primary incentive for EOR, even though most EOR projects in the United States, Canada, and Venezuela involve heavy oil recovery. The primary incentive for EOR is the fact that a typical light oil reservoir would have more than 50% of the original oil in place leftover, while a small investment can recover over 70% of the oil in place. For heavy oil, the room for improvement is much higher. Even though theoretically there is much more recovery potential of heavier energy sources all the way up to biomass (Figure 4.6), the current recovery techniques are geared toward light oil. This figure shows that natural gas is the most efficient with the most environmental integrity. This argument has been sharpened in the previous chapter that breaks down natural gas further into various forms of unconventional reservoirs. Within petroleum itself, the “proven reserve” is miniscule compared to the overall potential, as depicted in Figure 4.7.
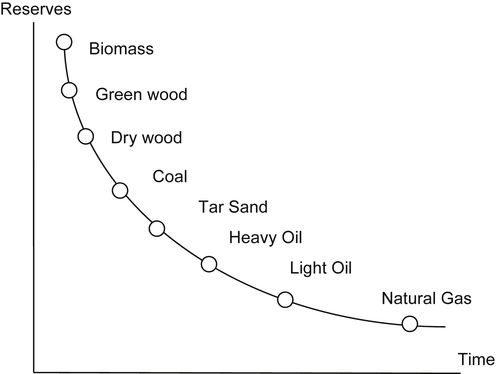
Figure 4.6 As natural processing time increases so does reserve of natural resources. From Chhetri and Islam, 2008.
Of course, if one includes solar energy that would be the highest reserve possible. Because all energy source utilization techniques are equipped with processing light oil as a reference, the primary focus of EOR has been light oil. In early 2000, US tertiary recovery was estimated to be 12% (Figure 4.8). This number has held steady until the huge surge in unconventional recovery of oil and gas that increased the oil and gas production by 40% in 2013. It is difficult to characterize unconventional recovery under a known category of oil and gas production. In any event, the knowledge of EOR is invaluable for developing any form of petroleum production scheme.
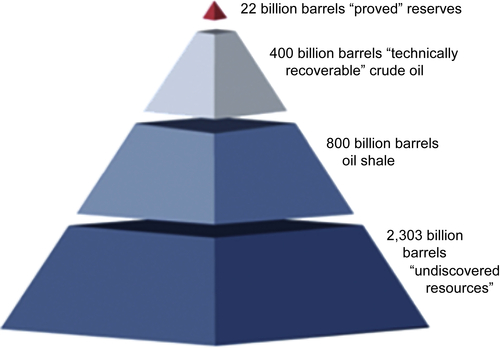
Figure 4.7 “Proven” reserve is miniscule compared to total potential of oil.
One of the most important criteria for selection of an EOR scheme is the reserve/production ratio. This ratio is low for the United States. Consequently, the United States has been the leader in implementing EOR techniques. Of the total recoverable oil in the United States, 12% lends itself to EOR (Figure 4.8). Further clarification must be made about the term “recoverable” oil. Some of the OPEC countries calculate this number by multiplying total petroleum in place with the recovery factor, which has little scientific merit. Other countries, than OPEC, calculate initial oil in place by dividing “recoverable reserve” by the recovery factor, which is often low and without scientific justification. A recent survey shows little is known about how numbers such as “recovery factor,” “recoverable reserve,” etc., come to exist. However, it is commonly accepted that the “recoverable reserve” that is published worldwide and is used as the basis for determining OPEC quota for production is the most accurate starting point. This itself creates confusion in the scientific community that is vastly unfamiliar with how those “recoverable reserve” numbers are calculated. As for the pie chart in Figure 4.8, it concerns the contribution of various recovery techniques in the United States. It turns out that the recovery factor in the United States is much higher. For instance, many miscible floods as well as steamfloods have recovery factors in the vicinity of 85% and 70%, respectively. In order to avoid confusion as to what this pie chart should represent in countries that have yet to start an EOR scheme, it is best to determine primary recovery potential and expect 30% of that oil during EOR schemes for light oil reservoirs. For heavy oil reservoirs, this percentage of recovery is much higher, mainly because the primary oil recovery factor is very low. In addition, many heavy oil formations do not “see” primary recovery as is the case for most heavy oil reservoirs in the United States. Some Canadian heavy oil reservoirs do produce in primary mode but with an extremely low recovery factor (less than 10% of initial oil in place).

Figure 4.8 Until 2012, tertiary recovery in the United States is estimated to be 12% of recoverable oil in place.
With regards to EOR technology development and implementation, the United States has been the world leader in implementing EOR. Figure 4.9 shows that the United States is ahead both in time of implementation and magnitude of EOR recovery in the world scale. This trend continues today despite the new found domestic resources in unconventional oil and gas and shale oil megaproject of Canada. Such leadership emerges from the US superiority in related areas of new drilling and well technologies, intelligent reservoir management and control, advanced reservoir monitoring techniques, and the application of different enhancements of primary and secondary recovery processes. However, the present paper presents a comprehensive review of EOR status and opportunities to increase oil recoveries and final recovery factors in reservoirs ranging from extra-heavy oil to gas condensate.
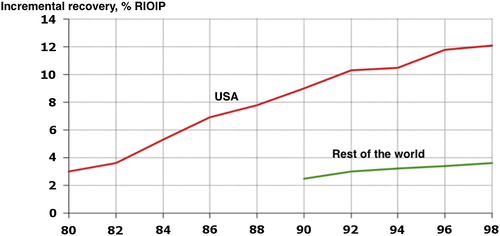
Figure 4.9 Growth of EOR in the United States as compared to the rest of the world.
It is well known that EOR projects have been strongly influenced by economics and crude oil prices. The initiation of EOR projects depends on the preparedness and willingness of investors to manage EOR risk and economic exposure and the availability of more attractive investment options. For an economic scheme to be successful in the long term, the technology cannot be expensive beyond the rate of return. In addition, the incremental recovery has to be substantially more than recovery with status quo. In this regard, the recovery/reserve ratio is important and is the most important criterion for implementation of EOR. The following Table shows the ratio of reserve over production rate. When recovery potential is estimated, the actual recovery with EOR can be calculated. These numbers are listed in Table 4.2. It is to be noted that sustainable EOR is the most economic and environmentally appealing option. Unless such scheme is implemented, infill drilling is the most economic scheme. This is especially true for reservoirs with high reserve/production ratios.
It is difficult to comment on the validity of the “reserve” numbers. A recent survey shows that there is no standard for this reserve or the definition of “proven” reserve is so varied and subjective that there is a need for a comprehensive study of this subject. It seems clear that politics plays a significant role in claiming “proven reserve.” While the developing countries in general and OPEC countries in particular are cited for politicizing the reserve numbers, history tells us there is a systematic lack of transparency in both numbers and the process involved in determining these numbers. Resolution of this problem is beyond the scope of this document.
Table 4.2
Reserve/Recovery Ratio for Different Countries
| Rank | Country | Reserves (109 bbl) | Reserve/production ratio (years) | EOR reserve (109 bbl) | EOR suitability with existing technology | EOR suitability with sustainable technology |
| 1 | Venezuela | 296.5 | 387 | 44.5 | Low | High |
| 2 | Saudi Arabia | 265.4 | 81 | 39.8 | Medium | High |
| 3 | Canada | 175 | 178 | 26.25 | Low | Medium |
| 4 | Iran | 151.2 | 101 | 22.7 | Low | Medium |
| 5 | Iraq | 143.1 | 163 | 21.5 | Low | Medium |
| 6 | Kuwait | 101.5 | 121 | 15.2 | Low | Medium |
| 7 | United Arab Emirates | 136.7 | 156 | 20.5 | Low | Medium |
| 8 | Russia | 80 | 22 | 12 | High | High |
| 9 | Kazakhstan | 49 | 55 | 7.35 | High | High |
| 10 | Libya | 47 | 76 | 7.0 | Medium | High |
| 11 | Nigeria | 37 | 41 | 5.5 | High | Medium |
| 12 | Qatar | 25.41 | 63 | 3.8 | Medium | Medium |
| 13 | China | 20.35 | 14 | 3.1 | High | High |
| 14 | United States | 26.8 | 10 | 4.0 | High | High |
| 15 | Angola | 13.5 | 19 | 2.0 | High | High |
| 16 | Algeria | 13.42 | 22 | 2.0 | High | High |
| 17 | Brazil | 13.2 | 17 | 2.0 | High | High |
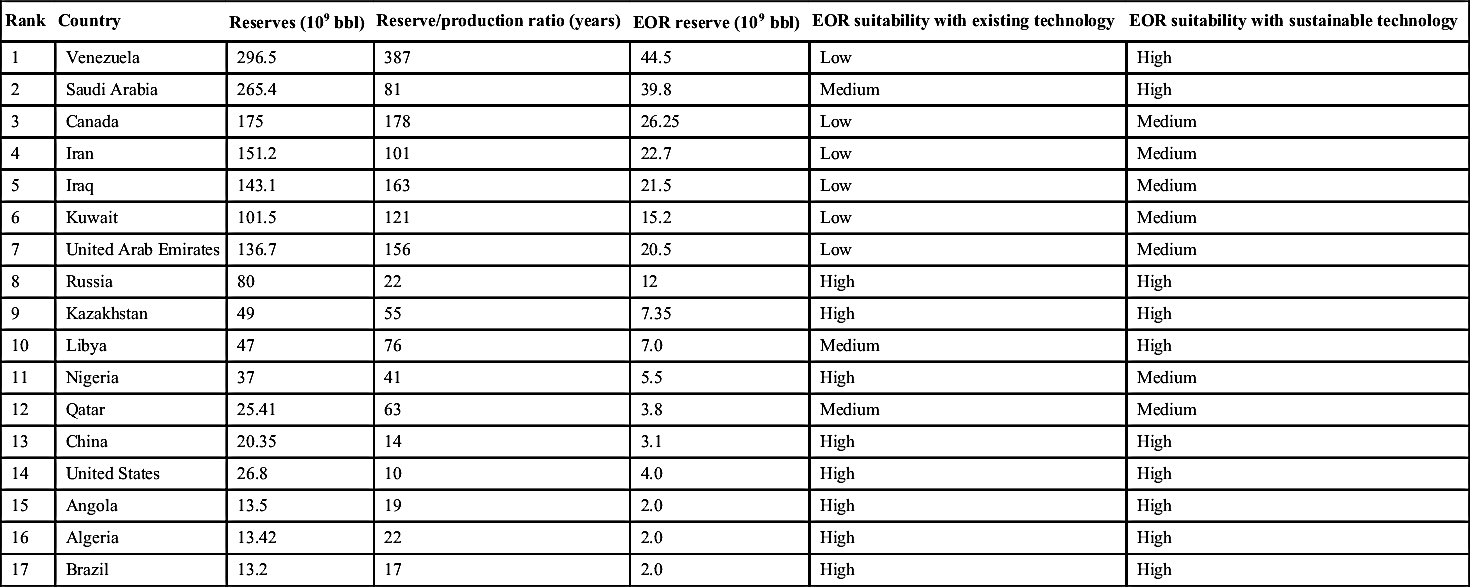
The need for EOR comes from the declining nature of worldwide reserve. Practically all countries have reached peak recovery rate as evidenced from Figure 4.10. This is the case despite the fact that new discoveries continue to grow. This is not to subscribe to the theory of peak oil because this graph does not consider increase in reserve due to the improvement of recovery technologies and the addition of unconventional oil and gas. This unconventional reserve is the principal reason that the United States has seen some 40% increase in domestic oil and gas recovery in the year 2013. Figure 4.11 shows how US reserve in oil and gas have progressively declined since 1970 only to pick up in 2011 onward.
There is a scientific group that believes that the above graph is misleading. As can be seen in Table 4.2, recovery alone cannot be an evidence of declining reserve because the recovery/reserve ratio varies largely among different countries. Figure 4.12 lends credibility to this statement.
Figure 4.12 also shows how countries with the exception of Venezuela have added no new reserve in the last decade. Despite this, there have been claims that major OPEC countries have inflated their reserves in order to gain more share in the competitive world market. This scenario is a pessimistic one because other countries do not actively look for or necessarily declare new reserves or reserves that have become “recoverable” because of technological improvements. The most remarkable case here is Saudi Arabia. World's 25% of recoverable reserve is in Saudi Arabia and until now the entire recovery process is through primary. Because the recovery/reserve ratio is still fairly high, EOR suitability of Saudi fields is a question mark. While it is considered as low risk to develop Saudi reservoirs for secondary recovery because of the low-cost of implementation of waterflood schemes, the benefit of implementing suitable EOR schemes directly after primary remain very high, at least in theory. Also, it is of importance to note that Saudi Arabia has significant amount of tar and other heavy oil deposits that are ignored in their reserve estimates. However, considering latest technological breakthroughs in tar sand and heavy oils, due to mega projects in Canada, Saudi Arabian heavy oil reserves, every well, can become very prominent in the world scale. Developments in the next most important case is that of Venezuela. Venezuela has the highest reserve/production ratio in the world. With EOR implementations, it has the capacity to double the daily output or total recoverable reserve.
Figure 4.10 Recovery rates decline around the world. Picture from http://en.wikipedia.org/wiki/Hubbert_peak_theory.
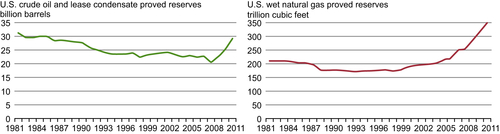
Figure 4.11 Declared reserve for various countries.
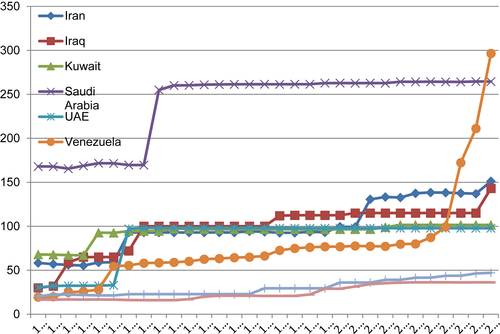
Figure 4.12 USA reserve variation in recent history. U.S. Energy Information Administration, Form EIA-23, Annual Survey of Domestic Reserves.
In the United States, total oil reserve has been declining since 1970 only to peak up in 2011. Wet natural gas reserve, on the other hand has been declining since 1981 but started to increase shortly after 1999. Figure 4.11 shows the US reserve as a function of time. The decline in reserve was reversed shortly after the 2008 financial crisis. Such rise in reserve is attributed to horizontal drilling and hydraulic fracturing in shale and other “tight” (very low permeability) formations. Because the oil price increased sharply during that period, more drilling was performed. This added to the proven reserve of the United States. US proven reserves of natural gas began growing sharply in the mid-2000s as operators adopted expanded horizontal drilling programs and applied new hydraulic fracturing techniques in shale formations. Starting with 2009, similar horizontal drilling programs were applied in several of the nation's tight oil formations—reserves additions from tight oil plays have reversed the long-term trend of generally declining proved US oil and lease condensate reserves (Figure 4.11). Proven reserves of crude oil and lease condensate increased in each of the five largest crude oil and lease condensate areas (Texas, the Gulf of Mexico federal offshore, Alaska, California, and North Dakota) in 2011. Of these, Texas had the largest increase by a large margin, about 1.8 billion bbl (46% of the net increase), resulting mostly from ongoing development in the Permian and Western Gulf Basins in the western and south-central portions of the state. North Dakota reported the second largest increase, 771 million bbl (20% of the net increase), driven by development activity in the Williston Basin. Collectively, North Dakota and Texas accounted for two-thirds of the net increase in total US proven oil reserves in 2011.
Proven wet natural gas reserves increased in each of the five largest natural gas producing states (Texas, Wyoming, Louisiana, Oklahoma, and Pennsylvania) in 2011. Pennsylvania's proven natural gas reserves, which more than doubled in 2010, rose an additional 90% in 2011, contributing 41% of the overall US increase. Combined, Texas and Pennsylvania added 73% of the net increase in US proven wet natural gas reserves. Expanding shale gas developments in these and other areas, particularly the Pennsylvania and West Virginia portions of the Marcellus formation in the Appalachian Basin, drove overall increases.
In terms of technical recoverability, both oil and gas reserves changed over the last decade. Figure 4.13 shows how technical recoverability has changed for both oil and gas reserves in the United States. Even with reduced aggressive research, technological developments in various aspects of petroleum engineering made it possible to upgrade the reserve estimates (Figure 4.13). This decline has been accompanied with increasing sulfur content of US crude. Figure 4.14 shows general trends in sulfur content of crude oil in USA.
Figure 4.15 shows American Petroleum Institute (API) gravity decline in US crude oil. Together Figures 4.14 and 4.15 show that the overall quality of US crude oil is declining. Figure 4.16 shows both API gravity and sulfur content of crude oil from around the world. Light and sweet crude oil is the most desirable. However, any change of the quality of the crude implies both economic and technological drain on the crude oil. Light and sweet grades are desirable because they can be processed with far less sophisticated and energy-intensive processes/refineries. The figure shows selected crude types from around the world with their corresponding sulfur content and density characteristics. One particular advantage of certain EOR techniques is the in situ upgrading of in situ oil. While no data is available on the quality of oil recovered with EOR as compared to the same without EOR, it is reasonable to assume that in situ upgrading would improve the quality of produced oil.
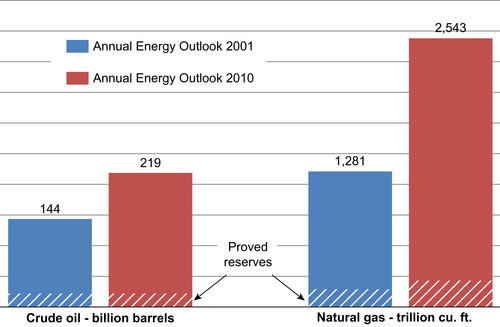
Figure 4.13 Technically recoverable oil and gas reserve in the United States. Energy Information Administration, based on 1999 and 2008 USGS assessments.
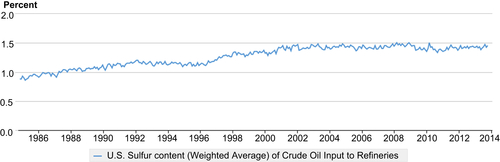
Figure 4.14 Sulfur content of the US crude over last few decades. U.S. Energy Information Administration.
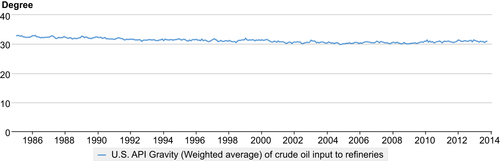
Figure 4.15 Declining API gravity of US crude oil. U.S. Energy Information Administration.
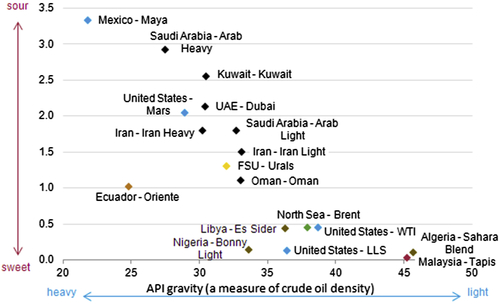
Figure 4.16 Worldwide crude oil quality. U.S. Energy Information Administration, based on Energy Intelligence Group–International Crude Oil Market.
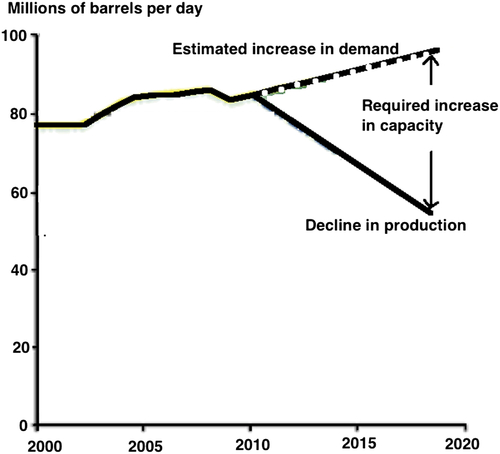
Figure 4.17 The need for EOR is evident in production and oil quality decline. Redrawn from Total.
The selected crude oils in the Figure 4.16 show the “sweetness” of various crude oils from around the world. These grades were selected for the recurrent and recently updated EIA report, “The Availability and Price of Petroleum and Petroleum Products Produced in Countries other than Iran.”
Figure 4.17 demonstrates the need for EOR. EOR involves making up for the loss of natural production cycle in order to meet the growing need of petroleum. However, for reservoirs with high reserve/production ratio, it is most cost-effective to infill drill. By carefully selecting infill drilling sites, the recovery factor can be increased even with primary production mode. For reservoirs that have seen significant rise in water cut during primary production, one should consider local improvement of mobility ratio by adding chemicals, such as polymer. However, increasing EOR performance with polymer is not recommended because polymer slugs do not travel in the reservoir beyond a few meters. The economics of EOR changes drastically if waste gas, produced gas or locally available gas, is used for EOR injection. Figure 4.18 presents a qualitative comparison among various modes of EOR. This figure that is modified from Zatzman and Islam (2007) shows how local fluid injection gives higher return in investment than conventional turn key projects, even though the return is lower at early stages of EOR. Using local fluid requires more investment in infrastructure than turn key projects but the investment pays off quickly and much higher return is posted at later stages. Local fluids may be produced hydrocarbon gas, locally available CO2, or other gas/fluid available in and around the reservoir. Waste gas, on the other hand, shows higher return throughout the duration of the project. Waste gas may include produced hydrocarbon gas that is normally flared, flue gas, sour gas, or any others that are considered to be liability to the producer.
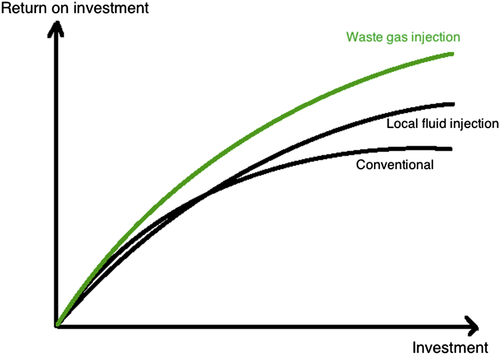
Figure 4.18 For the same investment, return is much different depending on type of fluid injected.
Figure 4.19 shows drilling activities in the United States over the last decade. This represents enhanced level of drilling throughout to match with the production boost during the same period. Note that the reserve/recovery ratio in the United States is quite low. Such intense drilling activities would represent far greater output in high ratio reservoirs. As stated earlier, infill drilling can increase both production rate and recoverable reserve for cases for which reserve/recovery ratio is low, as is in most OPEC countries.
4.2.2. State of the Art of EOR
Most EOR techniques are based on oil viscosity reduction and/or improvement of mobility ratio by increasing the displacement phase viscosity or by reducing oil viscosity and/or the interfacial tension (IFT) between injected fluid and oil. They can be categorized into two broad types: thermal and chemical recovery processes. This follows the natural cleaning technique of hot water wash with soap. It turns out the most potent cleaning agents of petroleum (second most abundant fluid) in nature are (1) Water (most abundant fluid), (2) Clayey material (most abundant solid material on earth), (3) Wood ash (solid products of oxidation of organic products), (4) Carbon dioxide (gaseous product of oxidation of organic products). It turns out that organic products are the second most abundant solid on earth and oxygen is the most abundant gas. Hot water naturally offers the most effective cleaning product as long as the heating is done with the most abundant energy source, viz. solar energy. Finally, one should note heating through combustion of organic energy source (e.g., petroleum, wood) is the second most efficient heating mechanism.
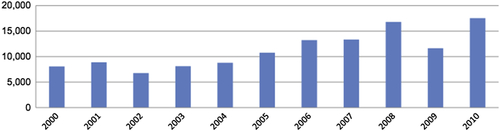
Figure 4.19 Drilling activities in the United States for various years.
Even though thermal recovery would include several methods in addition to steamflooding, steamflooding remains by far the most widely successful thermal EOR technique. Recently, it has been realized that mobility control can be realized by using surfactant with steam when steam/foam is generated. Ever since this realization, most emerging technologies in steamflooding involve some kind of surfactant application. EOR in light oil reservoirs have mainly focused on surfactant and/or polymer injection. Hundreds of patents have been issued on different forms of surfactant and polymer injection (in form of surfactant-water flood, micellar flood, surfactant/polymer enhanced waterflooding, etc.). Even though the chemical EOR has been recently marked as too expensive ever since the drop in oil prices in 1982, surfactants continue to play an important role in virtually all forms of successful EOR, be it in form of foam (mobility control in gas injection), steam/foam (mobility control in steamflooding), micellar, alkaline/polymer flooding or others.
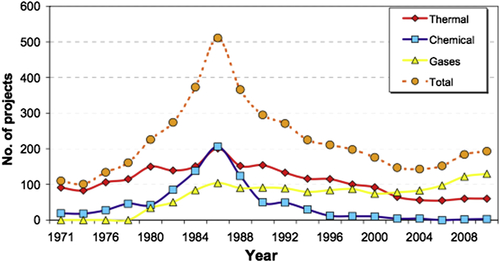
Figure 4.20 EOR projects over the year. From Alvarado and Manrique (2010).
Figure 4.20 shows the growth of different EOR schemes in last 40 years. This figure draws a particularly grim picture of the contribution of chemical flooding schemes. One must realize that Figures 4.20 and 4.21 do not consider the chemical applications in thermal and other EOR schemes and the scenario would be likely to change if they were considered.
Recent reports show that the contribution of EOR in total oil production has increased steadily throughout last two decades, despite fluctuating oil prices (Figure 4.20). Also, the number of EOR projects has steadily declined since the peak in 1986. This shows more efficiency of the EOR projects, indicating a trend that efficiency is the focus of the future EOR schemes. This trend is likely to continue even if the oil price continues to rise. Oil industries seem to be convinced that they can no longer afford to experiment with EOR schemes that do not show immediate improvement in oil production.
In using the United States as a reference, one must be cautious about the context in the United States. In United States, tax benefits for EOR projects were repealed in mid-1980s during Reagan era. This followed the sudden decline of the number of projects that were declared as “EOR.” In absence of tax breaks, there was no benefit of declaring a project as EOR. Of particular consequence was the “chemical/polymer” processes. There has been nil contribution of these techniques over the last two decades. With the exception of China, no other country developed any commercial EOR project using chemical methods. There have been several pilot tests involving chemical methods in the North Sea, but the results have been dismal. During the slump period, the production continued to rise, albeit with a small slope. The rise subsided after 2000. Note that this is the year oil price was unusually low. The original prediction was $200/bblin 2000. Instead, it was 10 times that number. In that decade, oil price was so low it was hard to justify investments in aggressive EOR techniques. The notion of sustainable EOR that gives one multiple dividend and is environmentally appealing was only a theoretical concept at that time. During that period recoveries with gas, thermal, and carbon dioxide schemes started to decline keeping pace with decreasing number of EOR projects. The number of thermal projects decreased because main fields in California began to reach maturity and the use of expensive mobility control agents with thermal EOR did not bear fruit. While this is theoretically demonstratable, the petroleum industry had to experiment with it before shutting down many thermal projects. For the same reason chemical EOR practically disappeared. By contrast, carbon dioxide projects continued to be in operation and after 2004, the number actually increased. Even though the number of projects with “other gases” was also increased, CO2 projects showed marked increase in oil recovery. In fact, CO2 projects continued to increase with the new incentive related to green house gas emission, as discussed in earlier sections. Since 2002, EOR gas injection projects outnumbered thermal projects for the first time in the last three decades. However, thermal projects have shown a slight increase since 2004 due to the increase of High pressure air injection (HPAI) projects in light oil reservoirs. This technique originally perfected with heavy oil and tar sand (through ISC projects) has the potential of increasing oil recovery from light oil reservoirs to a great extent. The technique is simple and cost-effective.
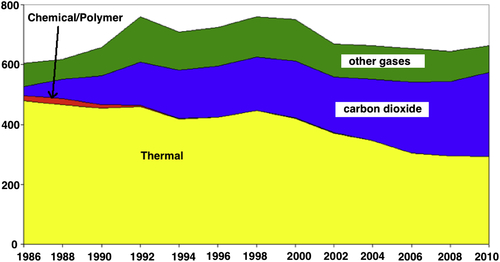
Figure 4.21 Contribution (1000 bbl/day) of various EOR projects.
Chemical EOR methods that were highly successful in laboratory tests have failed miserably in field trials. Once again, this was theoretically expected but the industry could not anticipate in absence of scaled model studies or even scaling laws that capture chemical flooding effectively. Only two projects in chemical injection were reported in 2008. However, there are consorted efforts in the United States as well as the rest of the world to promote chemical flooding, particularly those involving mobility control agents. The focus now is not to create miscible fronts with micelle etc. Instead, new genre of chemical flooding schemes involve the introduction of new polymers and surface active agents. This reattachment to chemical flooding is reminiscent of 1970s and 1980s research in which hundreds of patents “proved” that chemical flooding would be effective in the field but not a single project became cost-effective or even technically successful, despite enjoying tax benefits in the United States for such projects. These techniques are not likely to produce positive results, as will be discussed in the case studies section.
4.2.3. Carbon Dioxide Injection
The most significant development in terms of EOR has been in CO2 projects. Figure 4.22 shows various US basins with increased recovery throughout the last decade. It is this time that there has been a global effort to link CO2 to global warming. The use of CO2 provides one with double dividends. Based on this principle, numerous CO2 projects have surfaced. While theoretically, any CO2 project is both effective and environment friendly, a CO2 project cannot be sustainable unless proper process is followed. This aspect will be considered in a later section.
The second most important considerations in CO2 floods is the fact that it is considered to be inexpensive, at least in the United States (US$ 1–2/Mscf). In addition, the United States has existing network of pipelines that can be readily used for distribution of CO2. There is one significant case study in Weyburn field of Canada, for which an entire pipeline was created in order to dispatch CO2 from United States to Canada. This CO2 was deemed most cost-effective than Canadian CO2 that would have to be extracted from local coal-fired power plants. The project received US $1 billion in government grants and more in tax rebates and flagged as the most important CO2 sequestration project of the time. This project was “profitable” only because of the government grant and some ten-fold increase in oil price. This will be discussed in later sections.
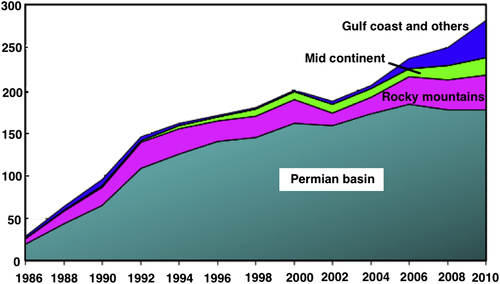
Figure 4.22 Evolution of oil production (1000 bbl/day) of EOR projects in the United States. From Oil & Gas Journal EOR Surveys 1976–2010, based on Oil and Gas Journal, 2010.
It is also important to note that the CO2 pipeline system in the United States was built in a 30-year (1975–2005) time span when oil prices and tax incentives were sufficiently attractive to ensure security of supply as main drivers. These are viable only because of government interference in name of climate change, funding, and investment. Figure 4.23 shows evolution of CO2 projects in the United States and average crude oil prices for the last 30 years. This figure is extracted from Alvarado and Manrique (2010). They used oil prices of the refiner average domestic crude oil acquisition cost reported by the Energy Information Administration (EIA). For reference purposes, crude oil price used in Figure 4.23 was arbitrarily selected for every month of June except for year 2010 (oil price as of March 2010). These CO2 projects led to significant recovery (Figure 4.24).
Although it can be concluded that CO2 EOR (“from natural sources”) is a proven technology with oil prices less than US $20/bbl, this EOR method represents a specific opportunity in the United States and not necessarily can be extrapolated to all producing basins in the world. This conclusion is based on the selection criteria listed in Table 4.3. This cannot be generalized to other countries, where different economic, environmental, and technical conditions prevail. From sustainability point of view, there must be questions that should be asked in proper sequence. For instance, if the technological feasibility question is asked before availability of the carbon dioxide, the answer would be irrelevant at best. Similarly, the presence of an existing infrastructure for both CO2 purification and distribution can alter the decision tree. Finally, recent findings indicate that CO2 is quite effective in recovering heavy oil. In fact, with the new incentive of CO2 sequestration, heavy oil reservoirs offer the greatest potential for CO2 injection.
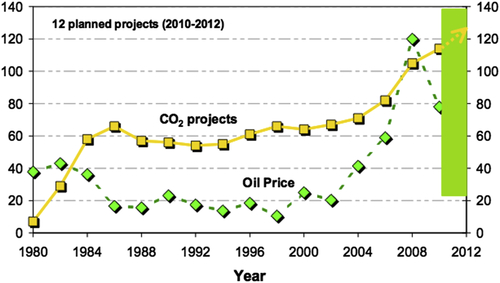
Figure 4.23 Evolution of CO2 projects and oil prices in the United States. From Oil & Gas Journal EOR Surveys 1980–2010 and U.S. EIA 2010. From Alvarado and Manrique (2010).
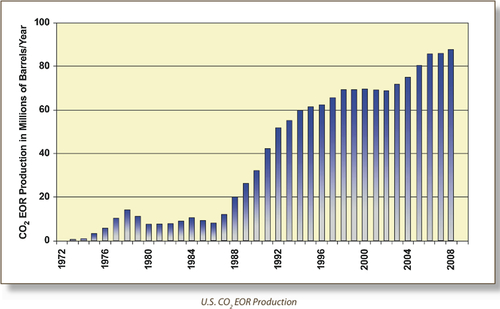
Figure 4.24 CO2-EOR recovery in the United States throughout history.
Table 4.3
Screening Criteria for CO2 Projects as Used in the United States
| Depth (ft) | <9800 and >2000 |
| Temperature (°F) | <250, but not critical |
| Pressure (psi) | >1200 to 1500 |
| Permeability (mD) | >1 to 5 |
| Oil gravity (°API) | >27 to 30 |
| Viscosity (cp) | ≤10 to 12 |
| Residual oil saturation after waterflood, fraction of pore space | >0.25 to 0.30 |
Figure 4.25 shows the strategy developed by the government of Alberta. This program shows equal importance to conventional and heavy oil formations. Scaled model studies show that heavy oil recovery with CO2 can lead to 70% of the oil in place. This is tremendous considering the fact that primary recovery of heavy oil is less than 5% and similar recovery factor with steamflooding would require significant cost increase while having bigger footprint on the environment.
Figure 4.26 shows the importance given to CO2-EGR. The use of CO2 injection in EOR is a mature well practice technology. Enhancing gas recovery through the injection of CO2 however is yet to be tested in the field (Hussen et al., 2012). Numerous simulation studies ever since the early work of Islam and Chakma (1990) have appeared to support high recovery of gas and heavier components from a gas reservoir along with high capacity of CO2 sequestration. Although there are some published simulation studies that have been carried out to comprehend by which process CO2 sequestration in a depleted gas reservoir could lead to EGR, none of these studies have ever attempted to manifest the effect of mixing (CO2–CH4) on the recovery process prior to depleted reservoir. These studies were mainly aimed to reduce greenhouse gas emission in the atmosphere and sequestrating in a depleted gas reservoir or in an aquifer. In the year 2005, a project by Gas de France Production, The Netherlands was in progress to assess the feasibility of CO2 injection prior to depletion of the gas reservoir (K12-B) for EGR and storage. However, since then no follow up results have been published on the final gain in reserve recovery (van der Meer, 2005).
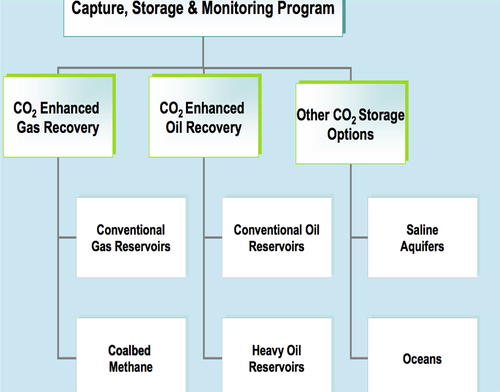
Figure 4.25 Alberta government strategy.
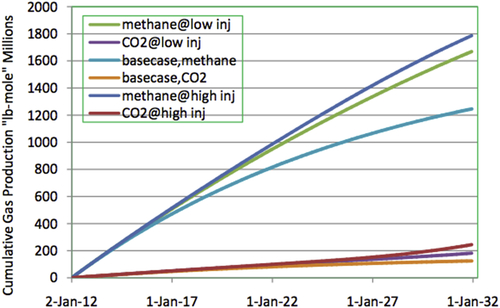
Figure 4.26 Natural gas production with CO2 injection schemes. From Khan et al., 2012.
Generally, high natural gas recovery factors along concerns with degrading of the natural gas resource through mixing of the natural gas and CO2 have led to very little interest shown in CO2-EGR (Clemens, 2002). In terms of sequestration, natural gas reservoirs can be a perfect place for carbon dioxide storage by direct carbon dioxide injection. This is because of the ability of such reservoirs to permeate gas during production and their proven integrity to seal the gas against future escape (Oldenburg et al., 2001).
However, displacement of natural gas by injection of CO2 at supper critical state has not been studied extensively and not well understood (Mamora and Seo, 2002). Despite of the fact that CO2 and natural gas are mixable, their physical properties such as viscosity, density, and solubility are potentially favorable for reservoir repressurization without extensive mixing. This phenomenon of gas–gas mixing can be controlled by controlling the operating parameters.
The injected CO2 in geological formations undergo geochemical interactions, such as structural, stratigraphic and hydrodynamic trapping. The injected CO2 is trapped either in the form of physical trapping as a separate phase or as a chemical trapping where it reacts with other minerals present in the geological formation (International Energy Agency, 2010). As time passes, CO2 becomes immobilized in the geological formation as a function of given long time scales. This is known as geological sequestration. Oldenburg (2003) simulated CO2 as a storage gas. The results suggested that CO2 injection as a supercritical fluid allows more CO2 storage as the pressure increases due to its high compressibility factor. Thus, an expansion of the compressed gas is expected due to changes in pressure and temperature. As a result, there will be a point when gas production no longer is economically feasible.
In terms of economics, not unsurprisingly, Gaspar et al. (2005) claimed the major obstacle for applying CO2-EGR is the high costs involved in the process of CO2 capture and storage. The experience from oil recovery schemes indicate that the economics look quite different when purity in injected CO2 is not sought. It turns out that the purity does not need to be high, and naturally available CO2 or even flue gas would accomplish the same outcome. It is in line with pressure maintenance schemes in oil reservoirs. This option that would make CO2 injection appealing without tax incentive as claimed by IEA (2010).
Khan et al. (2012) conducted economic feasibility study of carbon dioxide into a natural gas reservoir and found the scheme economically attractive because of EGR. Figure 4.26 shows results of CO2 injection at high and low injection rates. Natural gas production is the highest for CO2 injection at high rate. It is because the mixing is the greatest under high injection rates. However, one should note that this study used a stable displacement front. This is a reasonable assumption because CO2 is more viscous and denser than natural gas. Such results are not expected in oil reservoirs. In terms of overall gas injection for EGR, there are 50 projects in North America that employs sour gas injection for treatment of natural gas and produced CO2 has been injected in Dutch sector of North Sea for years (K-12B gas reservoir).
Based on the CO2 capture, utilization, and sequestration strategy, government of Alberta has drafted a comprehensive scheme as shown in Figure 4.27. “CO2 Backbone” is a network or manifold of pipelines that can be used for transporting CO2 from emission hubs as well as taking CO2 to customer sites. The idea is to create an infrastructure based on the “CO2 culture.” Because CO2 is ultimately a valuable commodity, it is suggested that industrial complexes, including pharmaceutical industry, be developed along the backbone. This is a powerful template for developing a comprehensive carbon dioxide based EOR technique.
Figure 4.28 shows locations for various CO2 sequestration projects around the world. These projects are in support of greenhouse gas mitigation.
4.2.4. Thermal Methods
By far the most important EOR scheme in the United States and the world has been the thermal EOR. It has been in operation in heavy oil formations for over five decades. Obviously, the advantage gained by exponential decrease in oil viscosity due to linear increase in temperature has been the focal point of all thermal EOR schemes. Among thermal methods, steam injection has been the most dominant EOR scheme. Simplicity of the scheme and the unique latent heat properties of water are the major reasons why oil industry has been active in steamflooding. Besides, primary oil recovery being practically impossible, huge heavy oil reserves are left as target of the steam injection scheme.
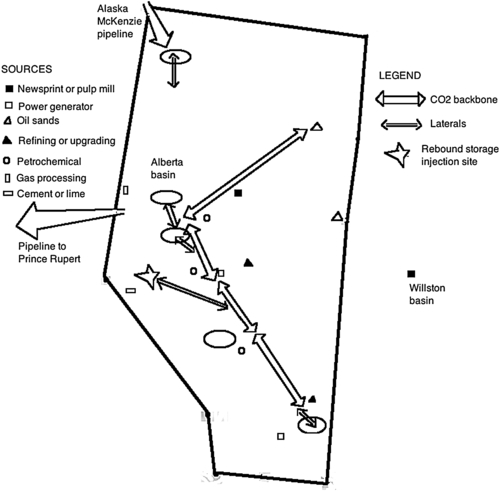
Figure 4.27 Alberta's plan to implement comprehensive Carbon management scheme. From Islam, 2014.
Figure 4.28 CO2 sequestration demonstration projects around the world.
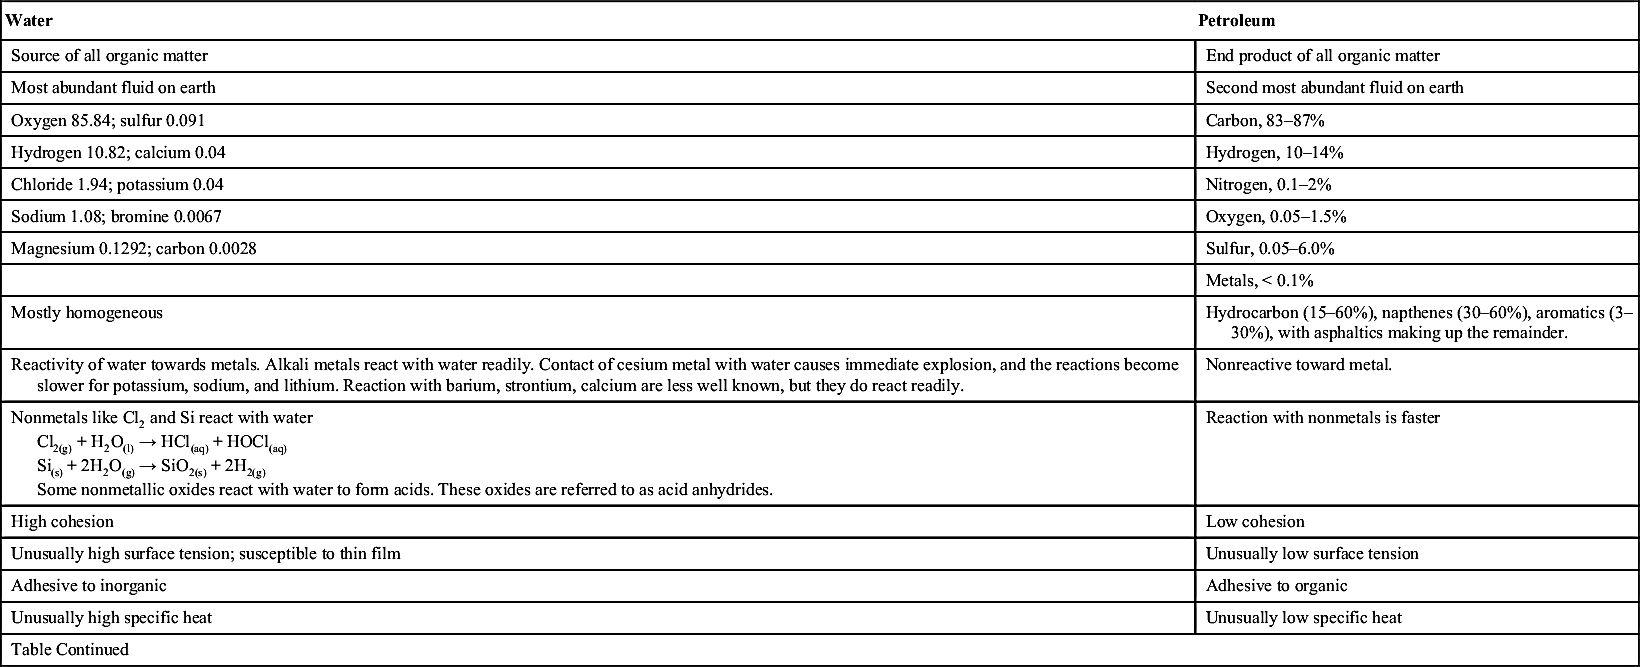
Just as water is the best cleaner, thereby, making waterdrive the most common drive for oil production, steam injection is the most common technique for heavy oil reservoirs. Table 4.4 lists the contrasting features of water and oil. This list makes it clear why the use of water is the most effective technique for oil recovery.
Steam injection process involves conversion of scale-free water to high-quality steam of about 232 °C temperature and at a pressure higher than the corresponding saturation pressure. Generally, using direct fired heaters the water is converted to steam. Using insulated distribution lines, steam is transported to various injection wells. Steam injection can be done by two different methods: steam stimulation and steam displacement.
In the stimulation method a predetermined volume of steam is injection into well and the well is shut in to allow to stimulate the wellbore area. After a few days of shut in the well starts to production. If necessary the stimulation process repeat again. In the steam displacement process, continuous injection of steam, usually apply at lower rates. The steam is injected in place as to distance and direction form production wells. Steam injection is a highly sophisticated process and it requires extensive engineering and analytical inputs.
It is estimated that there are 85–110 billion bbl of heavy oil reserve in the United States. Since the 1960s, steam has become the predominant EOR method for these high-viscosity heavy oil reservoirs worldwide. However, factors such as steam channeling, gravity segregation, and reservoir heterogeneity often result in poor contact of the heavy oil formation by the injected steam, leading to low recoveries. One method of conformance control that has received considerable attention is the use of surfactant foams that reduce steam mobility. Numerous laboratory and technically successful field studies have been reported.
Figure 4.29 shows the production of Syncrude and bitumen in Alberta. Syncrude and bitumen represent the two extremes of the viscosity spectrum. Syncrude is synthesized from natural gas, whereas bitumen represents the heaviest (and most viscous) components of petroleum. Note that both products grew exponentially in the last few decades, ever since implementation in 1980s. While the economics of these products have been reported to be attractive, often the government contribution in building the infrastructure has been overlooked or not included in the analysis. Without significant government involvement, these projects would not be implemented, particularly during the time when oil price was in the range of US $10/bbl. With the increase in oil price, these schemes have become attractive and mega projects are being implemented in bitumen extraction and processing. The future of Syncrude has a somewhat conflicted scenarios. Gas price has increased making it more comparable with oil than previous years. In addition, Alberta has suffered from lack of enough natural gas to meet local needs. This is due to the fact that the population of the province has increased manifold in a country that has seen almost zero growth in population over the same period.
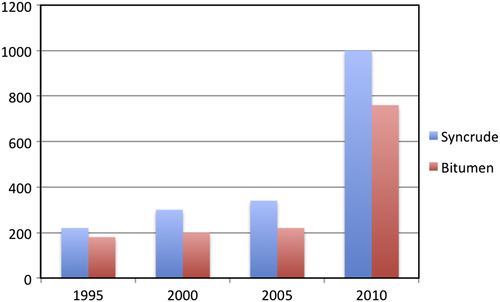
Figure 4.29 Synthetic crude and bitumen production from Canada's tar sand. NRCan, 1998.
Table 4.4
Contrasting Features of Water and Petroleum
| Water | Petroleum |
| Source of all organic matter | End product of all organic matter |
| Most abundant fluid on earth | Second most abundant fluid on earth |
| Oxygen 85.84; sulfur 0.091 | Carbon, 83–87% |
| Hydrogen 10.82; calcium 0.04 | Hydrogen, 10–14% |
| Chloride 1.94; potassium 0.04 | Nitrogen, 0.1–2% |
| Sodium 1.08; bromine 0.0067 | Oxygen, 0.05–1.5% |
| Magnesium 0.1292; carbon 0.0028 | Sulfur, 0.05–6.0% |
| Metals, < 0.1% | |
| Mostly homogeneous | Hydrocarbon (15–60%), napthenes (30–60%), aromatics (3–30%), with asphaltics making up the remainder. |
| Reactivity of water towards metals. Alkali metals react with water readily. Contact of cesium metal with water causes immediate explosion, and the reactions become slower for potassium, sodium, and lithium. Reaction with barium, strontium, calcium are less well known, but they do react readily. | Nonreactive toward metal. |
| Nonmetals like Cl2 and Si react with water Cl2(g) + H2O(l) → HCl(aq) + HOCl(aq) Si(s) + 2H2O(g) → SiO2(s) + 2H2(g) Some nonmetallic oxides react with water to form acids. These oxides are referred to as acid anhydrides. | Reaction with nonmetals is faster |
| High cohesion | Low cohesion |
| Unusually high surface tension; susceptible to thin film | Unusually low surface tension |
| Adhesive to inorganic | Adhesive to organic |
| Unusually high specific heat | Unusually low specific heat |
| Table Continued | |
| Water | Petroleum |
| Unusually high heat of vaporization | Unusually low heat of vaporization |
| Has a parabolic relationship between temperature and density | Has a monotonous relationship between temperature and density |
| Unusually high latent heat of vaporization and freezing | Unusually low latent heat of vaporization and freezing |
| Versatile solvent | Very poor solvent |
| Unusually high dielectric constants | Unusually low dielectric constants |
| Has the ability to form colloidal solutions | Destabilizes colloids |
| Can form hydrogen bridges with other molecules, giving it the ability to transport minerals, carbon dioxide, and oxygen | Poor ability to transport oxygen and carbon dioxide |
| Unusually high melting point and boiling point | Unusually low melting point and boiling point |
| Unusually poor conductor of heat | Unusually good conductor of heat |
| Unusually high osmotic pressure | Unusually low osmotic pressure |
| Nonlinear viscosity pressure and temperature relationship (extreme nonlinearity at nanoscale; Hussain and Islam, 2010) | Mild non-linearity in viscosity pressure and temperature relationship |
| Enables carbon dioxide to attach to carbonate | Absorbs carbon dioxide from carbonate |
| Allows unusually high sound travel | Allows unusually slow sound travel |
| Large bandwidth microwave signals propagating in dispersive media can result in pulses decaying according to a nonexponential law (Pieraccini et al., 2009) | Faster than usual movement of microwave |
| Unusually high confinement of X-ray movement (Davis, 2005) | Unusually high facilitation of X-ray movement. |
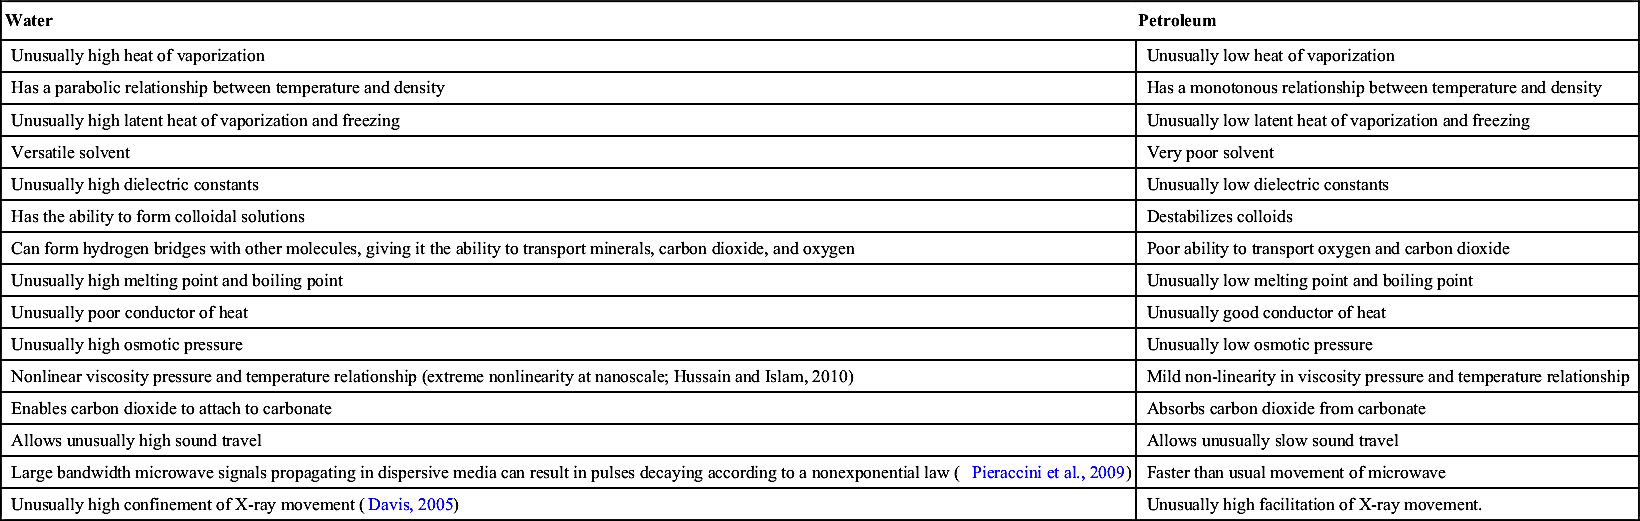
From Hutchinson, 1957; Attwood, 1949; Handbook of Chemistry and Physics, 1981.
For a long time, steam has been used as the driving fluid in heavy oil reservoirs. The steam injection scheme has been very popular because of its simplicity. However, steam injection leads to an unfavorable mobility ratio in most applications. Besides, gravity lay over is a problem with most reservoirs with little or no dip. Injected steam, because of its low density, rises to the top of the reservoir and tends to form a channel beneath the cap rock to the production well. Early steam breakthrough can occur at producing wells owing to override, channeling, unfavorable, and viscous fingering mobility ratio, resulting in low oil recovery efficiency. Because of high steam mobility, there is little pressure differential between injector and producer once steam breakthrough occurs. The majority of subsequently injected steam follows this established path of least resistance and the process efficiency is impaired. Injecting surfactants to generate foam in situ can reduce steam mobility and improve the volumetric sweep efficiency in oil reservoirs. There have been many examples of increased oil production in Californian heavy oil reservoirs when steam r foam was used.
In the last three decades, there have been many attempts to improve steam injection efficiency by the use of additives. Among many additives tried, the aqueous surfactant solution appears to be the most promising one. The objective of such surfactant injection is either to increase the pressure gradient across the region of interest by generation of foam or to use the surface active properties of the surfactant to reduce the oil–water IFT and to alter the relative permeability curve. Following is a list of research areas in this topic:
(1) Surfactant Selection Criteria for Steamflooding. In selecting surfactants for application in thermal recovery, two criteria are set, namely, the resistance of surfactants to hydrolytic degradation and to thermal degradation. It is a common practice to study surfactants at elevated temperatures exterior to porous media. The foam tube test is the most commonly applied technique for determining foam stability exterior to porous media (DeVries, 1958). Some studies found foam stability outside of porous media to be an important indicator of potential mobility reduction within porous media (Doscher and Hammershaimb, 1981). In other studies, however, no such correlation was found (Dilgren et al., 1982). It is likely that the tube test represents foam behavior in very large pore throats and may not represent foam stability in a confined case as in a real porous medium. This observation has been further confirmed by Zhong et al. (1999).
Handy et al. (1982) indicated that thermal stability is a critical factor in the choice of a foaming agent for thermal EOR processes. It has been demonstrated through many studies that foam can be used for flow diversion in a steamflood process. Recently, Djabbarah et al. (1990) reported thermal stability of several surfactants. Despite many disjointed efforts, a comprehensive selection criterion applicable to steamflooding has not been developed yet (Zhong et al., 1999).
2. Microscopic Behavior of Surfactant Steamflooding. It is important to understand microscopic behavior of a system before a field application can be recommended. In steamflooding research, little effort has been spent in studying microscopic behavior and extending that observation to the scaled-up version. Several theories have been proposed to try to explain surface phenomena for a surfactant-steam system (Ransohoff and Radke, 1988; Falls et al., 1988, 1989; Hirasaki and Lawson, 1985). However, very little agreement among researchers exist and fundamental questions, such as the role of gas rate on apparent viscosity of foam, mechanism of bubble generation, effect of surfactant concentration, or the effect of temperature on foam flow cannot be answered without some degree of ambiguity.
3. Role of Residual Oil on Foam. This fundamental aspect of the steam/foam process has not been addressed properly. Most papers on the topic claim to offer different solutions. One possible way to address this process is to conduct research on the microphysical aspect of the process (Zhong and Islam, 1995).
When heat is combined with water, producing steam becomes an effective displacement tool for additional heavy oil recovery. The decrease in heavy oil viscosity being log with increase in temperature, any heating unlocks tremendous amount of oil from the porous medium. Figure 4.30 shows general trend in viscosity versus temperature. Note that the temperature scale is linear whereas the viscosity scale is logarithmic. It translates into a sharp decline in viscosity for moderate increase in temperature. Darcy's law being linear, such decrease in viscosity leads to immediate flow rate increase. In addition, the larger change in viscosity takes place in the lower temperature region and the sharpest decline in higher viscosity oils.
Also affected by temperature is the IFT. This alteration in interfacial difference comes from the fact that surface tensions of water and various petroleum fluids are affected differently, even though each of them varies linearly. Figure 4.31 shows how surface tension varies for various liquids.
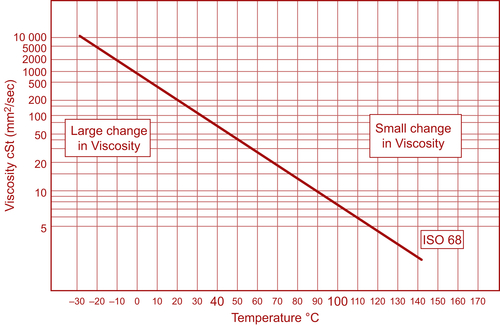
Figure 4.30 Change in viscosity for change in temperature.
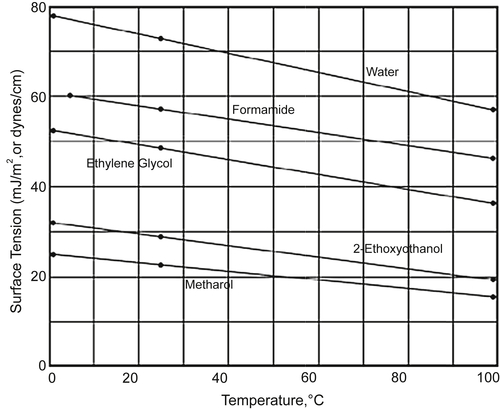
Figure 4.31 Surface tension changes with temperature with different slopes for different chemicals.
Figure 4.32 provides a summary of the measured endpoint residual oil saturations to waterflood as a function of temperature for certain Canadian bitumen samples.
Figure 4.32 shows two different regimes exist as a function of temperature. At the lower temperature range (below 100 °C), there is a rapid decline in oil saturation. In the range of 120–200 °C, the decrease rate is subsided. However, at higher range of temperature (beyond 200 °C), the saturation declines rapidly once again.
It is well documented that residual oil saturation tends to reduce at constant temperature by steamflooding in comparison to conventional waterflooding at the same temperature condition. This is believed to be due to turbulence effects associated with the vaporization of pellicular films of water underlying trapped bitumen as well as possible changes in IFT and wettability during the steam displacement process. Also active is the steam distillation factor that can improve the efficiency of oil recovery with steamflooding. Overall, steamflooding represents optimum cleaning of oil.
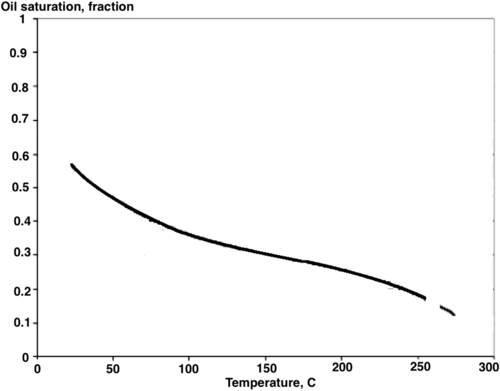
Figure 4.32 Residual oil saturation as a function of temperature. Modified from Bennion et al., 2006.
Figure 4.33 illustrates the trend of pre- and post-steamflood residual oil saturation as a function of steamflood temperature. This figure demonstrates the superiority of steam over hot water injection at the same temperature.
Cyclic steam injection (Huff & Puff), steamflooding and Steam-Assisted Gravity Drainage (SAGD) have been the most widely used recovery methods of heavy and extra-heavy oil production in sandstone reservoirs during last decades. Thermal EOR projects have been concentrated mostly in Canada, former Soviet Union, the United States and Venezuela, and Brazil. Recently, China has made good progress in thermal EOR. Steam injection began approximately five decades ago. Mene Grande and Tia Juana field in Venezuela, and Yorba Linda and Kern River fields in California are good examples of steam injection projects over four decades. They are considered to be some of the most successful EOR projects of all time. The lessons learned have been immense. However, little of that knowledge has been transferred to conventional light oil recovery processes. There is a one-way disconnection between EOR in heavy oil and EOR in light oil. It is so because a great deal of the knowledge from light oil recovery has been transferred to recently developed heavy oil processes, such as steamfloods in the Crude E Field in Trinidad, Schoonebeek oil field in Netherlands and Alto do Rodrigues in Brazil. In addition, heavy oil recovery processes such as VAPEX has used light oil solvent flooding technologies, developed in the 1960s and 1970s. Ironically, “mistakes” of light oil recovery, particularly when it applies to much discredited chemical flooding, have filtered through heavy oil recovery schemes. If it was not for the subsidy of the government and the tax credits offered to stimulate heavy oil and tar sand recovery, these projects would not be viable.
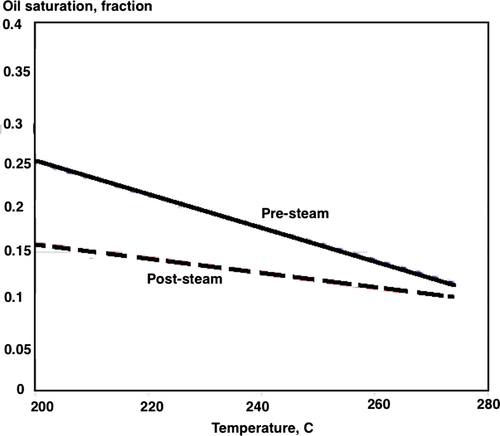
Figure 4.33 Residual oil reduction with temperature for pre- and post- steamflood. Modified from Bennion et al., 2006.
Capitalizing on the success of steamfloods, numerous “improvements” have been suggested for steam-related recovery techniques. They include the use of solvents, gases, chemical additives, and foam in an attempt to control the mobility of the displacement front. Laboratory results shows great recovery potentials of these “novel” techniques. However, similar to chemical flood schemes, field experimentation with this mobility control chemicals have failed to produce satisfactory results. This failure is mainly due to the fact that (1) any use of solvent is deemed uneconomical, (2) it is impossible to control mobility with chemicals beyond a few feet from the wellbore, (3) original steam flood of cyclic steam injection produce significant amount of heavy oil, leaving behind little room for improvement. One example is the LASER (for Liquid Addition to Steam for Enhancing Recovery) process, which consists of the injection of C5+ liquids as a steam additive in cyclic steam injection processes. Although the LASER process was tested at pilot scale in Cold Lake, Canada, the process has not been expanded at a commercial scale. As stated in the previous paragraph, commercial viability of these projects is nil because of inherent issues.
Steam injection has also been tested in medium and light oil reservoirs being crude oil distillation and thermal expansion the main recovery mechanisms in these types of reservoirs. Because light oil reservoirs are often fractured that pose a scenario different from conventionally homogenous formations of heavy oil, considerations must be made in designing steamflood in light oil reservoirs. To be remembered also that light oil reservoirs are already hot and the temperature range from which the maximum decrease in viscosity occurs does not apply to light oil reservoirs. Any heat in the formation will expand the rock/fluid system in such a way that the displacement front is altered. Steam in light oil reservoirs will distillate the crude oil, creating in situ refining. The precipitation of heavier component and ensuing adsorption on the rock surface can change the rock wettability that may favor the oil production. Steam injection in light oil formations does hold promises but has rarely been investigated with rigor.
On the other extreme of the oil viscosity spectrum, SAGD has been employed in recovering tar sand in Canada. This process is particularly suitable for unconsolidated reservoirs with high vertical permeability and has become standard in many fields of Canada. Even though SAGD pilot tests have been reported in China, the United States, and Venezuela, commercial applications of this EOR process have been reported in Canada only and more specifically those implemented in McMurray Formation, Athabasca (e.g., Hanginstone, Foster Creek, Christina Lake, and Firebag, among others). These projects were all subsided by the government of Alberta that spent practically all extra revenues of additional income due to oil boom in the province on these and similar landmark projects. From technological perspective, these projects have been successful. However, their economics have been good only because of the new surge in oil prices. Some argue that they were attractive even when oil price was US$ 12/bbl. These calculations do not account for government subsidies and the tax breaks. A more realistic estimate is the oil price has to be at least US$ 20/bbl for these projects to be economically viable.
Figure 4.34 shows reservoir depths, average horizontal permeability and formation of several SAGD (pilot and large scale) projects, as documented in the literature. Among these projects, only those developed in McMurray Formation (blue bars of Figure 4.34) operate commercially. SAGD projects tested in Clearwater formation in Cold Lake, Canada (yellow bars of Figure 4.34) have proven to be uneconomic.
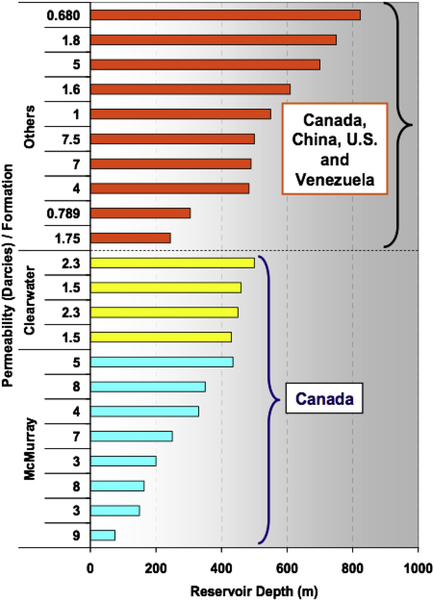
Figure 4.34 Average permeability for various formation and their depth. From Alvarado and Manrique (2010).
Commercial SAGD projects in McMurray formation validate the importance of the geology and reservoir characteristics for this EOR method, findings that have been reported by Rottenfusser and Ranger (2004), Putnam and Christensen (2004), and Jimenez (2008), among others. For any formation beyond 400-m depth, the nature of vertical permeability is such that the horizontal extent of the steamflood becomes more dominant leading to loss of steam in non-extractable zones. With such loss, economics of the system cannot be attractive. From technical perspective, there is a need to study the lateral extents of SAGD wells so that the fact that vertical permeability is lower than horizontal permeability can be used to the benefit of the project.
With the current level oil prices, it is anticipated that the SAGD processes will continue to expand, mainly in Athabasca's McMurray formation. More research and pilot projects should be done for implementation of SAGD to formations that are deeper than 400 m or have low vertical permeability.
Alternatives to SAGD have been proposed. As stated earlier, most alternatives involve “improvements” with chemicals that are meant to reduce mobility of the displacement phase and/or increase extraction of the oil through mixing with solvents (e.g. VAPEX, SW-SAGD, ES-SAGD). In addition, the well configuration or number of wells is also changed for some applications. As examples, one can cite X-SAGD, Fast SAGD, and single well SAGD or SW-SAGD. Well configuration should be designed based on individual formations and typically one should not adhere to a rigid set of well configurations. The use of chemicals, on the other hand, is unlikely to yield positive results because of inherent technical flaws. In addition, they are not sustainable from both economic and environmental aspects.
It is recognized that ISC is the second most important thermal recovery method. Even though, ISC has been applied in tar sand and extra-heavy oil formations, evidence has surfaced that tells us that it is most applicable to medium heavy or even light oil formations. This new evidence explains why most of the ISC pilot projects have yielded inconclusive or failed pilot results. It is increasingly being clear that heavy oil and tar sands are wrong candidates for ISC. In the last decade, ongoing ISC projects in heavy oil reservoirs such as Battrum Field in Canada, Suplacu de Barcu, Romania, Balol, Bechraji, Lanwa and Santhal in India, and Bellevue in the United States demonstrate that a much better candidate for ISC is medium heavy oil formation.
It is worth noting also that hot air injection is the first EOR scheme known to the modern petroleum industry. It is not well publicized because it was not implemented by design. The injection of air leads to ISC and every oil reservoir is a potential candidate of this application. It turns out that recently popularized HPAI is only an offshoot of the original hot air injection concept. The successful application of air injection projects in light oil reservoirs like West Hackberry in the United States demonstrate that this recovery process is a viable EOR strategy for high dipping angle reservoirs combined with double displacement strategies. Since 2000, the number of ISC projects has been steady with 10 projects in sandstone formations, whereas the number of HPAI projects in US light oil reservoirs has shown an important increase during the same period (Figure 4.35). These HPAI projects have been implemented in carbonate formations exclusively.
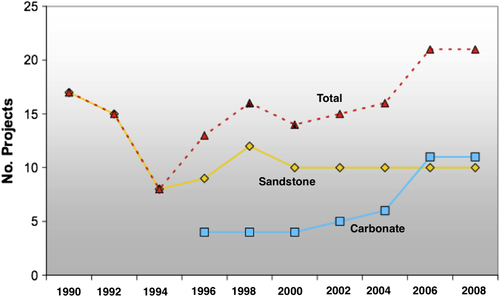
Figure 4.35 Trends in ISC and HPAI. From Moritis, 2008. From Alvarado and Manrique (2010).
ISC in light oil reservoirs does not need to be at high pressure. In fact, simple air injection can lead to the onset of the ISC, making the drive turn into an effective recovery technique. There have been several reports on such applications, such as the one reported by Duiveman et al. (2005) and Hongmin et al. (2008) on air injection projects in Handil Field, Indonesia and Hu 12 Block, Zhong Yuan Field in China, respectively. Although Handil Field HPAI pilot (0.5–1 cp oil) reported injectivity problems due to lack of reservoir communication in the pilot area, the results were reported as encouraging. Injectivity problem in this field is most likely due to reasons other than oil viscosity. During injection of air, low temperature oxidation may occur leading to precipitation of plugging agents that would not generally occur under original field conditions. In addition, air injection that does not necessarily have a fire front at the leading edge can lead to intense viscous fingering making the process extremely inefficient. This may result in low recovery. However, such instability problem cannot be alleviated with the use of chemicals, mainly because chemicals do not travel beyond a few meters in the formation. In addition, use of chemicals is inherently uneconomic and can render the process environmentally unsustainable.
In an attempt to improve air injection, foam assisted water alternating air was used in a pilot project in China (Hongmin et al., 2008). This reservoir has an oil viscosity of 3.9 cp. The results were reported to be encouraging but it is difficult to determine how much of the result can be assigned to improvements with foam. It is likely that the presence of foam did not alter the mechanism of water injection alternated with air. An improvement is expected when one combines these two techniques. Other examples can be given from Rio Preto West onshore Brazil reported by Moritis (2008) and studies reported by Hughes and Sarma (2006), Sarma and Das (2009) and Teramoto et al. (2005), and Onishi et al. (2007) evaluating technical feasibilities and potential of HPAI in Australia and Japan, respectively. All these suggest both technical feasibility and future potential of HPAI in light oil formations.
Other alternatives to ISC has been proposed as well. One alternative involves “Toe-to-heel air injection” or “THAI”. It is an integrated reservoir–horizontal wells process, which uses air injection to propagate a combustion front from the toe-position to the heel of the horizontal producer. Figure 4.36 is a schematic representation of the basic features of the process. This process is meant to minimize gravity override.
The stability of the THAI process depends on two key factors: (1) a high temperature burning zone, which is more advanced in the top part of the oil layer, exhibiting controlled (stable) gas override behavior, and (2) deposition of coke, or heavy residue, inside the horizontal producer. The coke that is deposited inside the horizontal producer acts as a gas seal.
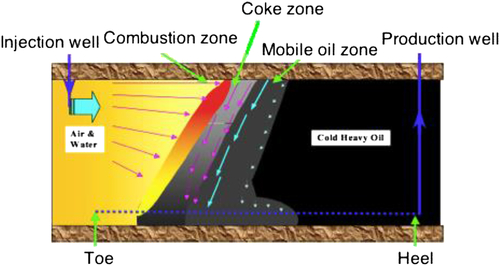
Figure 4.36 Schematic of THAI process. (from Greaves and Xia, 2004)
THAI is a new, more advanced variant of the conventional ISC process, which operates as a short distance, as opposed to long-distance displacement process. This is equivalent to SAGD version of steamflooding. Due to the well arrangement used in THAI, the mobilized oil ahead of the combustion front only travels a short distance (down) to the exposed section of the horizontal producer. Since THAI operates at much higher temperatures than SAGD, it can achieve significant in situ upgrading, and thereby maximize oil recovery. THAI is currently the subject of a pilot development at Christina Lake, Canada.
Controlled atmospheric pressure resin infusion (CAPRI) is the catalytic extension of the THAI process, incorporating an annular layer of catalyst, emplaced on the outside of the perforated horizontal producer well, along its whole length. The reaction conditions created ahead of the combustion front, prior to reactants passing down through the mobile oil zone to contact the catalyst, are established by the THAI process. Further upgrading of the produced oil is achieved by catalytic conversion, as the mobilized oil passes through the catalyst layer. This process is the first step toward downhole refining. While this system works well in laboratory, field application of refining technique is economically unattractive. This would not be the case if (1) expensive catalysts are replaced with natural, yet effective catalysts; (2) the produced fluid is considered to be upgraded, thereby being assigned a higher grade at the refinery; (3) custom-designed well placement for each application, depending on formation and fluid characteristics.
Figure 4.37 shows some of the test results using THAI and CAPRI. The test was combination of dry and wet THAI/CAPRI test, in which water was injected together with the injected air (CAPRI), as tracer during the second wet combustion period. A stable, high temperature combustion front (500–600 °C) was propagated along the horizontal producer, during the dry and wet combustion periods. The excellent sweep of the combustion front, in a “toe-to-heel” manner, achieved a high oil recovery, at 87% original oil in place (OOIP). The figure shows the variation of the API gravity and viscosity for samples of the produced oil collected during the experiment. Before the combustion front reached the catalyst layer, the degree of thermal upgrading of the produced oil was only about two API points. This is very low, compared to a normal THAI test on Wolf Lake heavy oil. This is because no clay was added into the sand pack for this particular trial. The effect of catalyst on the produced oil is clearly evident in Figure 4.37. The API gravity of the produced oil jumped from an API value of 14, up to 24, during the period of 240–400 min. As the combustion front approached the catalyst section along the horizontal producer, mobilized oil, already partially upgraded in the THAI process, underwent further catalytic conversion reactions. During the second wet combustion mode, with water injection, the upgrading trend was reduced slightly from 22 oAPI to 20 oAPI. The viscosity of the produced oil achieved by CAPRI was 10–40 mPas, down from the original 24,400 mPas for Wolf Lake crude oil.
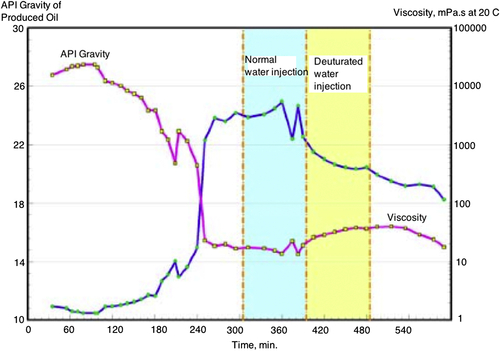
Figure 4.37 Upgrading with THAI and CAPRI. (from Greaves and Xia, 2004)
In order to seek increased efficiency, other forms of thermal EOR have been proposed. For instance, downhole steam generation (Eson, 1982; Donaldson, 1997), electric heating (Sierra et al., 2001) or electromagnetic heating (Islam et al., 1991; Das, 2008), and microwave (Hascakir et al., 2008) technologies. Some of these technologies were touted decades ago in the form of electrical heating. Later on, great promises were made with electromagnetic heating. A company, called Electromagnetic Oil Recovery was formed in 1980s in Calgary. This company implemented a number of field applications of the electromagnetic heating technology. However, none produced satisfactory result and the company went bankrupt. This technique promised to eliminate one of the bigger technical problems with conventional steam injection in regions where permafrost exists. Several options have been tried for the use of electricity to heat oil reservoirs. These methods can be classified according to the mechanism of thermal dissipation that dominates the recovery process (Pizzaro and Trevisan, 1990). They range from dielectric heating with high frequency range to radio frequency in the microwave range. Wadadar and Islam (1994) had investigated the possibility of using electromagnetic heating with horizontal wells. Islam and Chilingar (1995) reported the results of a series of numerical simulation tests based on the method originally proposed by Islam and Chakma (1990). They showed that by coupling electromagnetic heating with other EOR schemes, one can increase the recovery of heavy oil or tar sand significantly. To date, however, not a single field project has been reported to be successful on the use of this technology.
4.2.5. Chemical Methods
Chemical EOR methods lived their best times in the 1980s, most of them in sandstone reservoirs. These methods typically promise alteration of rock and/or fluid properties so that irreducible oil saturation is decreased. The total of active projects using chemical peaked in 1986 with polymer flooding as the most important chemical EOR method. However, since 1990s, oil production from chemical EOR methods has been negligible around the world except for China (Han et al., 1999; Delamaide et al., 1994; Wang et al., 2002). Nevertheless, chemical flooding has been shown to be sensitive to volatility of oil markets despite recent advances (e.g., low surfactant concentrations) and lower costs of chemical additives. Technically polymer alone does not increase oil recovery efficiency. In addition, polymer does not propagate within the formation beyond a few meters, mainly because polymer adsorption rate is very high and if polymer concentration is increased, one runs into serious injectivity problem. Polymer seems to be effective when combined with surfactants and sacrificial chemicals. However, cost of such process remains prohibitively high.
Polymer flooding has been tried for a long time and is considered to be a mature technology and still the most important EOR chemical method in sandstone reservoirs based on the review of full-field case histories. Even though all forms of chemical methods have been practically abandoned in the United States, according to the EOR survey presented by Moritis in 2008, there are ongoing pilots or large-scale polymer floods in Argentina (El Tordillo Field), Canada (Pelican Lake), China with approximately 20 projects (e.g., Daqing, Gudao, Gudong, and Karamay fields, among others), and India (Jhalora Field). It is important to mention that a commercial polymer flood was developed in North Burbank during the 1980s, demonstrating that this EOR method may still have potential to increase oil recovery in mature basins (i.e. mature floods with movable and/or bypassed oil). North Burbank reinitiated polymer flooding on a 19-well pattern in December. Other reported polymer flooding projects include Brazilian Carmopolis, Buracica, and Canto do Amaro fields. India also reports a polymer flood in Sanand Field. Oman documented a polymer flood pilot developed in Marmul Field and almost 20 years later a large-scale application is under way (Moritis, 2008). Additionally, Argentina (El Tordillo Field), Brazil (Voador offshore Field), Canada (Horsefly Lake Field) and Germany (Bochstedt Field) announced plans to implement polymer flood projects.
Colloidal dispersion gels (CDGs) and BrightWater® also represent novel polymer-based technologies that are currently under evaluation at field scale. These chemicals are meant for mobility control of a displacement drive. By injecting these mobility control agents, reservoir heterogeneities are homogenized, thereby avoiding channeling or fluid loss in unproductive areas. Documented CDGs projects include Daqing Field in China, El Tordillo and Loma Alta Sur fields in Argentina, and in multiple US oilfields. Regarding BrightWater®, at the present time Milne Point in Alaska is the only field application discussed or documented in the public domain. While it is expected that the number of CDGs and BrightWater® field applications will increase in the near future based on recent field and laboratory studies underway, none of them is expected to give positive results. If the oil price continues to be high, producers would be satisfied with the investment, irrespective of the actual benefit of the recovery scheme.
While polymer flooding has been the most applied EOR chemical method in sandstone reservoirs, the injection of alkali, surfactant, alkali-polymer (AP), surfactant-polymer (SP) and Alkaline Surfactant-Polymer (ASP) have been tested in a limited number of fields. In this application, alkali plays the role of a sacrificial agent. New genre of surfactants have been developed that reduce the dynamic IFT to a very low number (Islam and Farouq Ali, 1990; Taylor et al., 1990). These surfactants are highly unstable extremely toxic, and exuberantly costly.
As mentioned earlier, micellar polymer flooding had been the second most used EOR chemical method in light and medium crude oil reservoirs until the early 1990s. Although this recovery method was considered a promising EOR process since the 1970s, the high concentrations and cost of surfactants and co-surfactants, combined with the low oil prices during mid-1980s limited its use. The development of the ASP technology since mid-1980s and the development of the surfactant chemistry have brought up a renewed attention for chemical floods in recent years, especially to boost oil production in mature and waterflooded fields.
Several EOR chemical methods, other than polymer flood, have been extensively documented in the literature during the last two decades. However, at the present time Daqing Field represents one of the largest, if not the largest, ASP flood implemented as of today. ASP flooding has been studied and tested in Daqing for more than 15 years though several pilots of different scales. According to the EOR survey presented by Moritis in 2008, there are ongoing ASP pilots in Delaware Childers Field (Oklahoma) and planned ASP floods in Lawrence Field (Illinois) and Nowata Field (Oklahoma), and SP floods in Midland Farm Unit, Texas (Grayburg Carbonate Formation) and in Minas Field, Indonesia. The surging number of the chemical projects, however, does not tell the full story. There are many other unreported cases that are either in the plan or have been implemented but have not been reported because of lack of success. Fundamentally, ASP or any other chemical EOR technique is economically unattractive and environmentally disastrous. This can be changed only by resorting to other nonconventional sources of chemicals that are either naturally available in local areas or are liability of an operation site because it is a waste of by-product of other activities.
4.2.6. Gas Injection
Even thought CO2 injection has been discussed in a previous section, this section is introduced in order to familiarize readers with the basic of gas injection projects. EOR gas flooding has been the most widely used recovery methods of light, condensate, and volatile oil reservoirs. Both miscible and immiscible gas injection schemes hold tremendous potential for future applications in the mainly untapped reservoirs of the world, especially in regions where the reserve/production ratios are high. However, a gas injection process can be severely flawed if the displacement front is not stabilized. It is essential to take advantage of the gravitational forces. Recently, horizontal wells have been proposed to enhance gravity segregation while maintaining stable displacement fronts.
Numerous field reports in Canada (Shell and Husky Oil) show that horizontal wells can be used to successfully conduct stable miscible displacement of both light and heavy oil. The key to success in miscible or immiscible gas injection appears to be the accurate prediction of the frontal stability, which is very sensitive to reservoir heterogeneity.
Another method of reducing viscous fingering during gas injection is the use of foam. The foam increases the viscosity of the displacing gas phase to the extent that an otherwise unstable front (with gas only) can become stable. Also, foam has a homogenizing effect when the displacement front encounters a heterogeneous spot in the reservoir. Even though no study has been reported on the topic of frontal stability in a heterogeneous medium, foam is likely to eliminate some of the problem associated with frontal instability due to heterogeneity.
Launched in 2000, the Weyburn–Midale CO2 Project in Saskatchewan, Canada, is the world's largest full-scale, in-field study of CO2 injection and storage in depleted oil fields. When completed, the 11-year International Energy Agency project (funded in part by DOE) will permanently store 40 million metric tons of CO2 while increasing oil production by 18,000 bbl/day.
Although nitrogen (N2) injection has been proposed to increase oil recoveries under miscible conditions favoring the vaporization of light fractions of light oils and condensates, today few N2 floods are ongoing in sandstone reservoirs. Immiscible N2 floods are reported in Hawkins Field (Texas) and Elk Hills (California) based on the Moritis EOR survey in 2008. No new N2 floods in sandstone reservoirs have been documented in the literature during the last few years. HPAI schemes and their success tell us that N2 injection is not an effective option and certainly not economically and environmentally sustainable.
Hydrocarbon gas injection projects in onshore sandstone reservoirs have been employed for many decades. Initially, they were used as a means of pressure maintenance in order to arrest the pressure decline that occurs in any naturally depleting reservoir (Figure 4.38). These projects made a relatively marginal contribution in terms of total oil recovered in Canada and the United States other than on the North Slope of Alaska, where large natural gas resources are available for use that do not have a transportation system to markets. Conventionally, the term “EOR” gas methods include mainly hydrocarbon gases such as water alternating gas (WAG) injection schemes, enriched gases or solvents and its combinations. Even though pressure maintenance is not considered to be an EOR technique, the process remains the same and therefore one must investigate the possibility of additional oil and gas recovery with pressure maintenance. Most of immiscible and miscible EOR hydrocarbon gas floods in the United States are on the North Slope of Alaska while in Canada a miscible gas flood is reported in Brassey Field. The situation of hydrocarbon gas injection projects is different in offshore sandstone reservoirs. This aspect will be discussed in a later section. Conventionally, it is said that if there is no other way to monetize natural gas, then a more practical use of natural gas would be to use it in pressure maintenance projects or in WAG processes. However and if available, the substitution of hydrocarbon gases by nonhydrocarbon gases (N2, CO2, acid gas, air) oil recovery will make more natural gas available for domestic use or export while still maintaining reservoir pressure and increasing oil recoveries. This recommendation applies to both EOR and EGR.
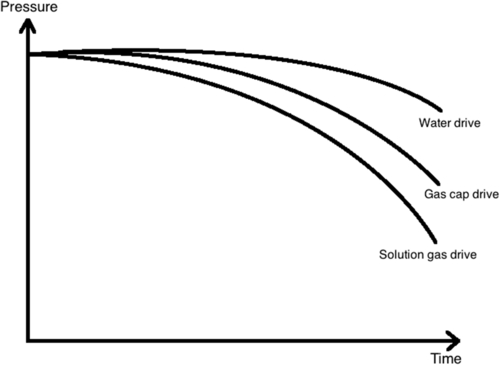
Figure 4.38 Pressure maintenance program involves artificially boosting pressure–time curve.
On the other hand, CO2 flooding has been the most widely used EOR recovery method for medium and light oil production in sandstone reservoirs during last decades, especially in the United States due to the availability of cheap and readily available CO2 from natural sources. There has been an increasing trend in the number of CO2 field projects in the United States during the last decade in both, sandstone and carbonate reservoirs.
The number of CO2 floods is expected to continue to grow in the United States sandstone reservoirs. Some examples of planned CO2-EOR projects in the United States include Cranfield Field, Heidelberg West (from anthropogenic sources) and Lazy Creek Field in Mississippi and Sussex Field in Wyoming. Number of CO2 floods in Wyoming sandstone reservoirs are also expected to increase based in a recent evaluation presented by Wo et al. (2009). This particular project depends on the CO2 availability. In all these projects, availability of CO2 is considered as the determining factor of EOR application.
Additionally, Holtz (2008) reported an overview of sandstone gulf coast and Louisiana CO2-EOR projects to estimate EOR reserve growth potential in the area including sandstone reservoirs in the Gulf of Mexico. Table 4.5 summarizes major features of certain CO2-EOR projects. Moritis EOR survey (2008) reports up to nine active immiscible CO2 floods operating since mid-1970s. The experience of various countries represent different lessons that can be learned. For instance, Midale project in Canada uses trucked CO2 from another Canadian field, whereas Weyburn projects imports CO2 that is specifically generated for this project and pipelined (over 200 km) from the United States. Yet, Weyburn is the only project worldwide that has the classification of being an EOR and sequestration project simultaneously. The experience of Trinidad is noteworthy. This project uses waste gas from a nearby Ammonia plant. As discussed earlier, waste gas from a chemical plant represents very high economic boon as well as environmental sustainability. Yet, this project is not considered to be a model for greenhouse gas sequestration. Canada's PTAC project represents the most comprehensive application of CO2 projects. In terms of CO2 EOR, Alberta projects 3.6 billion bbl additional oil recovery over the next two decades. At the same time, a significant amount of greenhouse gas would be sequestered. In addition, new industries that make use of CO2 as a commodity would be developed.
Table 4.5
Selected Projects Involving CO2 Injection
| Country | Type of formation | Field name | CO2 source | Incentive |
| Brazil | Sandstone | Buracica and Rio Pojuca | Anthropogenic, ammonia plant | EOR and storage |
| Canada | Sandstone | Pembina and Joffre | Anthropogenic | EOR |
| Limestone | Weyburn | CO2 from coal burning | EOR and storage | |
| Limestone | Midale | Transported truck | EOR | |
| PTAC EOR–EGR storage multipurpose | ||||
| Croatia | Sandstone | Ivanic Field | Transported truck | EOR |
| Hungary | Sandstone | Budafa and Lovvaszi | Anthropogenic | EOR |
| Sandstone | Szank | Sweetening plant | EOR and storage | |
| Trinidad | Sandstone | Ammonia plant | EOR |
Due to the lack of rigorous scientific investigation, the designs of EOR projects involving CO2 or other greenhouse gases have been flawed from technical, environmental, and economical perspective. For instance, on the technical side, most flow rates selected, even with horizontal wells, are high enough to induce viscous fingering, with the only exception being the projects involving injection of gas from the top of an anticline or highly dipped formation. The problem is further accentuated for a heterogeneous formation or a formation previously flooded with water or with high water cut. Flow instability in these cases diminish or eliminate the possibility of maintaining a stable front. All laboratory experiments, however, are conducted under stable conditions, thereby, represent optimistic conditions that will not prevail in field. Any field or pilot design based on these experiments is likely to yield disappointing results (Islam et al., 2010, 2012).
Based on laboratory tests, it is often proposed that pure CO2 be used for maintaining miscibility. Because of flawed definition of environmental integrity, it is suggested that the use of purified CO2 and sequestration of it would be beneficial to the environment. A truly scientific criterion would indicate that processing CO2 makes it lose its natural properties that make it a principal player of the photosynthesis process (Khan and Islam, 2007; Chhetri and Islam, 2008). As a consequence, “purified” CO2 is toxic to the environment at the same time being costly. Ironically, the need for pure CO2 arises from the premise that miscibility prevails in the reservoir—a premise that does not apply to most CO2 applications. In presence of immiscible flow, there is no need for maintaining high concentration of CO2 in the injected gas. Also, if miscibility is not achieved, there is little advantage to having pure CO2, and even waste gas, produced gas, etc., would suffice. Pure CO2 in high water cut zones would only result in a loss of valuable CO2. On the other hand, the injection of greenhouse gas or produced gas would increase accessibility of the untapped oil.
The economics of any EOR project is unacceptable with expensive chemicals (e.g. pure CO2, surfactant, polymer, alkali). While pure CO2 is technically capable of recovering additional oil, it has been demonstrated through numerous field trials that conventional chemical floods do not yield acceptable results. This is because, these chemicals do not travel more than a few meters within the reservoir. This is the reason, chemical flooding has failed to recover any additional oil and the chemical techniques have been discontinued for several decades. Today, only China applies chemical flooding techniques and only a handful of operations have been tested in the North Sea. This is mainly because these operators produce their own chemicals.
In terms of emerging technologies, HPAI is the method with greatest potentials. This method combines the positive effects of CO2 injection (through oxidation of in situ oil) as well as thermal methods. In case, CO2 or other gases are not locally available, HPAI should be considered.
The following sequential screening is recommended.
1. Screen the type of fluid (gas or water) available.
2. Consider stability with both water and gas.
3. Consider miscible injection only with stable cases (in presence of natural dip for which CO2 or other gases can be injected from a structurally higher position).
4. Consider reinjection of produced gas (including sour gas in original concentration), flue gas, and finally air, depending of availability.
5. Laboratory tests should be performed using the above fluids and not using idealized fluid.
6. Numerical simulation should be considered only for well placement, injection protocols, and similar strategic issues. One must note that reservoir simulators are incapable of modeling unstable flow.
For scaling an EOR process or to determine stability of the displacement front, the following steps are required:
1. Determine the end-point permeabilities.
2. Determine the capillary pressure curve.
3. Determine IFTs.
4. Estimate flood pattern dimensions.
5. Estimate frontal velocity from the injection well.
6. Calculate the gravity number.
7. Calculate the instability number.
9. If the instability number is greater than π2, calculate the laboratory velocity such that the instability number in the laboratory matches with that of the field.
Khan and Islam (2007) give full details of these steps, including the definition of the instability number, capillary number, mobility ratio, etc.
It is important to note that, for gas injection, the instability number continues to affect the recovery, meaning the higher the flow rate the less recovery there will be. This is because the pseudo-stable regime is never reached with gas. Gravity plays an important role during gas injection because the value of the gravity number can stabilize a process.
During miscible displacement, the displacement front develops a transition zone that can vary in length significantly. If the crude oil in question is not light, the transition zone can be much wider. The problem with a wide transition zone is that the miscibility can be lost altogether. The lack of miscibility or the extension of the transition under any displacement situation would translate into an inadequate sweep of the reservoir, resulting in low oil recovery. The effect of the transition zone length has not been studied in the past. Inherently related to this problem is the storage or mitigation aspect of CO2 displacement. Unless efforts are made to define the miscible/immiscible system, the performance prediction is bound to be inaccurate. Also, it is important to predict the sustenance of a miscible front. The lack of miscibility may in turn lead to the onset of viscous fingering.
4.2.7. EOR by Lithology
Reservoir lithology is one of the screening considerations for EOR methods, often limiting the applicability of specific EOR methods. Figure 4.39 shows that most EOR applications have been in sandstone formations. There are several reasons for this.
Typically, carbonate reservoirs show high recovery factors with primary and secondary modes. Similar to what happened with gas reservoirs, there are few incentives for applying EOR to carbonate reservoirs. Thermal recovery techniques are most applicable to heavy oil and tar sand reservoirs. Such reservoirs are exclusively sandstone or unconsolidated sand. The very few thermal projects applied in carbonate formations are not typical thermal operations nor are they with heavy oil. Nevertheless, thermal recovery projects are successful in carbonate reservoirs. The second most commonly used EOR technique for sandstone formations is the chemical technique. However, chemical floods are largely known as technical failures with nil incremental recovery reported after the tax incentive for EOR was removed in 1980s. Chemical floods do work in the laboratory trials but have yielded no tangible result in the field. This demonstrates the incompetence of experimental design of scaled models. There have been fewer applications of chemical techniques in carbonate formations. However, most of them are tagged as “successful.” This conclusion is based on misunderstanding the chemical process involved. Most “successful” recovery processes in chemical methods is the polymer flood technique. Polymer flood does improve oil production rates, but it is not because polymer flood contributes to the reservoir displacement process. It is mainly because polymer, while applying locally (not as drive process), reduces water cut drastically.
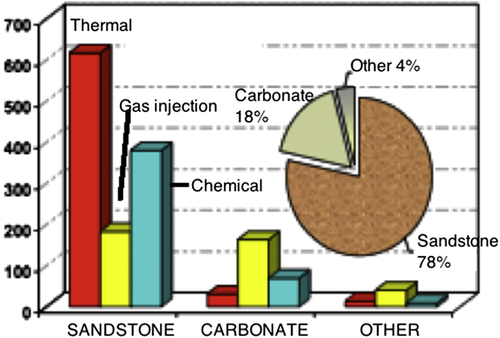
Figure 4.39 Distribution of EOR methods in various lithologies (1500 EOR projects). From Alvarado and Manrique (2010).
For sandstone reservoirs, gas injection is the least frequently used technique. However, incremental recovery is higher in gas injection than in chemical injection. Several decades were wasted in search of incremental recovery with chemical injection but with unfavorable results. In contrast, gas injection is the most commonly used in carbonate reservoirs. Among various gas injection techniques using natural gas, nitrogen and CO2, CO2 injection has been the most successful. In this chart pressure maintenance with gas is not included even though scientifically speaking they also constitute EOR.
4.2.7.1. EOR in Sandstone Formations
Most EOR techniques other than chemical flooding have been successful in sandstone formations. Most pilot and commercial projects have yielded favorable results. In several field applications, combination of more than one recovery technique have been implemented with success. Buracica and Carmopolis (Brazil), and Karazhanbas (Kazakhstan) are good field examples that have been subject to several EOR technologies at pilot scale in sandstone formations:
• Buracica is an onshore light oil (35 °API) reservoir with reported air injection (1978–1980), immiscible CO2 injection (1991), and polymer flooding (1997) pilot projects. Immiscible CO2 injection was expanded in the field using CO2 captured from an ammonia plant. This particular project shows the usefulness of impure CO2, which is far more economical than pure CO2 cases.
• Carmopolis is an onshore heavy oil (22 °API) reservoir with reported ISC (1978–1989), polymer flooding (1969–1972 and 1997), steam injection (1978), and microbial EOR or microbial EOR (2002) pilot projects. The field has been developed mainly by waterflooding.
• Karazhanbas is an onshore heavy oil (19 °API) reservoir with documented polymer flooding, steam injection, ISC and ISC with foam injection as conformance strategy. Karazhanbas Field was developed by waterflooding, CHOPS (Cold Heavy Oil Production with Sands), and steam injection.
4.2.7.2. EOR in Carbonate Formations
It is well known that a considerable portion of the world's hydrocarbon endowment is in carbonate reservoirs. Some estimates put carbonate reservoirs to hold more than 60% of the world's proven oil reserves and 40% of the world's gas reserves. However, carbonate reservoirs are mostly fractured with low matrix porosity. Carbonate reservoirs usually exhibit low porosity and may be fractured. These two characteristics along with oil-to-mixed wet rock properties usually result in lowered hydrocarbon recovery rates. When EOR strategies are pursued, the injected fluids will likely flow through the fracture network and bypass the oil in the rock matrix. The high permeability in the fracture network and the low equivalent porous volume frequently result in early breakthrough of the injected fluids. This can be effectively resolved by proper characterization of a carbonate reservoir. The following features must be considered:
• predominant strike and dip of fractures,
• fracture density,
• fracture connectivity (extent of secondary cementation)
• horizontal and vertical variation of fractures.
A large number of EOR field projects in carbonate reservoirs have been referenced in the literature during the last decades. Traditionally gas injection has been the most commonly used EOR technique for carbonate reservoirs. This is not to say that this is the most suitable EOR technique. It turns out other methods (even chemical) works equally well. In terms of chemical methods, polymer travels more easily in carbonate formations, making it easier to control water cut. This is the reason many consider chemical methods to be effective in carbonate reservoirs. Similarly, thermal flooding has been used very rarely in carbonate reservoirs, mainly because the target reservoirs of thermal methods are heavy oil that is non-existent in carbonate reservoirs. However, when HPAI, a simpler version of ISC, was used in carbonate reservoirs, it gave positive results, as discussed earlier.
In contrast with sandstone reservoirs, there are few fields where different EOR technologies have been evaluated successfully at pilot scale demonstrating technical applicability of different EOR methods in carbonate formations. Yates Field (Texas) is a good example of a carbonate formation where different EOR processes have been tested successfully at different scales (from pilots to large-scale applications). Some of the EOR processes evaluated in Yates Field that have been documented in the literature include:
• Nitrogen (N2) injection began in the mid-1980s as a reservoir pressure maintenance strategy.
• Steamflooding pilot was initiated in the late 1998 as a potential strategy to improve vertical gravity drainage process.
• Dilute surfactant well stimulation pilot test was reported in the early 1990s as a strategy to increase oil recovery by IFT reduction, gravity segregation of oil, and wettability alteration, among others mechanisms.
• In March 2004 Yates Field started replacing N2 injection with CO2 injection as a pressure maintenance strategy and enhanced gravity drainage.
Manrique et al. (2007) presented a comprehensive review of EOR field experiences in U.S. carbonate reservoirs. The same data were published by NETL of the DoE (2004). They summarized various EOR applications in carbonate reservoirs of the United States in the Table 4.6.
Not surprisingly, CO2 injection has been the most successful of EOR operations in carbonate reservoirs. From the current US active CO2 floods, 67% (48 projects) are in carbonate reservoirs, mostly located in the state of Texas. Table 4.7 shows some of the CO2 floods employed in the United States. In the past, projects were custom designed based on selected fluids (e.g. purified CO2, nitrogen, rich hydrocarbon gas). However, after 1990s, most projects are selected based on available fluids. Even though not formally recognized, US EOR projects that are commercially successful employed this criterion. Canadian Weyburn project is the first one that was employed in recent time based on selected fluid. This was possible because the project was tagged as an experimental project for determining feasibility of CO2 sequestration during EOR. By contrast, US projects are tied to the availability of natural sources of CO2 and CO2-transporting pipelines relatively close to the oilfields under this recovery method. One prime example is the Permian Basin. The Permian Basin is the largest consumer of CO2, mostly through a vast network of pipelines (also CO2 trucks). The majority of the CO2 consumed in the West Texas and New Mexico Permian Basin are from commercial natural reservoirs in Colorado (the McElmo Dome and the Sheep Mountain fields), New Mexico (the Bravo Dome region) and Wyoming (La Barge Field). Similarly, successful Canadian projects have employed local CO2 or at least trucked local CO2. For instance, very successful Midale project trucks one-third of the total supply from Lyodminster in Canada at a cost of $70/ton.
Table 4.6
EOR in Various Carbonate Reservoirs in the United States
| Location | Field | Pay zone/reservoir | Formation | φ (%) | K (mD) | Depth (ft) | Gravity (°API) | Oil Viscosity (cp) | Temperature (°F) |
| Kansas | Hall-Gurney | LKCC | Limestone | 25.0 | 85.0 | 2900.0 | 39.6 | 3.0 | 99.0 |
| Michigan | Dover 36 | Silurian-Niagaran | Limestone/Dolomite | 7.0 | 5.0 | 5500.0 | 41.0 | 0.8 | 108.0 |
| Michigan | Dover 33 | Silurian-Niagaran | Limestone/Dolomite | 7.1 | 10.0 | 5400.0 | 43.0 | 0.8 | 108.0 |
| New Mexico | Maljamar | Grayburg/San Andres | Dolomite/Sandstone | 10.2 | 18.0 | 4000.0 | 36.0 | 1.0 | 90.0 |
| New Mexico | East Vacuum | San Andres | Dolomite | 11.7 | 11.0 | 4400.0 | 38.0 | 1.0 | 101.0 |
| New Mexico | Vacuum | San Andres | Dolomite | 12.0 | 22.0 | 4550.0 | 38.0 | 1.0 | 101.0 |
| New Mexico | North Hobbs | San Andres | Dolomite | 15.0 | 13.0 | 4200.0 | 35.0 | 0.9 | 102.0 |
| North Dakota | Little Knife | Mission Canyon | Dolomite | 18.0 | 22.0 | 9800.0 | 43.0 | 0.2 | 240.0 |
| Texas | Anton Irish | Clearfork | Dolomite | 7.0 | 5.0 | 5900.0 | 28.0 | 3.0 | 115.0 |
| Texas | Bennet Ranch Unit | San Andres | Dolomite | 10,0 | 7.0 | 5200.0 | 33.0 | 1.0 | 105.0 |
| Texas | Cedar Lake | San Andres | Dolomite | 14.0 | 5.0 | 4700.0 | 32.0 | 2.0 | 103.0 |
| Texas | Adair San Andres Unit | San Andres | Dolomite | 15.0 | 8.0 | 4852.0 | 35.0 | 1.0 | 98.0 |
| Texas | Seminole San Andres Unit | San Andres | Dolomite | 13.0 | 20.0 | 5100.0 | 34.0 | 1.2 | 101.0 |
| Texas | Seminole Unit, ROZ Phase l | San Andres | Dolomite | 12.0 | 62.0 | 5500.0 | 35.0 | 1.0 | 104.0 |
| Texas | Levelland | San Andres | Dolomite | 12.0 | 3.8 | 4900.0 | 30.0 | 2.3 | 105.0 |
| Texas | North Cowden | Grayburg/San Andres | Dolomite | 12.0 | 5.0 | 4300.0 | 34.0 | 1.6 | 94.0 |
| Texas | Wasson (ODC Unit) | San Andres | Limestone | 9.0 | 5.0 | 5100.0 | 32.0 | 1.3 | 110.0 |
| Table Continued | |||||||||
| Location | Field | Pay zone/reservoir | Formation | φ (%) | K (mD) | Depth (ft) | Gravity (°API) | Oil Viscosity (cp) | Temperature (°F) |
| Texas | Slaughter (HT Boyd Lease) | San Andres | Dolomite | 10.0 | 4.0 | 5000.0 | 31.0 | – | 108.0 |
| Texas | Slaughter (Central Mallet) | San Andres | Limestone/Dolomite | 10.8 | 2.0 | 4900.0 | 31.0 | 1.4 | 105.0 |
| Texas | Slaughter Estate Unit (SEU) | San Andres | Dolomite | 10.5 | 4.3 | 5000.0 | 28.0 | 1.7 | 105.0 |
| Texas | Slaughter Frazier | San Andres | Limestone/Dolomite | 10.0 | 4.0 | 4950.0 | 31.0 | 1.4 | 105.0 |
| Texas | Wasson-Willard | San Andres | Dolomite | 10.0 | 1.5 | 5100.0 | 32.0 | 2.0 | 105.0 |
| Texas | University Waddell | Devonian | Dolomite | 12.0 | 14.4 | 8500.0 | 43.0 | 0.5 | 140.0 |
| Texas | McElroy | San Andres | Dolomite | 11.6 | 1.5 | 3850.0 | 31.0 | 2.3 | 86.0 |
| Texas | Goldsmith | San Andres | Dolomite | 10.0 | 10.0 | 4200.0 | 32.0 | 1.2 | 94.0 |
| Texas | Kelly Snyder (SACROC Unit) | Canyon Reef | Limestone | 9.4 | 19.4 | 6700.0 | 41.0 | 0.4 | 130.0 |
| Texas | South Welch | San Andres | Limestone | 9.3 | 9.0 | 4890.0 | 34.0 | 2.2 | 96.0 |
| Texas | Huntley | San Andres | Dolomite | 16.0 | 5.0 | 3180.0 | 33.0 | 2.5 | 104.0 |
| Texas | South Cowden | San Andres | Carbonate | 13.0 | 3.0 | 4100.0 | 35.0 | 1.0 | 100.0 |
| Texas | Wasson (Cornell Unit) | San Andres | Dolomite | 8.6 | 2.0 | 4500.0 | 33.0 | 1.0 | 106.0 |
| Texas | Wasson | San Andres | Dolomite | 13.0 | 6.0 | 5100.0 | 33.0 | 1.0 | 110.0 |
| Texas | GMK South | San Andres | Dolomite | 10.0 | 3.0 | 5400.0 | 30.0 | 3.0 | 101.0 |
| Texas | Slaughter | San Andres | Dolomite | 10.0 | 3.0 | 5000.0 | 32.0 | 2.0 | 107.0 |
| Texas | Slaughter (East Mallet) | San Andres | Dolomite | 12.5 | 6.0 | 4900.0 | 32.0 | 1.0 | 110.0 |
| Texas | Sharon Ridge | Canyon Reef | Limestone | 10.0 | 150.0 | 6600.0 | 40.0 | 1.0 | 125.0 |
| Texas | Means (San Andres) | San Andres | Dolomite | 9.0 | 20.0 | 4300.0 | 29.0 | 6.0 | 97.0 |
| Texas | Salt Creek | Canyon | Limestone | 20.0 | 12.0 | 6300.0 | 39.0 | 1.0 | 125.0 |
| Texas | Hanford | San Andres | Dolomite | 10.5 | 4.0 | 5500.0 | 32.0 | 1.4 | 104.0 |
| Texas | Hanford East | San Andres | Dolomite | 10.0 | 4.0 | 5500.0 | 32.0 | 1.0 | 106.0 |
| Texas | West Brahaney Unit | San Andres | Dolomite | 10.0 | 2.0 | 5300.0 | 33.0 | 2.0 | 108.0 |
| Texas | East Penwell (SA) unit | San Andres | Dolomite | 10.0 | 4.0 | 4000.0 | 34.0 | 2.0 | 86.0 |
| Table Continued | |||||||||
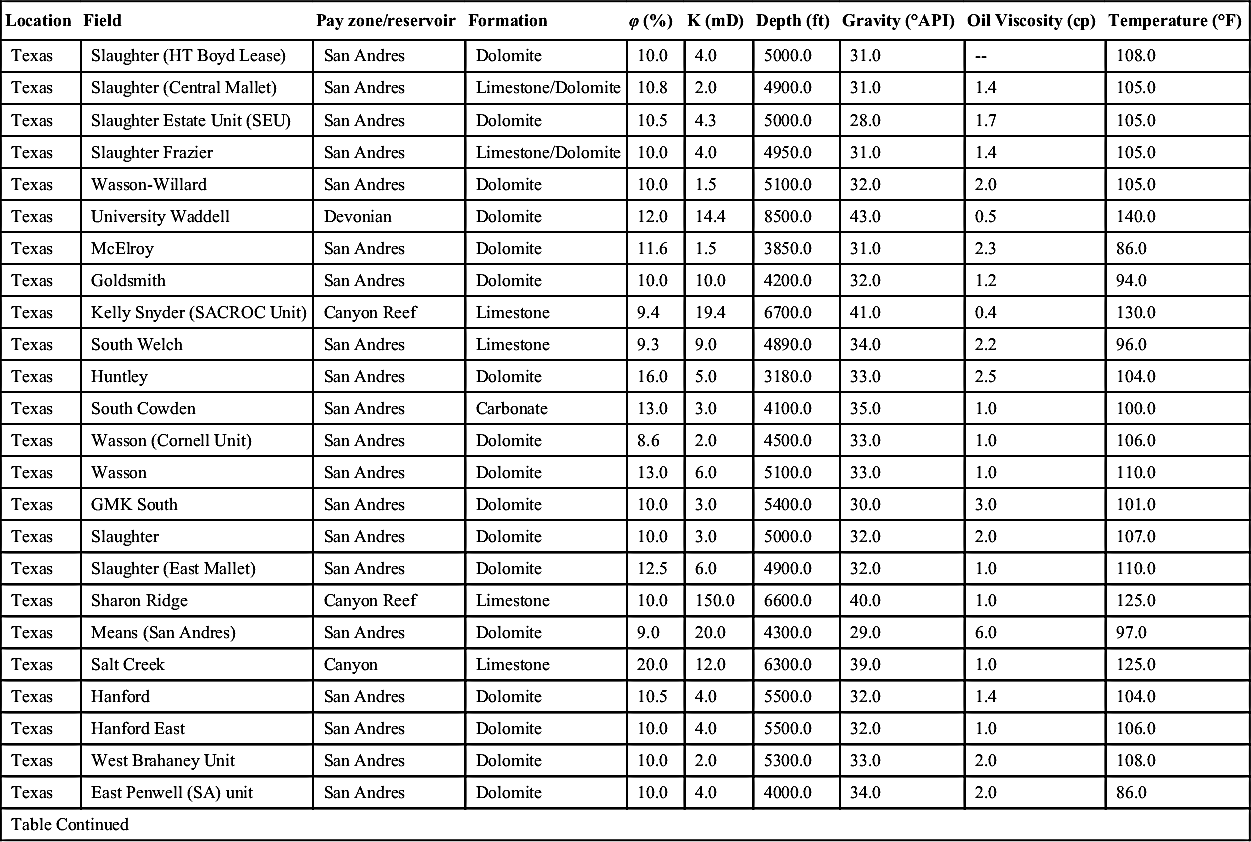
| Location | Field | Pay zone/reservoir | Formation | φ (%) | K (mD) | Depth (ft) | Gravity (°API) | Oil Viscosity (cp) | Temperature (°F) |
| Texas | Garza | San Andres | Carbonate | 18.0 | 5.0 | 3000.0 | 36.0 | 3.0 | 80.0 |
| Texas | Welch (North & south) | San Andres | Dolomite | 11.0 | 4.0 | 4900.0 | 34.0 | 2.0 | 98.0 |
| Texas | Crossett | Devonian | Limestone | 22.0 | 5.0 | 5300.0 | 44.0 | 0.4 | 106.0 |
| Texas | Wasson (Bennett Ranch) | San Andres | Carbonate | 13.0 | 10.0 | 4900.0 | 32.0 | 1.4 | 107.0 |
| Texas | Wasson (Denver Unit) | San Andres | Dolomite | 12.0 | 5.0 | 5200.0 | 33.0 | 1.3 | 105.0 |
| Texas | Wasson South | Clearfork | Carbonate | 6.0 | 2.0 | 6700.0 | 33.0 | 1.2 | 105.0 |
| Texas | Reinecke | Cisco Canyon Reef | Limestone/Dolomite | 10.4 | 170.0 | 6700.0 | 43.5 | 0.4 | 139.0 |
| Texas | Slaughter Sundown (SSU) | San Andres | Dolomite | 11.0 | 6.0 | 4950.0 | 33.0 | 1.0 | 105.0 |
| Texas | Mabee | San Andres | Dolomite | 9.0 | 4.0 | 4700.0 | 32.0 | 2.3 | 104.0 |
| Texas | Wellman | Wolfcamp | Limestone | 9.2 | 100.0 | 9800.0 | 43.5 | 0.5 | 151.0 |
| Texas | Dollarhide (Clearfork Unit) | Clearfork | Dolomite | 11.5 | 4.0 | 6500.0 | 40.0 | – | 113.0 |
| Texas | Dollarhide (Devonian Unit) | Devonian | Dolomite | 13.5 | 17.0 | 8000.0 | 39.5 | 0.4 | 125.0 |
| Texas | Sable | San Andres | Dolomite | 8.4 | 2.0 | 5200.0 | 32.0 | 1.0 | 107.0 |
| Texas | Cogdell | Canyon Reef | Limestone | 13.0 | 6.0 | 6800.0 | 40.0 | 0.7 | 130.0 |
| Texas | T-Star (Slaughter Consolidated) | Abo | Dolomite | 7.0 | 2.0 | 7850.0 | 28.0 | 1.9 | 134.0 |
| Utah | Aneth | Ismay Desert Creek | Limestone | 14.0 | 5.0 | 5600.0 | 41.0 | 1.0 | 125.0 |
| Utah | Greater Aneth Area | Desert Creek | Limestone | 12.0 | 18.3 | 5700.0 | 42.0 | 1.5 | 129.0 |
| West Virginia | Hilly Upland | Greenbrier | Limestone/Dolomite | 14.0 | 3.0 | 1950.0 | 42.0 | 1.7 | 77.0 |
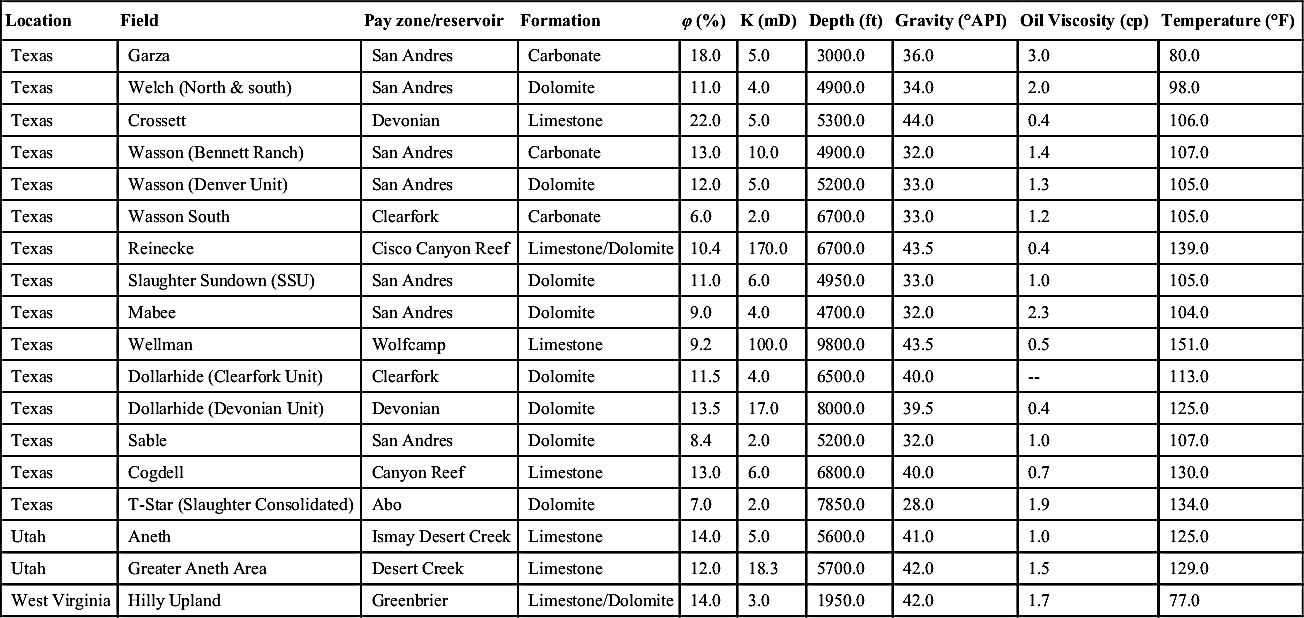
Table 4.7
In Situ Combustion Projects in Carbonate Reservoirs of the United States
| Location | Field | Pay zone/reservoir | Formation | φ (%) | K (mD) | Depth (ft) | Gravity (°API) | Oil viscosity (cp) | Temperature (°F) |
| North Dakota | Horse Creek | Red River | Dolomite | 16.0 | 20.0 | 9500.0 | 32.0 | 1.4 | 198.0 |
| North Dakota | Medicine Pole Hills | Red River B & C | Dolomite | 18.9 | 15.0 | 9500.0 | 38.0 | 1.0 | 230.0 |
| North Dakota | West Medicine Pole Unit | Red River B & C | Dolomite | 17.0 | 10.0 | 9500.0 | 33.0 | 2.0 | 215.0 |
| North Dakota | Cedar Hills North Unit | Red River | Dolomite | 16.0 | 6.0 | 8300.0 | 30.0 | 2.9 | 200.0 |
| South Dakota | Buffalo | Red River B | Dolomite | 20.0 | 10.0 | 8450.0 | 31.0 | 2.0 | 215.0 |
| South Dakota | West Buffalo | Red River B | Dolomite | 20.0 | 10.0 | 8450.0 | 32.0 | 2.0 | 215.0 |
| South Dakota | South Buffalo | Red River B | Dolomite | 20.0 | 10.0 | 8450.0 | 31.0 | 2.0 | 215.0 |
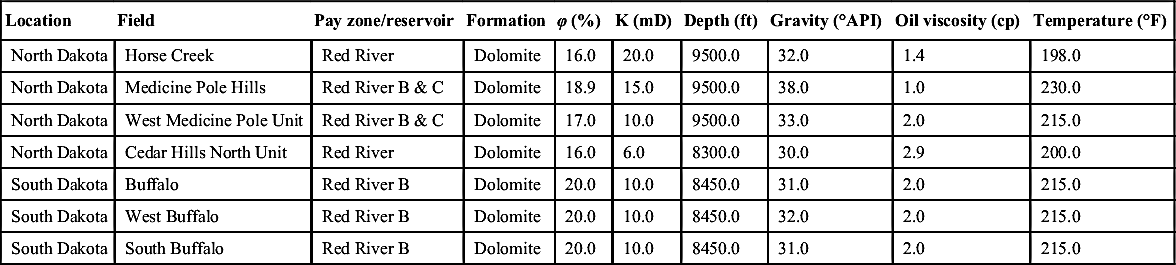
Manrique et al., 2004, 2007.
After the oil price collapse in 1990s, it has become mandatory to minimize all costs of EOR fluids. That developed a corporate attitude of using local gas and possibly use waste gas. For instance, reports indicate that CO2 floods in West Texas can be economically attractive at oil prices of $ 18/bbl assuming that CO2 prices remains less than $ 1/Mscf. Even though the rising oil prices have made any CO2 attractive, one must not give up on the scientific knowledge gained during the low-oil price era that showed that low-quality CO2 with proper design can still be technically appealing, thereby, shifting the economics of the overall project.
As mentioned previously, CO2 projects have become even more appealing because of the incentive related to greenhouse gas mitigation and sequestration. Even though the science of sequestration is flawed, it is reasonable to consider CO2 sequestration as an added bonus to CO2 projects. In addition, environmental concerns add to the argument that purified CO2 is not warranted nor is it economically prudent to do so. Latest scientific investigation shows purification of CO2 actually adds to the environmental footprint and defeats the purpose of the CO2 sequestration. With increasing benefits of environmental greening, the economics of CO2 looks the most attractive. Figure 4.40 shows an example of total costs and potential incomes of carbon capture storage projects with EOR (CO2-EOR storage).
The economics (costs and revenues) involved in a carbon capture storage project can be broken down in many ways. However, it depends on the source of CO2 (e.g., petrochemical plants vs coal-fired power plants) and where it will be injected (e.g., EOR vs saline aquifer). Assuming a scenario of CO2 capture from a coal-fired power plant, we can divide the main economic variables into four categories: CO2 capture and compression, CO2 transportation, CO2 storage (including wells and monitoring), and possible revenues (e.g., oil recovery and/or carbon credits), depending on the application (CO2 EOR vs saline aquifers). Cost shown in Figure 4.40 represents average costs obtained from a comprehensive literature review completed in 2008. However, it is important to recall that costs such as transportation and compression of CO2 will vary depending on the distance between the emission source (e.g., power plant) to the geologic sink (e.g., oil reservoir or saline aquifer) and its depth. In all, the economics become very attractive if waste gas is used.
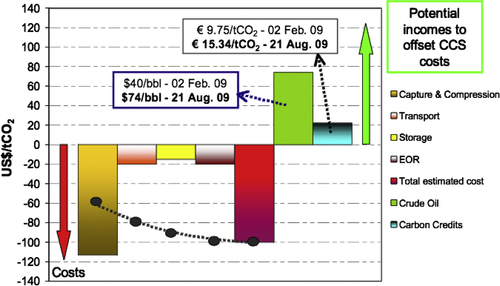
Figure 4.40 Potential benefits of coupling CO2 EOR with storage. CCS, carbon capture storage.
Overall, CO2 injection holds great promises from all aspects, namely economical, technical, and environmental. CO2 works because it combines the benefit of chemical flooding while avoiding high chemical adsorption, costs, and toxicity associated with chemical floods with the benefit of thermal flood while avoiding high costs of thermal methods.
ISC is the oldest thermal recovery method. It has been used since 1920s with many successes and failures. It was not until 1990s that one recognized that ISC is least applicable to very heavy and tar sand reservoirs, the conventional targets of the technology. It is now well recognized that ISC is more successful in lighter and carbonate reservoirs. Recently, ISC has resurfaced as HPAI, which is exclusively applied to light oil reservoirs, particularly suitable for carbonate formations. HPAI has been very successful and holds great promises in the future. At present, there are seven active air injection projects in the United States, six of them in light crude oil (>30°API) carbonate reservoirs in North and South Dakota. Horse Creek, South and West Buffalo, and Medicine Pole Hill are good examples of combustion projects in light crude oil carbonate reservoirs (Table 4.7). The success and expansion of Buffalo's and Medicine Pole Hill in North and South Dakota demonstrates the feasibility of air injection in carbonate reservoirs to improve oil recovery and revitalize mature and waterflooded fields. They confirm previous observations in ISC that neither pure oxygen nor induced combustion is necessary for the success of ISC. These projects also give us an incentive to inject waste gas along with air whenever there is a need to dispose of waste gas. These projects also demonstrate the uselessness of high pressure nitrogen injection that gained popularity in the 1990s. Those projects were abandoned because of the poor economics but HPAI shows that the injection of nitrogen is not technologically attractive either.
Currently, air injection is considered an alternative for offshore and onshore mature fields with no access to CO2 sources, specially mature fields in the Gulf of Mexico given the limitation of space available in platforms and also because CO2 injection from onshore power generation plants and industrial sources would probably not be economic in the short term. An additional benefit of air injection projects is the generation of flue gases for pressure maintenance that also can be reinjected in the same or reservoirs close by. Production results of recent air injection projects in North and South Dakota (Williston Basin) may dictate the future of this recovery method in carbonate reservoirs in the United States.
In summary, ISC or HPAI are capable of recovering additional oil because of the following facts:
1. It combines the benefit of thermal with no investment involving steam generation;
2. It produces flue gas that can induce the effect of chemical injection, similar to CO2 injection;
3. At high pressure, it induces the benefits of miscible flood;
4. Has the lowest investment cost involved in fluid purification and/or completion renovation.
Neither cyclic nor continuous steam injection has been widely used in carbonate reservoirs. The Garland Field in Wyoming and Yates Field in Texas represent two of the few steam driven projects in carbonate formations documented in the United States. Some of the steam injection projects documented in carbonate formations outside Canada and the United States include:
• Steam drive pilot at Lacq Superieur Field, France.
• Steamflood Pilot at Ikiztepe Field, heavy oil fracture reservoir in Turkey.
• Cyclic steam pilot in Cao-32 Field, fracture limestone heavy crude oil in China.
• Steamflood pilot and full-field implementation in Qarn Alam Field, Oman.
• Cyclic steam injection pilot in Issaran heavy oil field, Egypt.
• Steamflood pilot at the giant Wafra Field, Kuwait—Saudi Arabia
Injection of nitrogen, especially under miscible conditions, had been in use since 1960s through 1990s. Because of the miscibility conditions, nitrogen injection saw applications only in deep light oil reservoirs. On the other hand, nitrogen has been used also under immiscible conditions, particularly for the purpose of pressure maintenance. During the last 40 years over 30 nitrogen injection projects have been developed in the United States, some of them in carbonate reservoirs in Alabama, Florida, and Texas (Table 4.8). At the present time there are only two active nitrogen injection projects in carbonate reservoirs in the United States, the WAG in Jay Little Escambia (N2-WAG) and as a pressure maintenance project in Yates Field (Table 4.8). In the case of the N2-WAG in Jay Little Escambia, this is a mature project started in 1982, while N2 at Yates started in mid-1980s as a reservoir pressure maintenance strategy.
Recent scientific discoveries as well as the environmental impetus of CO2 has removed the focus of EOR from nitrogen toward CO2. For all practical purposes, N2 injection is an obsolete technique. Far better efficiency and economics as well as environmental integrity is achieved by injecting CO2 or using HPAI. For instance, Yates field of Texas has replaced nitrogen injection with immiscible CO2 injection with expected better recovery than nitrogen.
Both miscible and immiscible hydrocarbon gas injection schemes have been used in carbonate reservoirs. Recent Oil and Gas Journal survey indicates that all eight active hydrocarbon miscible reported projects are in sandstone reservoirs, six of them in Alaska. Table 4.9 shows eight hydrocarbon injection projects developed in US carbonate reservoirs between early 1960s to mid-1980s. Historically, natural gas injection has not been economic unless there is no other way to monetize the gas and it has to be flared. Even then, it is far better to utilize the gas in a power plant to generate electricity and capture the flue gas to reinject. Because a power plant can vary in size and capacity, this option should be examined before reinjecting gas into the reservoir. This has become even more true considering the soaring price of gas ever since the gas crisis in Europe in 2008.
Table 4.8
Miscible and Immiscible Nitrogen Floods (Continuous or WAG) in the United States Carbonate Reservoirs
| Location | Field | Pay zone/reservoir | Formation | φ % | K (mD) | Depth (ft) | Gravity (°API) | Oil viscosity (cp) | Temperature (°F) |
| Texas | Block 31 | Devonian | Limestone | 12.0 | 5.0 | 8600.0 | 46.0 | 0.3 | 130.0 |
| Alabama | Chunchula Fieldwide Unit | Smackover | Dolomite | 12.4 | 10.0 | 18500.0 | 54.0 | 0.0 | 325.0 |
| Florida | Blackjack Creek | Smackover | Carbonate | 17.0 | 105.0 | 16,150.0 | 50.0 | 0.3 | 290.0 |
| Texas | Andector | Ellenburger | Dolomite | 3.8 | 2000.0 | 8835.0 | 44.0 | 0.6 | 132.0 |
| Fla./Alab. | Jay Little Escambia Creek | Smackover | Limestone | 14.0 | 35.0 | 15,400.0 | 51.0 | 0.2 | 285.0 |
| Texas | Yates | Grayburg/San Andres | Dolomite | 17.0 | 175.0 | 1400.0 | 30.0 | 6.0 | 82.0 |
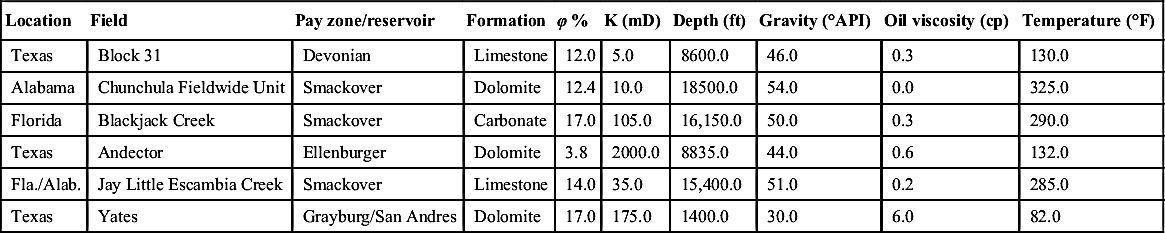
Table 4.9
Hydrocarbon Injection Projects in Carbonate Reservoirs of the United States
| Location | Field | Pay zone/reservoir | Formation | φ (%) | K (mD) | Depth (ft) | Gravity (°API) | Oil viscosity (cp) | Temperature (°F) |
| Alabama | Chatom | Smackover Lime | Dolomite | 22.0 | 12.0 | 15,900.0 | 54.0 | – | 293.0 |
| North Dakota | Carlson | Madison | Limestone | 11.0 | 0.1 | 8500.0 | 42.0 | 11.0 | 135 |
| North Dakota | Red Wing Creek | Mission Canyon | Limestone | 10.0 | 0.1 | 9000.0 | 40.0 | – | 241.0 |
| Texas | Levelland | San Andres | Dolomite | 10.2 | 2.0 | 4900.0 | 30.0 | 2.3 | 105.0 |
| Texas | Slaughter | San Andres | Dolomite | 10.5 | 4.3 | 5000.0 | 28.0 | 1.9 | 105.0 |
| Texas | McElroy | San Andres | Dolomite | 11.6 | 1.5 | 3856.0 | 31.0 | 2.3 | 86.0 |
| Texas | Fairway | James | Limestone | 12.6 | 11.0 | 9900.0 | 48.0 | – | 260.0 |
| Texas | Wolfcamp University Block 9 | Wolfcamp | Limestone | 10.2 | 14.0 | 8400.0 | 38.0 | 0.3 | 140.0 |
Steam injection has been exclusively used in heavy oil reservoirs. However, in 1990s, scientific investigation made it clear that steam has great potentials in light oil formations. However, due to low oil prices as well as relative success of simpler schemes (e.g., HPAI, CO2 injection), only few steam injection schemes saw application in light oil reservoirs. For instance, for continuous steam injection in carbonate reservoirs, only two projects are currently active in Garland and Yates fields (Table 4.10). The Garland Field (Big Horn Basin, Wyoming) steam drive was developed in the Madison limestone formation, while the Yates (Grayburg/San Andres) steamflood project has been one of several EOR projects tested in this Texas giant field.
As it was mentioned above, polymer flooding has been the most used EOR chemical method in both sandstone and carbonate reservoirs. To date, more than 290 polymer field projects have been referenced or reported in the literature. The number of polymer floods in United States peaked in 1986 with 178 active projects. Ever since the repealing of tax rebates of EOR, the number of polymer as well as chemical projects has fallen sharply. Most of the polymer floods used water-soluble polyacrylamides and biopolymers (polysaccharides and cellulose polymers) to a lesser degree. Polymer concentration of as little as 50 ppm and as high as 3.7% was reported. Related incremental oil recovery was reported to be anything from 0% to 18%. Most successful operations involved mobility control and high water cut oil reservoirs. Table 4.11 shows some of the chemical floods that have been developed in US carbonate reservoirs during the period between 1960 and 1990. Following is a summary of various chemical flooding projects. They are described here along with the lessons learnt.
4.2.7.2.1. Eliasville Caddo Unit
The Eliasville field was discovered in 1920. The field produces from the Caddo limestone at 3250–3350 ft. having approximately 40 ft. of net pay. Eliasville Caddo Unit (ECU) has a paraffinic light crude oil (39 oAPI). The main reservoir properties are shown in Table 4.11. The waterflood started in 1966 with poor results. A large polymer flood (16 well patterns, 57 producers) was proposed and started in December 1980. The polymer used was a hydrolyzed polyacrylamide (HPAM) to viscosify a fresh injection water (1200 mg/l TDS, total dissolved solids) in a reservoir with a salty connate water (165,000 mg/l TDS). The polymer was injected over a period of 34 months (December 1980 to November 1983). The viscosity of the injected polymer solution was reduced from 40 cp at the beginning to 5 cp at the end of the injection. A total of 12.9% PV (pore volume) polymer slug (30 million lbs) was injected having a good production response. Oil production increased from 375 BOPD (barrels of oil per day) (October 1981) to an all unit high of 1622 BOPD (August 1984). The cumulative HPAM injected (54 lb/acre-ft) at ECU was greater than most US polymer injection projects. Finally, polymer retention by the limestone reservoir was 50 lb/acre-ft and an estimate of 0.46 bbl of incremental oil per pound of polymer injected were reported. This value is markedly less in limestone than in sandstone.
Table 4.10
Examples of Steamfloods in carbonate reservoirs of the United States
| Location | Field | Pay zone/reservoir | Formation | φ (%) | K (mD) | Depth (ft) | Gravity (°API) | Oil viscosity (cp) | Temperature (°F) |
| Texas | Yates | Grayburg/San Andres | Dolomite | 17.0 | 175.0 | 1400.0 | 30.0 | 6.0 | 82.0 |
| Wyoming | Garland | Madison | Limestone/Dolomite | 15.5 | 10.0 | 4250.0 | 22.0 | 29.0 | 140.0 |

Table 4.11
Chemical Floods in Carbonate Reservoirs of the United States
| Location | Field | Pay zone/reservoir | Formation | φ (%) | K (mD) | Depth (ft) | Gravity (°API) | Oil viscosity (cp) | Temperature (°F) |
| Arkansas | Wesguma | Smackover | Limestone | 26.7 | 36.0 | 21.0 | 11.0 | 185.0 | |
| Illinois | Tonti | Renoist Auxvases McClusky | Limestone | 47.3 | 358.0 | 2050.0 | 39.5 | 4.0 | 83.0 |
| Kansas | Trapp | Lansing/Kansas City | Limestone | 18.4 | 150.1 | 3215.0 | 38.0 | 1.4 | 97.0 |
| Kansas | Bates Unit | Mississippi | Limestone | 15.5 | 19.7 | 3700.0 | 42.0 | 0.6 | 117.0 |
| Kansas | Harmony Hill | Lansing/Kansas City | Limestone | 12.5 | 3130.0 | 38.6 | 3.7 | 105.0 | |
| Louisiana | Old Lisbon | Pettit | Carbonate | 16.0 | 45.0 | 5300.0 | 34.9 | 2.5 | 178.0 |
| Nebraska | Dry Creek | Lansing/Kansas City | Limestone | 13.0 | 4100.0 | 31.0 | 9.0 | 120.0 | |
| New Mexico | Vacuum | San Andres | Dolomite | 10.6 | 21.0 | 4700.0 | 37.0 | 1.5 | 100.0 |
| New Mexico | Vacuum | Grayburg/San Andres | Dolomite | 11.5 | 17.3 | 4500.0 | 37.0 | 1.2 | 101.0 |
| New Mexico | Vacuum | San Andres | Dolomite | 11.6 | 8.5 | 4720.0 | 38.0 | 1.5 | 105.0 |
| North Dakota | Blue Buttes | Madison | Limestone | 9.6 | 22.0 | 9400.0 | 42.0 | 0.3 | 240.0 |
| Oklahoma | Fitts | Viola | Limestone | 13.6 | 18.5 | 3900.0 | 39.0 | 3.2 | 119.0 |
| Oklahoma | Fitts (E. Fittts Unit) | Cromwell 60, Hunton, Viola | Limestone/ Sandstone | 17.5 | 6.6 | 3250.0 | 40.0 | 4.0 | 115.0 |
| Oklahoma | Balko South | Kansas City | Limestone | 21.0 | 535.0 | 6100.0 | 40.0 | 1.8 | 125.0 |
| Oklahoma | Fitts | Cromwell, Viola, Hunton | Carbonate | 17.5 | 750.5 | 3250.0 | 40.0 | 4.0 | 115.0 |
| Oklahoma | Stanley | Burbank | Carbonate | 18.0 | 300.0 | 3000.0 | 39.0 | 105.0 | |
| Oklahoma | Osage–Hominy | Miss. Chat | Limestone | 30.0 | 27.0 | 2880.0 | 38.7 | 3.0 | 100.0 |
| Texas | C-Bar | San Andres | Dolomite | 10.0 | 6.0 | 3350.0 | 36.0 | 5.0 | 107.0 |
| Table Continued | |||||||||
| Location | Field | Pay zone/reservoir | Formation | φ (%) | K (mD) | Depth (ft) | Gravity (°API) | Oil viscosity (cp) | Temperature (°F) |
| Texas | Dune | San Andres | Dolomite | 14.0 | 28.0 | 3350.0 | 32.0 | 3.5 | 95.0 |
| Texas | Goldsmith 5600 | Clearfork | Dolomite | 15.0 | 28.0 | 5600.0 | 32.0 | 3.5 | 100.0 |
| Texas | McElroy | Grayburg | Dolomite | 13.0 | 37.0 | 2800.0 | 32.0 | 2.7 | 88.0 |
| Texas | Garza | San Andres | Limestone | 19.8 | 4.1 | 2900.0 | 36.0 | 2.5 | 90.0 |
| Texas | Westbrook | Clearfork | Dolomite | 7.4 | 6.3 | 3000.0 | 26.0 | 9.1 | 90.0 |
| Texas | Lucy N. | Pennsylvanian | Limestone | 9.7 | 30.0 | 7640.0 | 40.0 | 0.4 | 140.0 |
| Texas | Salt Creek | Canyon Reef | Limestone | 12.0 | 13.2 | 6300.0 | 39.2 | 0.9 | 129.0 |
| Texas | Stephens County Regular | Caddo (ECU) | Limestone | 13.2 | 9.0 | 3200.0 | 39.0 | 2.7 | 113.0 |
| Texas | Slaughter | San Andres | Dolomite | 11.2 | 6.0 | 5000.0 | 31.0 | 1.5 | 110.0 |
| Texas | S. Robertson | Glorieta/Clearfork | Dolomite | 7.9 | 38.6 | 5800.0 | 34.0 | 1.0 | 107.0 |
| Texas | Cogdell | Canyon Reef | Limestone | 9.6 | 5.0 | 6800.0 | 41.7 | 0.6 | 128.0 |
| Texas | Levelland | San Andres | Dolomite | 10.0 | 0.6 | 4720.0 | 30.5 | 1.5 | 107.0 |
| Texas | Cowden North | Grayburg/San Andres | Lime./Dolomite | 10.1 | 3.6 | 4450.0 | 34.0 | 1.6 | 94.0 |
| Texas | Mabee | San Andres | Dolomite | 10.5 | 1.6 | 4700.0 | 32.0 | 2.4 | 106.0 |
| Texas | Jordan | San Andres | Dolomite | 10.5 | 6.0 | 3600.0 | 34.0 | 2.8 | 95.0 |
| Texas | McElroy | Grayburg/San Andres | Dolomite | 11.0 | 5.0 | 3000.0 | 32.0 | 2.6 | 95.0 |
| Texas | Penwell | San Andres | Dolomite | 11.0 | 2.2 | 3800.0 | 32.0 | 4.5 | 108.0 |
| Texas | Herris | Glorieta | Dolomite | 8.6 | 3.0 | 5818.0 | 30.8 | 3.1 | 115.0 |
| Texas | Dollarhide (Clearfork) | Clearfork | Dolomite | 11.6 | 8.5 | 6500.0 | 37.0 | 0.6 | 110.0 |
| Texas | South Cowden | Grayburg | Dolomite | 13.0 | 3.1 | 4500.0 | 34.0 | 3.5 | 103.0 |
| Texas | Smyer | Clearfork | Carbonate | 8.3 | 10.5 | 5900.0 | 27.0 | 5.0 | 112.0 |
| Texas | North Riley | Clearfork | Carbonate | 7.7 | 12.0 | 6300.0 | 32.0 | 2.6 | 104.0 |
| Texas | Salt Creek | Canyon Reef | Limestone | 12.0 | 20.0 | 6500.0 | 39.0 | 6.0 | 130.0 |
| Table Continued | |||||||||
| Location | Field | Pay zone/reservoir | Formation | φ (%) | K (mD) | Depth (ft) | Gravity (°API) | Oil viscosity (cp) | Temperature (°F) |
| Texas | Headlee North | Headlee North | Limestone | 4.1 | 0.3 | 12000.0 | 47.0 | 0.7 | 190.0 |
| Texas | Foster | San Andres | Dolomite | 12.0 | 5.8 | 4200.0 | 34.0 | 1.2 | 101.0 |
| Texas | Wichita County Reg.a | Gunsight | Carbonate | 22.0 | 53.0 | 1750.0 | 42.0 | 2.2 | 89.0 |
| Texas | Stephens County Regular | Caddo Lime | Limestone | 14.5 | 12.0 | 3200.0 | 40.0 | 2.3 | 106.0 |
| Texas | Bob Slaughter Blocka | San Andres | Dolomite | 12.0 | 5.9 | 5000.0 | 31.4 | 1.3 | 109.0 |
| Texas | Robertson | Clearfork | Carbonate | 7.8 | 2.0 | 6450.0 | 34.0 | 1.1 | 110.0 |
| Texas | Sand Hills | Tubb | Carbonate | 12.0 | 27.0 | 4500.0 | 35.0 | 2.5 | 148.0 |
| Texas | McCamey | Grayburg-San Andres | Carbonate | 14.0 | 18.0 | 2100.0 | 26.0 | 28.0 | 80.0 |
| Texas | Keystone | Colby | Dolomite | 12.0 | 5.0 | 3300.0 | 37.0 | 6.0 | 87.0 |
| Utah | Aneth Unit | Paradox | Limestone | 10.6 | 18.3 | 5300.0 | 47.0 | 0.6 | 134.0 |
| Wyoming | Byron | Embar/Tensleep | Limestone/Sand. | 13.9 | 41.3 | 5600.0 | 23.0 | 17.0 | 121.0 |
| Wyoming | Grass Creek | Phosphoria | Carbonate | 21.6 | 20.0 | 4300.0 | 24.0 | 15.0 | 105.0 |
| Wyoming | Oregon Basin | North Embar | Limestone | 20.2 | 68.0 | 3370.0 | 22.5 | 9.8 | 108.0 |
| Wyoming | Oregon Basin | South Embar | Limestone | 19.5 | 39.0 | 3600.0 | 20.9 | 15.7 | 110.0 |
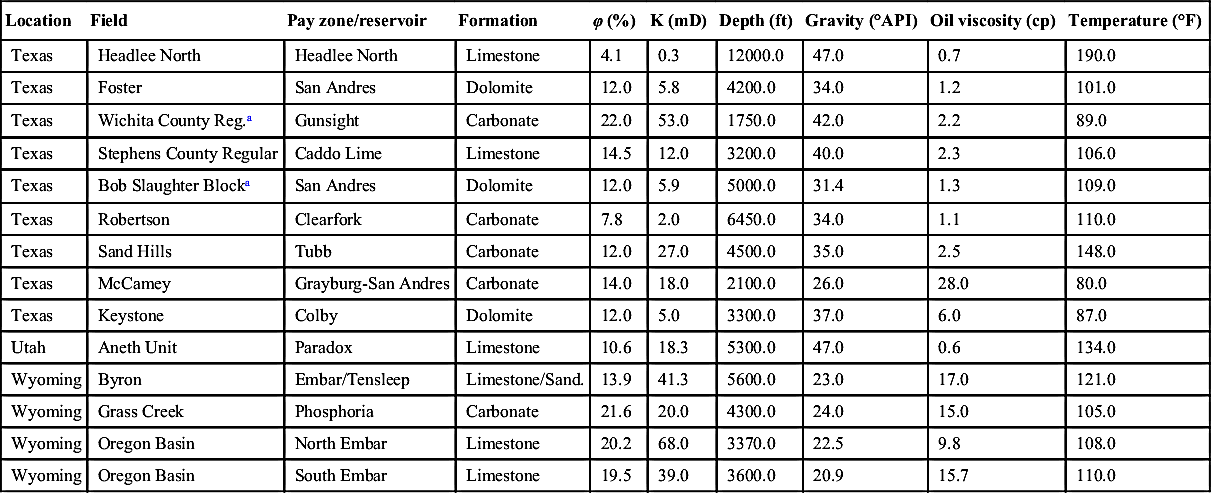
4.2.7.2.2. Byron Field
Embar-Tensleep oil was discovered in Byron (Big Horn Basin, Wyoming) in 1929. The Embar and Tensleep reservoirs are limestone and sandstones formations, respectively. The waterflood operation began in 1974. In December 1982, the polymer flood started as a strategy to improve waterflood sweep efficiency. The project area covered 1500 acres with 36 injectors and 47 producers. The polymer flood was concentrated in Tensleep, where most of the oil field reserves are. Successful operations, however, were mainly in carbonate formations. The Embar formation is a limestone/dolomite reservoir with an average pay zone of 22 ft with a crude oil of 23 oAPI. Major reservoir properties are listed in Table 4.11. The polymer flood at the Byron field considered a tapered sequence of three slugs of 10% PV each starting with partially hydrolyzed polyacrylamide (PHPA) solutions of 1000 ppm, 600 ppm and 330 ppm, followed by the drive water. The polymer flood ended on December 1, 1985 after the injection of 0.37 PV of polymer. The project has significantly improved oil recovery measured by total field production and water–oil ratio.
4.2.7.2.3. Vacuum Field
The Vacuum (Grayburg, San Andres) Field (New Mexico) was discovered in 1924. Production on the Phillips' Hale and Mable leases started in 1939. Grayburg is a dolomitic formation with an average net pay of 148 ft for the 320 acres of both leases. Water injection was initiated in May 1983 and polymer injection started three months later (August 1983). The Hale-Mable leases are one of three polymer floods developed at the Vacuum Field. Particularly PHPA polymer solution started in late August 1983. Polymer solutions were prepared with fresh water (387 ppm TDS) produced from the Ogallala formation. Although the injection was to be performed increasing polymer concentration from 50 ppm to 200 ppm, the polymer slug was kept at 50 ppm due to an underestimated injectivity reduction (from 13,000 to 10,000 BWPD). The original plan considered the injection of 15% PV of a 200-ppm polymer solution (676,000 lbs of active polymer) over a period of two years. However, the project was developed considering a total injection rate of 10,000 BWPD (12 injectors) of a polymer solution of 50 ppm until the end of 1984 (16 months). During this period of time, production peaked and remained almost constant at 3500 BOPD (14 producers) and 1985 production started to decline and an increase of water production was reported. The polymer floods at the Hale and Mable leases were declared as successful projects in terms of increasing ultimate oil recovery. Finally, a polymer retention/absorption of 94.5 lbs/acre-ft was reported based on laboratory experiments. This value is much less than conventional estimate of field trials.
Micellar polymer flooding, also known as SP flooding, has been the second most used EOR chemical method in light and medium crude oil reservoirs in the United States up until the early 1990s. However, reported field projects are relatively low in comparison with polymer floods. Until 1990 at least 30 field micellar polymer floods have been referenced or reported in the literature. Although this recovery method was considered as a promising EOR process since the 1970s, the high concentrations and cost of surfactants and co-surfactants, combined with the low oil prices during mid-1980s limited its use.
In most of the field cases reviewed the type of surfactants used in micellar polymer floods were petroleum sulfonates and synthetic alkyl sulfonates, which usually requires the use of co-surfactants (non-ionic surfactants) or co-solvents, mostly alcohols. Additionally, to reduce potential surfactant-formation brine incompatibilities and potentially reduce chemical adsorption in some cases a preflush of fresh water was required. Water-soluble polyacrylamides have been the most common polymer used in these projects with a few cases using biopolymers. Although some projects reported significant oil recoveries (Loudon, Big Muddy, Henry West, and Bingham), oil recoveries were less than expected. This is because scaling of chemical processes are very difficult and laboratory models show only greatly exaggerated oil production and greatly marginalized surfactant retention. Such difficulty arises from improper time scaling of chemical flood experiments.
Few of numerous chemical injection projects have used micellar polymer flooding (Table 4.11). They are Wesgum Field (Arkansas), Wichita County Regular and Bob Slaughter Block in Texas. The Bob Slaughter Block Lease (BSBL) is a San Andres dolomite reservoir. This lease is under production since late 1930s with waterflooding operation starting in the 1960s. The BSBL reservoir is at a depth of 5000 ft and has a reservoir temperature of 109 °F. The reservoir thickness is about 100 ft and contains a crude oil of 31 oAPI. The first surfactant pilot test reported in this reservoir was in 1974 and, based on those results, two micellar polymer pilots were developed in the early 1980s. Micellar polymer formulations were based on petroleum sulfonates. Water injection at the first well-pair test (86 ft well spacing) started in April 1981. Surfactant injection commenced on August 26 and consisted in an emulsion formulation containing a mixture of petroleum sulfonates and an alkylaryl ether sulfate as a solubilizer. A total of 12,846 bbl of surfactant was injected in a period of 171 days (February 1982). The surfactant slug was followed by the biopolymer slug (1000 ppm) dissolved in fresh water from the Ogallala formation. The polymer injection finished on July 16 (5840 bbl) continuing with the injection of fresh water until November 8, 1983 when the injection was switched to field brine. The pilot reported high recovery efficiency (77%) with a low retention of surfactant and polymer. About 65% and 55% of surfactant and polymer were recovered, respectively. With regard to the second well-pair pilot test (101 ft well spacing), brine injection began on April 21, 1981. The injection of the non-emulsion surfactant system started at the end of July 1982. The surfactant formulation consisted of a mixture of petroleum sulfonates and an alkyl ether sulfate solubilizer. The surfactant injection ended in late September after injecting 5058 bbl over 61 days at an average of 83 bbl/day. The surfactant slug was immediately followed by the polymer injection (1,000 ppm) for 45 days at an average injection rate of 72 bbl/day. Fresh water injection continued after the end of the polymer slug until November 1983, switching to the injection of field brine. Although oil recovery efficiency (43%) was lower than the previous well-pair pilot test, results were considered promising. Surfactant and polymer retention were also low, 41% and 58% of the chemical additives were recovered, respectively.
ASP combines the key mechanisms from each of the EOR chemical methods. Generally, ASP formulations use moderate pH chemicals such as sodium bicarbonate (NaHCO3) or sodium bicarbonate (Na2CO3) rather than sodium hydroxide (NaOH) or sodium silicates. Main functions of alkaline additives are to promote crude oil emulsification and increase ionic strength decreasing IFT and regulating phase behavior. The alkaline additives also help to reduce the adsorption of anionic chemical additives by increasing the negative charge density of mineral rocks and at the same time making the rock more water-wet. Thus, the use of alkaline agents contributes to reduce the surfactant concentrations making ASP formulations less costly than conventional micellar formulations. With regard to the surfactants; the most common products that have been used are petroleum sulfonates. The main function of the surfactants is to reduce IFT between the oil and the injected aqueous formulation. The injected surfactants may sometimes form mixed micelles (at the oil–water interface) with in situ natural surfactants, broadening the alkali concentration range for minimum IFT. On the other hand, the polymer (usually polyacrylamides) is used to reduce water mobility and sweep efficiency by increasing the solution's viscosity and decreasing effective solution permeability when it is adsorbed onto the formation.
ASP flooding is an oil recovery method that has traditionally been applied to sandstone reservoirs and until now no field tests in US carbonate reservoirs have been reported in the literature. Not surprisingly, ASP has been a failure in the field trials despite numerous laboratory tests that showed it to be effective. Once again, the problem lies within improper scaling of chemical flooding (Taylor et al., 1990; Islam and Farouq Ali, 1990).
Surfactant injection is the only chemical method used recently as a well stimulation and wettability modification of carbonate reservoirs. In fractured reservoirs, spontaneous water imbibitions can occur from the rock matrix into fractures. Subsequently, this mechanism leads to oil drainage from the matrix towards the fracture network, making surfactants attractive to improve oil recovery in oil-wet carbonate reservoirs by changing rock wettability (to mixed/water-wet) and promoting the imbibition process.
Although surfactant or micellar flooding field projects in carbonate reservoirs are not currently reported in the United States, surfactant injection has been tested in carbonate reservoirs as chemical stimulation methods (Huff & Puff) in the Cottonwood Creek and Yates fields. The Yates Field (Texas) was discovered in 1962. The Yates San Andres reservoir is a naturally fractured dolomite formation and several EOR methods have been evaluated in this prolific field with a cumulative production over 1.3 billion bbl of a 30 o API crude oil. San Andres is a 400-ft thick formation with average matrix porosity and permeability of 15% and 100 mD, respectively (Table 4.12). Marathon Oil Co. started dilute surfactant well stimulation pilot tests in the early 1990s. Surfactant slugs were injected into the oil water transition zone considering single and multi-well injection strategies. Once the surfactant slug was injected the well was shut in (soak time) for a brief period of time. The well was returned to production increasing the recovery of oil mainly due to the reduction of IFT, gravity segregation of oil, and water between the fractures and the matrix, and wettability alteration, although to a lesser extent. The surfactant used in Yates pilots was a non-ionic ethoxy alcohol. The surfactant solutions injected were prepared with produced water in high concentrations (3100–3880 ppm), well above the critical micelle concentration (CMC). Field results were reported as economically encouraging. As an example, the average oil production rate for one of the pilot wells increased from 35 to 67 bbl/day with an incremental of 17,000 bbl.
Another example is the Cotton Creek Field. It is located in the Bighorn Basin of Wyoming. Cottonwood Creek is a dolomitic class II reservoir. Class II reservoirs have low matrix porosity and permeability. The matrix provides some storage capacity and the fractures provide the fluid flow pathways. Typically, these types of reservoirs produce less than 10% of the OOIP by primary recovery and exhibit low additional recovery factors during waterflooding. Cottonwood Creek produces from the dolomitic Phosphoria formation. Reservoir thickness varies from 20 to 100 ft and average porosity and permeability of 10% and 16 mD, respectively (Table 4.12). The reservoir produces a sour 27 oAPI crude oil.
Continental Resources Incorporated started, in August 1999, single well surfactant stimulation treatments at Cottonwood Creek. Well treatments consider the injection of 500 to 1500 bbl of a surfactant solution slug depending on the perforated interval. Typically the injection period takes 3 days and the shut-in period (soak time) about a week. Surfactant solutions were prepared using the non-ionic poly-oxyethylene alcohol at a concentration of 750 ppm, almost twice the CMC. Initial well treatments considered an acid cleanup with HCl (15%) to remove iron sulfide (FeS) from the wellbore to avoid or reduce surfactant adsorption. However, production results were below expectations. The initial results led to the elimination of the acid pretreatment and the increase of the surfactant concentration to 1500 ppm (to allow for potential losses by adsorption to FeS) in subsequent surfactant stimulations. The response has been mixed. Wherever successful, the success has been attributed to alteration of wettability.
Table 4.12
Examples of Chemical Floods in Carbonate Reservoirs of the United States (during 1990–2000)
| Location | Field | Pay zone/reservoir | Formation | φ (%) | K (mD) | Depth (ft) | Gravity (°API) | Oil viscosity (cp) | Temperature (°F) |
| Texas | Yates | San Andres | Dolomite | 15.0 | 100.0 | 1400.0 | 30.0 | 6.0 | 82.0 |
| Wyoming | Cottonwood Creek | Phosphoria | Limestone | 10.4 | 16.0 | 7900.0 | 30.0 | 2.8 | 150.0 |

Overall, chemical flooding holds promises in carbonate reservoirs. However, for a project to be technically, environmentally, and economically sustainable, synthetic chemicals must be avoided. If injection fluid selection is based on waste chemicals or readily available chemicals, rather than synthetic chemicals, the overall project becomes attractive. Unlike sandstone formations, carbonate formations are less vulnerable to high rate of adsorption. However, injectivity is low in carbonate formation and most injected fluid will travel through fractures. With careful selection of cheap injection fluids, one can design a chemical flood project to maximize invasion of unflooded zones. Because certain chemicals can alter the wettability, there is significant possibility of reducing rock wettability. However, such change cannot be invoked with economic benefits if the chemical in question is purchased. As discussed before, waste chemicals or naturally occurring chemicals hold the only promise of a successful chemical flooding scheme.
4.2.8. Offshore EOR
The situation in offshore fields represents a different and very challenging situation. Major offshore discoveries concentrate at water depths beyond 1200 m. The latter, of course, narrows down the number of possible EOR alternatives, mainly focusing on reservoir management optimization choices, combined with well architectures such as horizontal or highly deviated wells to yield maximum return from those fields. Only recently, EOR projects are being considered for offshore applications.
Since waterflooding is the main offshore activity in Brazil, water management becomes an important issue. By 2002, 12 fields were under water injection, mainly for pressure maintenance, while for other seven, water injection plans were underway. From the 888,000 BWPD injected by 2005, and 330,000 BWPD produced, it was expected that roughly 3,145,000 BWPD will be injected by 2006. Several problems are associated with water injection. Lost of injectivity is an impairing problem because of the subsea wells completions that tend to dominate production schemes in the Brazilian offshore. Intervention for stimulation purposes in injection wells becomes rather expensive, requiring floating rigs. Several alternatives to alleviate water management problems have arisen. Open-hole completion in water injectors has been successful, but remedial activities for water diversion are then difficult. Raw water injection (or lower quality water) above the fracture threshold has been put forth as a serious option, and Petrobras PRAVAP program has dedicated efforts in this direction (PRAVAP is Petrobras corporative technology program that covers all aspects of the EOR activity, including monitoring programs such as time-lapse seismic). Another issue, now for producer wells, is inorganic salt deposition, mainly Barium and Strontium sulfates.
Offshore heavy oil reservoirs (API gravity lower than 19 and/or oil viscosity greater than 10 cp at reservoir conditions) are a challenge for operators in Brazil. The current proposed alternative would be cold production through high productivity wells (long-reach extended horizontal wells), plus associated water injection. Well-planned well architectures to delay/minimize water production and increase sweep efficiency are being proposed to make exploitation feasible. However, no more than 20% recovery factor is expected at present. Some of these projects are described below.
Albacora is one of the offshore giant fields, contains an estimated STOIIP (stock tank oil initially in place) of 4.4 billion bbl (by 1989, time of the development plan) at water depths ranging from 230 m up to 1900 m. The field was expected to develop in three phases for a peak production of 288,000 BOPD from 188 completed wells. The idea being to prepare exploitation phases for successively deeper water, as technology development and learning curves required progress. This is the tendency in offshore operations in the Campos Basin, because water depths grow substantially reaching ultradeep waters in some of the new discoveries.
Seven oil reservoirs were detected: Namorado (typical Cretaceous turbiditic sandstone in Campos Basin), and Eocene, Oligocene 1, Oligocene 2, Oligocene 3, Oligo-Miocene and Miocene, Tertiary. Namorado is a representative turbidite in the Brazilian offshore, like Brent for the North Sea, present in many of the Campos Basin reservoirs. At the time (1989), the field represented 10% of Brazilian STOOIP and 15% of Campos Basin STOOIP.
Phase I comprised the production of six exploratory wells, at water depths ranging from between 252 and 419 m. At the time, oil and gas production reached 33,000 BOPD and 430 m3/day, respectively. Phase II would add 95 wells, completed in Namorado, Eocene and Oligocene 1, 2, and 3 reservoirs, and a few in Miocene and Oligo-Miocene units, to gather information. Thirty nine injectors will be activated. This phase was divided in two steps. First, all possible alternatives and economical screening was used. The remaining cases were then optimized.
The challenge for developing offshore deep water oil fields led to a paradigm that differs from the 1970s and 1980s view, when closely spaced vertical wells was the way to go. This is something that characterizes most of the onshore developments and early cases in the offshore, such as Namorado Field, in relatively shallow waters. In the new scenario, with a need to reduce the number of wells, largely spaced or multilateral wells are required. Another important challenge was to describe some of the internal heterogeneities of turbiditic reservoirs. Although facies can be described from cores, scarce information is available for interwell areas. One feature of Campos Basin turbidities is the lack of outcrops that would facilitate the finding of analogues.
To illustrate the internal complexity of some offshore reservoirs that may have an impact on EOR activities, one can cite the example of the turbiditic reservoir Albacora, identified with the Namorado sandstone, a Cretaceous in age sediment. A relatively detailed stratigraphic description of Namorado sequences is reported. From the point of view of dynamics, calcite cementation (1–53 vol%) is the most important porosity and permeability control of the Namorado sandstone, which range 1.8% < f < 32% and 0.1 < K < 1624 mD.
At this time, more than 50% of the Brazilian oil production came from the offshore fields at water depths over 1000 m. By 2001, Marlim Field was producing 85,000 m3/day (535,000 BOPD), from 60 producers and 32 water injectors. This medium oil field presents excellent petrophysical properties and good vertical communication. The oil is sub-saturated, with viscosity values between 4 and 8 cp. This combination of properties makes water pressure maintenance an efficient process. However, paraffin deposition in flowlines represents a problem for Marlim Field. To sustain the roughly 540,000 BOPD, 640,000 BWPD were being injected. The recovery factor by 2001 reached 7.2%.
Pressure maintenance is carried out by injecting seawater in an alternate line drive pattern in the oil leg. Due to good reservoir properties and high vertical permeability, water injection tends to be stable, and hence efficient in the Marlim complex. Although water injection is the only EOR process used in the Marlim Complex, polymer injection and WAG have been studied alternatives, but not implemented.
Several EOR projects are underway in offshore North Sea. They will be discussed under field case studies. It is interesting to advance the idea that CO2 flooding has been given serious consideration in offshore environments. An example of a detailed study is associated with the Forties Field. The field is located 170 km northeast of Aberdeen. Significant incremental could, in principle, be obtained in a process like this. Internal complexities of turbiditic reservoirs must be resolved in order to mitigate uncertainties in this depositional environments.
Figure 4.41 Examples of EOR in offshore fields: (a) North Sea EOR Projects (From Awan et al., 2008) and, (b) EOR Opportunities Offshore Malaysia. (From Samsudin et al., 2005)
Figure 4.41 shows the statistics of oil recovery projects in the North Sea as well as EOR opportunities in offshore Malaysia. In this figure, SWAG stands for simultaneous water alternating gas injection whereas FAWAG stands for foam assisted-WAG.
The main task so far surrounds the placement of the injection well. Figure 4.42 shows one such configuration.
Figure 4.42 Placement of injection well strategically is the most important task in offshore developments.
After placement, proper strategies involve selection of SWAG or WAG. From Figures 4.43a and 4.43b, it can be seen that case C had better performance in terms of residual oil recovery for both SWAG and WAG. The main difference in implementing the two techniques is related to the pressure profile of the reservoir. When SWAG injection is considered, the pressure profile for the case C lies between 250 and 290 bar, instead WAG injection pressure profile decrease rapidly with time, achieving the minimum pressure value of 220 bar approximately for case C and the minimum pressure values for cases different from case C are below 220 bar.
Figure 4.43a Field pressure of SWAG with low injection rate. From Nangacovie, 2009.
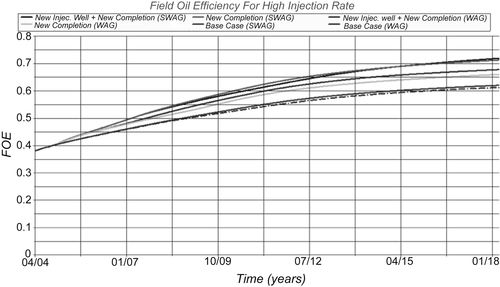
Figure 4.43b Comparison between WAG and SWAG in North Sea formation. From Nangacovie, 2009.
Figure 4.44 shows oil production in the U.S. Gulf of Mexico in shallow and deep waters since 1990 and the forecast until the year 2013. Gulf of Mexico oil production is mainly supported by water and/or gas injection.
Mexico is another example of offshore reservoir production supported by gas injection, bottom water drive, and/or water injection. Regarding gas injection, it is important to note that Cantarell/Akal represents the largest N2 injection project in the world.
Similar to previous examples, most offshore environments are under continuous optimization strategies of gas and waterflooding to extend field production life and maximize oil recovery.
4.2.9. Microbial Enhanced Oil Recovery
Microbial enhanced oil recovery (MEOR) has received a great deal of attention over last few decades. However, the field application in the United States has not been very successful, and very little oil production has been attributed to MEOR. In this regard, Russia has implemented several MEOR projects with more success. Canada has reported the use of microbes for plugging water-producing zones (Jack et al., 1991). Despite extensive background laboratory work, the project was a failure because of scaling up problems. It was not later that it was discovered that linear model results could not be used directly to design a field project. It was found that the same strain of bacteria reduces permeability in a linear core significantly while making practically no difference for a three-dimensional system. Microbial EOR has enjoyed significant scientific research and it is time that some of the engineering problems associated with the scheme be addressed before field implementation.
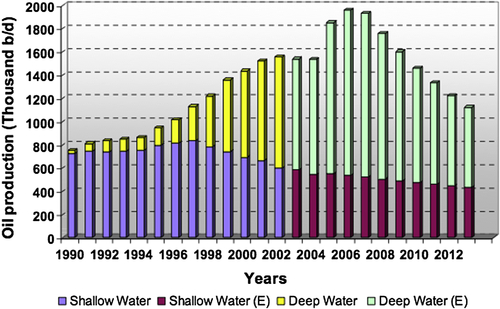
Figure 4.44 Historic and forecast oil production rates of U.S. Gulf of Mexico shallow and deep water projects. E = Estimated. From MMS, 2005.
One specific aspect of MEOR appears to be unexplored—the possibility of using thermophilic bacteria along with hot water injection. Hot water alone can reduce oil viscosity significantly (Islam et al., 1992). If thermophilic bacteria are added, additional improvement can be caused due to decomposition of inorganic carbonates, evolution of viscosity-reducing gases, and IFT reduction with surface active bio-agents. Al-Maghrabi et al. (1999) have conducted some preliminary studies with this scheme. This study also opens up prospects of using bacteria in combination with other EOR techniques, such as surfactant-water flooding and others. In the combined process, it is important to ensure that the selected surfactant is compatible with the bacteria to be used (Sundaram et al., 1994). It is possible that the strain of bacteria will eventually use the surfactant as a nutrient that can add synergy to the system.
4.3. Carbon Sequestration Enhanced Gas Recovery
It was discussed earlier that EGR has great potentials, despite being ignored as a commercial project. It is also presented that Alberta's CO2 backbone template includes EGR as part of overall CO2 sequestration and oil and gas recovery. This section presents further discussion on EGR.
It has been recognized for decades that depleted natural gas reservoirs are promising targets for carbon dioxide sequestration. However, the same reservoirs are not devoid of methane. In addition, the possibility of using CO2 sequestration to EGR should be investigated.
The carbon sequestration enhanced gas recovery (CSEGR) process consists of collecting CO2, for example, by scrubbing CO2 from flue gases at fossil-fueled power plants or collecting by-product CO2 from refineries, pressurizing the CO2 to supercritical conditions for transport in a pipeline, transporting the CO2 to a depleted natural gas reservoir, injecting the CO2 into the reservoir, and enhancing the production of CH4 from the reservoir. After some period of enhanced CH4 recovery, the production wells would be sealed and the reservoir would be filled with CO2 up to initial reservoir pressure. The injected CO2 would then be sequestered in the gas reservoir just as CH4 was stored over geologic time prior to its production as an energy resource. A schematic illustrating the CSEGR process for a gas-fired power plant is shown in Figure 4.45.
Even though depleted natural gas reservoir is cited above, the technique equally applies to active gas reservoirs. The use of a power plant is a quick utilization natural gas. Depending on the size of the reservoir or the overall flow rate, the utilization scheme can be any other potential use, such as fertilizer, cement factory, etc. The idea is to maximize the value addition of the natural gas.
The flue gas typically is processed in order to capture high-quality CO2. Once again, purification of CO2 does not need to be carried out as most reservoirs are amenable to reinjection of low-quality CO2 that will offer similar benefit as pure CO2 but without having to spend more on CO2 purification. As discussed earlier, purification with expensive and toxic solvents actually increases the footprint of the process, thereby, defeating the purpose of CSEGR.
During the injection process, following factors must be considered:
1. injectivity of CO2 in a gas reservoir;
2. effects of CO2 injection pressure on injectivity and flow;
3. cooling around the injection well due to phase change and Joule-Thomson effects;
4. flow of CO2 within the reservoir;
5. mixing of CO2 and CH4 in the reservoir; and
6. repressurization and production of CH4.
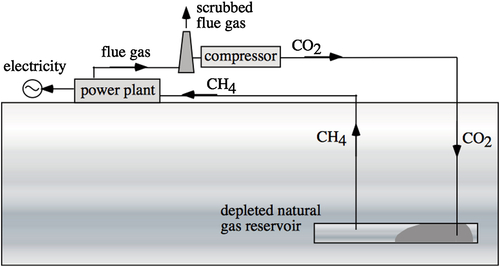
Figure 4.45 Various components of CSEGR.
Conventionally, CO2 is injected under supercritical conditions. This has implication on the design of compressor. The supercritical condition is also subject to strong cooling at the injection port due to (1) flashing of supercritical liquid-like CO2 to gas, and (2) Joule-Thomson cooling as the CO2 gas expands in the low pressure reservoir. In addition, the injected CO2 dries the formation, another potential heat consuming process. Given that the formation and residual gas and liquid are at somewhat elevated temperature (T > 40 °C), heat will be available for the expanding gas. Eventually however, the temperature around the well may become quite low leading to the possibility of hydrate formation and associated decreases in injectivity. Pure carbon dioxide hydrate can form at approximately 0 °C at 20 bar pressure (Haneda et al., 2000).
Assuming there is sufficient permeability, the injected CO2 should flow in the reservoir due to pressure gradient and gravitational effects. If there is liquid CO2 immediately around the wellbore, it will flow strongly downward through the gas reservoir due to its large density. Such gravity segregation must be accounted for during considerations of the well placement in a structurally inclined formation. It is preferable that high pressure CO2 be injected through a structurally lower well so that gravity stabilization of the front takes place. Once flashed to gas, CO2 is also notably denser than CH4 at all relevant pressures (see Figure 4.46) and will tend to flow downwards, displacing the native CH4 gas and repressurizing the reservoir. Because CO2 gas is more viscous than CH4 (see Figure 4.47), the displacement will be stable.
The reservoir processes of CO2 injection and enhanced CH4 production are shown schematically in Figure 4.48. As observed in the figure, CO2 injection can deflect the water table, giving rise to repressurization at a large distance from the injection well. CO2 can be used effectively to minimize water coning. Selection of injection well should be made in such a way that water coning is minimized while gas mobilization and displacement are maximized. Heterogeneity in the formation may lead to preferential flow paths for the injected CO2. This phenomenon may be favorable for injectivity and carbon sequestration in that it allows greater amounts of CO2 to be injected. However, preferential flow may lead to early breakthrough and is therefore detrimental to EGR. Furthermore, the development of larger gas composition gradients and subsequent mixing by molecular diffusion is enhanced by preferential flow.
Heterogeneity in the gas reservoir plays a dual role during CO2 injection. CO2 gains access to high permeability zones, thereby increasing injectivity. On the other hand, heterogeneity may lead to channeling or fingering, which would lead to early breakthrough. This case can be alleviated by reducing the injection pressure or by using horizontal well for gas injection. In case there is a dip, CO2 should be injected through the lower section of the reservoir in order to take advantage of gravity.
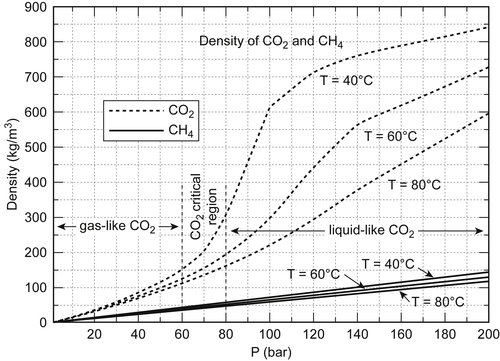
Figure 4.46 Density of CO2 and CH4 as a function of pressure for various temperatures.
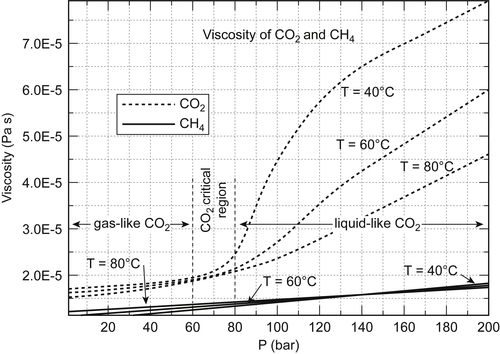
Figure 4.47 Viscosity of CO2 and CH4 as a function of pressure for various temperatures.
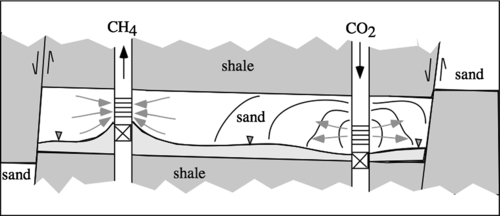
Figure 4.48 Crosssection of the CSEGR site.
Prior reservoir simulation studies show favorable results for CSEGR in terms of the feasibility of reservoir repressurization and enhanced production of CH4. While simulations demonstrate that reservoir heterogeneity promotes early breakthrough, standard techniques for controlling preferential flow may be used in the field where required. Our simulations for a particular system, combined with the inherently favorable attributes of CO2 in general, such as a comparatively high density and viscosity, suggest that CSEGR is feasible. Further progress in evaluating the feasibility of CSEGR requires field testing. We propose a phase I field test to investigate the reservoir processes involved in injecting high-pressure CO2 into depleted natural gas reservoirs. Key processes will be the injection of CO2 and associated cooling of the formation, flow, and transport of CO2 gas through the reservoir, repressurization of the reservoir, and the enhanced production of CH4. The Rio Vista Gas Field in California is a promising target for the field test, however, we will consider other locations if they have better potential to satisfy the objectives of the pilot study.
Heterogeneity in the formation may lead to preferential flow paths for the injected CO2. This phenomenon may be favorable for injectivity and carbon sequestration in that it allows greater amounts of CO2 to be injected. However, preferential flow may lead to early breakthrough and is therefore detrimental to EGR. Furthermore, the development of larger gas composition gradients and subsequent mixing by molecular diffusion is enhanced by preferential flow.
In case, flow instability occurs, adheres to high pressure injection should be avoided. Instead of trying to achieve miscibility at high pressure, it is recommended that immiscible injection at lower pressure conditions be planned. Numerical simulation results shows that such scenario will eventually produce much of the residual natural gas as long as well placement is designed with flow instability in mind. The use of chemicals in order to viscosity CO2 or to create gels in situ should be avoided. Field trials of these schemes under the auspices of oil production have been dismal.
One aspect of CO2 sequestration is rarely considered. If CO2 is injected in natural porous media (limestone or sandstone), its properties are altered after it is stored. In case the injected CO2 has contaminants, such as heavy metals or toxic additives (e.g. glycol, diethanolamine, triethanolamine), the porous medium is likely to adsorb the contaminants, purifying CO2. The resulting CO2 is more amenable to photosynthesis than CO2 that is produced during combustion of refined crude oil.
4.4. Enhanced Gas Recovery
There has been just one published field test of EGR. This test was conducted during 1986–1994 in the Hungarian field Budafa Szinfelleti, a weak water drive sandstone reservoir of 5–40 mD permeability (Papay, 1999). For that pilot study, EGR started when the natural gas recovery was 67% OGIP (original gas in place) and the injected gas was an impure CO2 stream, consisting of 80% CO2 and 20% CH4 from an adjacent natural CO2 pool.
The incremental gas recovery was 11.6% OGIP, or 35% of the gas in place at the initiation of CO2 injection. CO2 breakthrough occurred 1.5 years after the start of injection; the distance between injection and production wells was 500 m. This recovery is in sharp contrast to 70% recovery expected from core flood tests. The discrepancy can be explained through the existence of viscous instability and/or loss in sweep efficiency due to heterogeneity. Because the density of CO2 is 3–9 times higher than that of CH4, instability would occur if CO2 is injected from the top of a formation.
Turta et al. (2007) reported laboratory test results of sweep efficiency of CO2 and flue gas in an EGR scheme. These results are shown in Table 4.13. This table confirms previous postulation that flue gas can significantly improve the economics of the EGR process due to its relative abundance and lower cost as compared to pure CO2. In addition, the delay in the production of CO2 when flue gas was used (as the displacing agent) means that the equipment is less vulnerable to corrosion. The problem will arise in the fact that the flue gas contains nitrogen concentration higher than the allowable limit in pipelining. This is not a technical issue but an issue of policy, which needs to be revised for unconventional gas applications.
Table 4.13
Comparison between Flue Gas and CO2 Efficiency
| Test# | Injection Gas | Swi | Methane recovery at 1% N2 contamination | Methane recovery at 10% N2 contamination | Methane recovery at 20% N2 contamination |
| % | % OGIP | % OGIP | % OGIP | ||
| 11 | CO2 | 18 | 61 | 71 | – |
| 12a | 14% CO2 in N2 | 18 | 66 | 76 | 84 |
| 13 | 14% CO2 in N2 | 20 | 75 | 82 | 87 |
| 18a | CO2 | 19 | 62 | 70 | – |
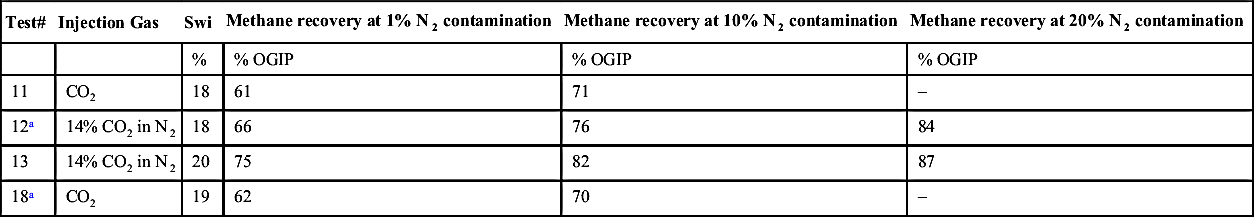
Swi = Intial water saturation.
4.4.1. Challenges and Opportunities of EGR
Everything about unconventional gas is challenging, mainly because conventional tools of characterization do not apply to unconventional gas. From origin to diagenesis, that is the overall history of most unconventional reservoirs is different from conventional ones. Only tight gas and tight oil formations are equivalent to low-permeability sandstone. As seen in the previous chapter, tight gas and oil are low-permeability version of sandstone. However, origin, depositional setting, stratigraphy, structure, geochemistry, geomechanics, seismic character, and petrophysical properties are different for other unconventional reservoirs. Some of the biggest challenges are:
• understanding the origin of the gas, i.e., how and where these rocks are charged with gas;
• determine a pattern of the highly-productive “sweet spots”;
• determine what factors influence the large variation in both drainage area and permeability; and
• determine a pattern of fracture distribution and orientation.
Even though it is commonly assumed that shale gas is also the source rock, there are numerous scenarios that have shale gas interbedded with sandstone or even limestone. Determining the origin of this gas is not a trivial task. The age of this gas can be determined by correlating gas properties with time. Arising from the premise that natural processing increases the quality of petroleum fluids, a scenario depicted in Figure 4.49 can be developed. The actual numbers in this figure will arise from database of the region. In absence of such data, geological age of the rock can be determined and gas property data be evaluated in order to assess the origin of the gas.
Because the processes involving the formation of unconventional gas are different, the quality at the beginning of the gas generation is different. Even if it is assumed that the original gas is biogenic for each of these cases, gas hydrate methane is the purest form of methane from the beginning. It is because the original gas is purified with water and only a pure form of methane gas can form hydrate structures. This process is diametrically opposite to the formation of diamond, albeit in a different time scale. This discussion of diamond formation is relevant for both explaining purity of gas hydrate methane as well as the formation of CBM.
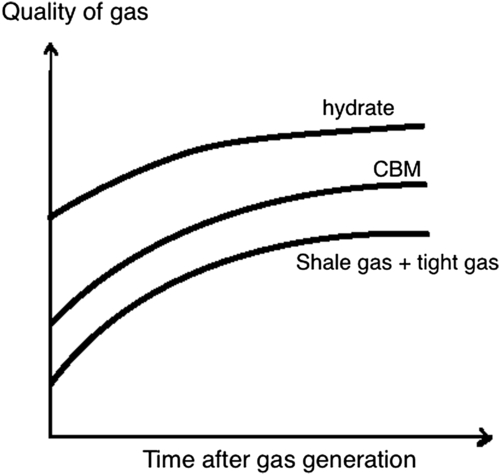
Figure 4.49 Variation of gas qualities as a function of time. CBM, coalbed methane.
Coal is considered to be the fossilized form of large volumes of biomass. One theory suggests that coal is formed in presence of water and with a low thermal gradient. Any gas that forms has the ability to escape or remain absorbed in the aqueous phase as well as adsorbed in the coal mass. Diamond, on the other hand, is formed when the cooling rate is much faster. Crystals are formed with a very high bonding energy without water molecules. As a result coal oxidizes at a relatively low temperature (similar to biomass oxidation temperature). On the other hand, diamond only oxidizes at a very high temperature, making it impractical to be an energy source for human consumption.
Volcanic rocks can be yet another form of unconventional oil/gas source. Vegetation entrained in ash flows may contain enough water to protect it from heat of emplacement. Subareal volcanism may create lakes and swamps with kerogen-rich sediments, and the volcanically warmed water in these basins can trigger nutrient growth, further enhancing the production of organic material. While there has been little consideration of exploring the potential of volcanic oil and gas reservoirs, it is well known that many conventional reservoirs have volcanic bedrocks that enhance oil and gas recovery from them. Once hydrocarbons are found in igneous reservoirs, assessing hydrocarbon volumes and productivity presents several challenges. Volcanic reservoirs are extremely hard. Seismic and logging fail to characterize these formations. The difficulty arises from the fact that volcanic rocks act as a shield for transmission of practically all signals that are used in logging. Log interpretation in igneous reservoirs often requires adapting techniques designed for other environments. For instance, resistivity logs that are based on conventional reservoirs will be less suitable for highly resistive matrix, low porosity, shale-free clean formations. Similar anomalies will occur with density log and neutron logs. Also, magnetic elements are more due to igneous origin. So nuclear magnetic resonance tool is ineffective in such formations. While sonic logs have better chance of being functional, volcanic rocks are so highly reflective, that they would not allow these signals to travel through.
Furthermore, because mineralogy varies greatly in these formations, methods that work in one volcanic province may fail in another. Usually, a combination of methods is required. In terms of porosity, direct measurement of volcanic rock porosity is most preferred.
The formation of volcanic rocks and entrapment of fluid within it can be explained by following the history of volcanic rocks. Figure 4.50 depicts formation of volcanic rocks and emplacement of igneous rocks. Plutonic rocks, formed by cooling of magma within the Earth, display well-developed crystals with little porosity. Plutons and laccoliths—bulging igneous injections into sedimentary layers—are examples of plutonic rock. Volcanic rocks, formed when magma extrudes onto the surface and cools rapidly, show very fine crystalline or even glassy textures. While during the cooling process, cooling of volcanic fluids either underground or at the surface, and agglomeration of fragments ejected during explosive eruptions will develop different tendency of fracturing. This explains why volcanic rocks do not show well-defined patterns in terms of fractures. The onset of fractures itself is distinctly different in volcanic rocks from others, such as sedimentary rocks. When magma contains large amounts of water and gases, buildup of excessive pressure will cause sudden eruption, leading to the development of fissures and eventual fractures. During cooling of volcanic rocks, tremendous restoring force is developed internally, because rock is a poor thermal conductor and there is differential stress that develops along the temperature variation line. This restoring force or stress depends on the nature of cooling. Nature and tendency of internal force guides tendency or direction of fracturing.
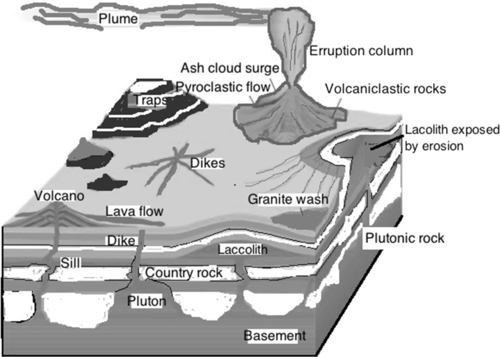
Figure 4.50 Formation of volcanic rocks. Redrawn from Schlumberger, Oilfield Review, 2009.
During the cooling process the neighboring rocks are also affected. Volcanic eruption near sedimentary basins will intrude into sediments extending over several kilometers and during cooling will create fractures and subsequently faults. This process essentially creates the basis for cyclic nature of fracture, fissures and faults. Figure 4.51 shows the cyclic nature of the process. In the subsurface, volcanic events trigger earth quakes that can create faults within consolidated rocks. Any fault is accompanied with fissures and cracks that eventually can grow into fractures. These fractures themselves make a rock system vulnerable to faults that lead the way to volcanic fluid invasion and earth quake.
This is in conformance with what has been known as burial-thermal diagenesis. The diagenetic evolution of the middle member of the Bakken Formation is depicted in conjunction with the reconstructed burial-thermal history of the unit in the deep part of the Williston Basin (Figure 4.52). The burial-thermal model takes into account differences in deposition and erosion, as well as variations in thermal regime during the basin's history. Thermal data constrain the maximum amount of erosion during the late Tertiary to about 500 m, which agrees closely with previously reported erosional estimates (Webster, 1984; Sweeney et al., 1992).
Figure 4.53 highlights the permeability-porosity characteristics of volcanic and conventional rocks. Volcanic rocks have much lower porosity of the matrix and the permeability of this rock is much higher than permeability encountered in conventional reservoirs. In contrast, other unconventional gas reservoirs, such as tight gas and shale will have higher porosity but lower permeability. Of course, this is due to the fact that shale and tighter formations have high surface area but little effective porosity. It is, therefore, difficult to penetrate shale gas and tight sand altogether and similarly it is difficult to penetrate the matrix of a volcanic reservoir. In terms of fluid production, shale gas or tight sand form a typical “permeability” as shown in Figure 4.53.
Figure 4.51 Volcanic activities and their impact on sedimentary rock create cycles of tectonic events.
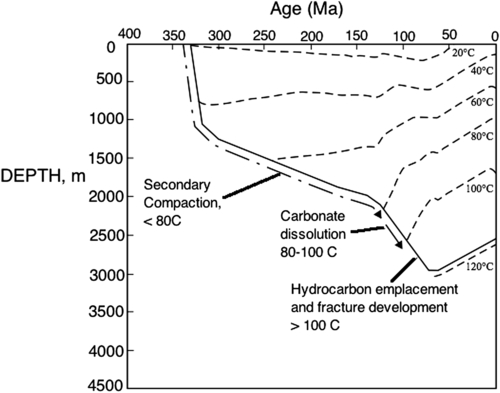
Figure 4.52 Reconstructed burial and thermal history curves of the Bakken Formation showing relative timing of major diagenetic events in the deep part of the Williston Basin. Redrawn from Oilfield review, Schlumberger.
While Figure 4.54 highlights the difficulties associated with EGR, it also unlocks potential techniques that would work in such situations. It is known that fracturing as well as drilling horizontal wells recover significant amount of oil and gas from shale and tight sand. Both these processes increase gas saturation within fractures and the wellbore, thereby increasing the relative permeability to gas. The same effect can be invoked by using ISC (or equivalent to HPAI) or selected gas injection (e.g. with CO2 or flue gas).
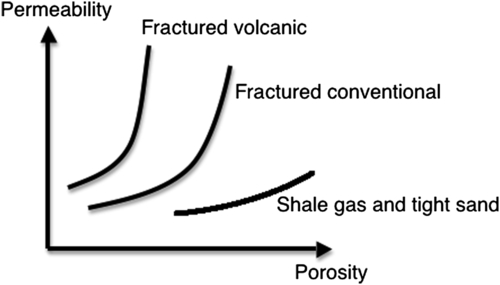
Figure 4.53 Fractured volcanic reservoir properties compared with fractured conventional reservoir.
For very tight but fractured formations, the possibility of using cyclic thermal fluid injection should be considered. Because diffusive heat and mass transfer is the most prominent mechanism prevalent in these formations, hot gas and/or steam injection can be beneficial. Heat injection can also trigger thermal cracking.
Figure 4.54 also shows how injection of gas can move the actual placement of a reservoir toward the left side, rendering the gas phase mobile. The presence of fissures and fractures can facilitate this process, as gas injectivity is moderate under such conditions.
For CBM, the most effective recovery technique is production of water that contains almost the entire amount of methane in absorbed state. The possibility of EGR for CBM is not well explored. However, it is well known that the production can be greatly enhanced with multilaterals, which have been widely successful in recent years. It is also well known that the addition of heat can increase the sweep efficiency of water tremendously. Steam injection in such cases is not economically feasible. However, ISC holds great promises. Coal burning is slow and conforms to the slow mode of steam generation within the reservoir. Combustion of coal will lead to the formation of CO2 that itself will enhance the displacement of gas as well as penetration of fractures. Figure 4.55 shows how such scheme would work.
Similar scheme is also applicable to oil-bearing volcanic reservoirs. However, for such reservoirs, the fuel is the hydrocarbon and not the matrix itself as is the case for CBM.
For gas hydrate formations, typically thermal, depressurization, and chemical stimulation have been considered for enhancing gas recovery. Among these, chemical stimulation is the least desirable. Chemical stimulations are economically impractical and the efficiency of the process is poor. Depressurization is effective if in situ pressure is high. Otherwise, depressurization does not yield reasonable gas production. Figure 4.56 shows various types of gas traps within a gas hydrate reservoir. Two of the three types of traps are structural whereas the third one is stratigraphic. In case, there is a gas trap, it becomes easier to initiate depressurization by putting the trap gas in production. This production destabilizes the hydrate zone and stream of gas is released making the process commercially viable. In case the volume of the trapped gas is not sufficient to create instability within the hydrate body, an innovative technique would be to initiate ISC by injecting air into the trap. This would trigger immediate instability due to sudden thermal change (Figure 4.57). This initial instability is followed by generation of CO2 that acts as yet another stimulus for further hydrate instability (Figure 4.58). At this point, production of methane can be resumed because all three modes of hydrate dissociation have been activated. Even though, the use of geothermal energy has been discussed in the literature as a means of stimulating hydrate production, air injection to trigger in situ heat generation is the most effective technique.
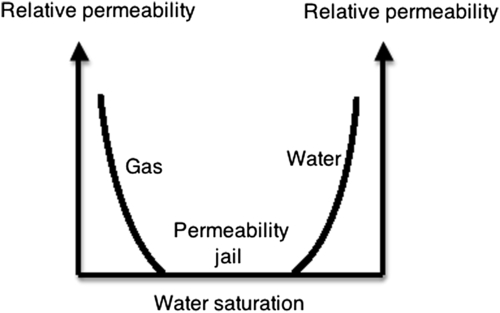
Figure 4.54 Existence of “permeability jail” in tight gas and shale formation.
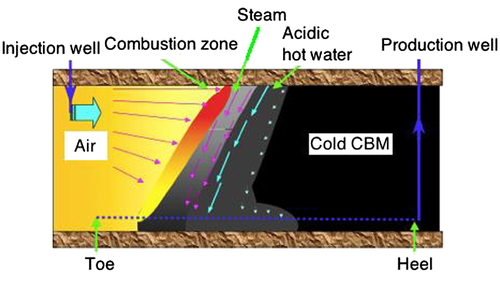
Figure 4.55 In situ combustion in coalbed methane (CBM).
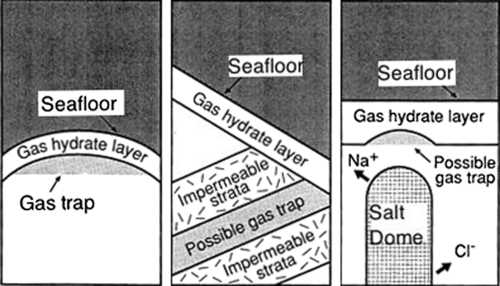
Figure 4.56 Different types of gas traps. From Kvenvolden, 1993.
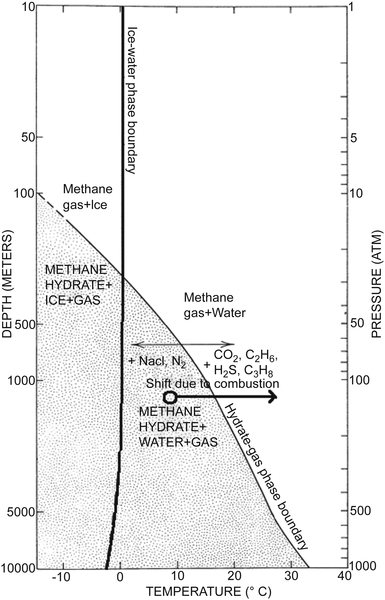
Figure 4.57 In situ combustion can trigger instability in gas hydrate. From Kvenvolden, 1993.
At present, three ways of transport of gas from hydrates are known: (1) by conventional pipeline, (2) by converting the gas hydrates to liquid middle distillates via the newly improved Fischer-Tropsch process and loading it onto a conventional tanker or barge, or (3) by reconverting the gas into solid hydrate and shipping it ashore in a close-to-conventional ship or barge. The latter option was proposed in 1995 by a research team at the Norwegian Institute of Technology, which determined that the use of natural gas hydrate for the transportation and storage of natural gas was a serious alternative to gas liquefaction since the upfront capital costs are 25% lower. Yet another positive factor is that it is far safer to create, handle, transport, store, and regasify natural gas hydrate than liquefied natural gas.
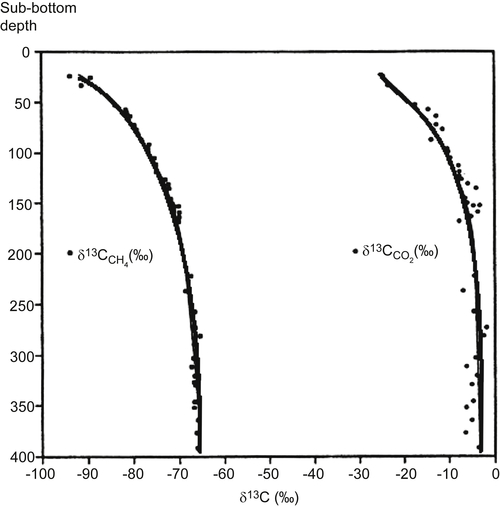
Figure 4.58 Typical distribution of carbon isotopic compositions with depth. From Kvenvolden, 1993.
Because natural gas hydrates are often found in shallow reservoirs, mining them is also an option. More importantly, natural gas hydrates offer the best candidates for downhole electricity generation. Efficiency of such process would be much higher than conventional electricity generation with gas turbines.
4.4. Summary and Conclusions
Unconventional reserves are typically undervalued. The potential of these resources is far greater than what is set out to be the norm, with multilaterals and fracking. The true potential lies within the development of custom-designed schemes based on the nature of resources. The flow chart presented in Figure 4.59 offers as a guideline for determining these schemes. This flow chart does not contain natural gas hydrate but includes tight carbonate formations. Natural gas hydrate options are presented in the section above.
The first question to ask is if there is natural productivity. Of course, if the answer is yes, then the reservoir falls under the realm of conventional technology. However, if there is no natural productivity or if the productivity is too low to sustain economic developments, the next question to be asked is if there is fracture network in place. Even though, unconventional gas reservoirs are mostly fractured, whenever they do not have clear fracture networks, injectivity is a major issue. The case becomes akin to tar sand that has very low injectivity. For this set of reservoirs, SAGD equivalent schemes are recommended.
As an example, the case of fracture-free hydrate reservoirs can be cited. Figure 4.60 shows how natural gas hydrates can invade permeable and porous beds that are surrounded by fractured formations. It is difficult to penetrate these formations with an injected fluid due to poor injectivity. However, access can be gained through fractures in order to trigger dissociation of the natural gas hydrate. Once set in motion, such dissociation process snowballs and the reservoir can produce high volume of in situ gas.
In a fracture-free formation, the next most suitable scheme is called “thermal cracking equivalent.” If for whatever reason the formation in question is not accessible, ISC should be considered in order to trigger production. Unlike conventional ISC that needs special completion in order to deal with high temperature, air injection is recommended. Air injection can trigger combustion that would lead to steam formation, CO2, generation and creation of thermal cracks, all of which will increase gas recovery or render the gas recovery process economically attractive. Figure 4.61 shows this particular feature of unconventional gas production.
The lowest priority option of fracture-free unconventional gas reservoir is displacement-type scheme. Because of the low injectivity of these reservoirs, a displacement-type recovery scheme can be achieved only with chemically active water or gas. For instance, alkaline water or carbon dioxide can both become effective displacement agents. In case of CO2 injection, high solubility of CO2 leads to the formation of carbonic acid that itself causes leaching effects. Because of the tightness of the formation, the injection rate has to be slow. However, diffusive forces will eventually drive the injected fluid to affect a large area that “softened,” thereby being able to produce gas, either from a different well or through huff and puff mode with the same well. This is depicted in Figure 4.62.
Figure 4.59 Flow chart for determining appropriate unconventional gas production schemes.
Figure 4.60 Example of SAGD-like recovery scheme for natural gas hydrate (yellow marks hydrate). For interpretation of the references to color in this figure legend, the reader is referred to the online version of this book.
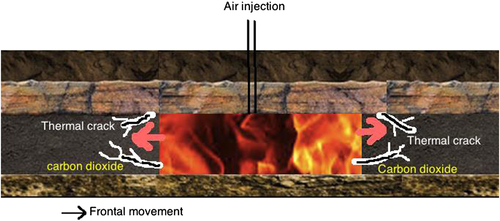
Figure 4.61 Air injection can trigger several enabling features that will render a recovery process economically attractive.
While all the above mentioned options are applicable to unconventional reservoirs without a fracture network, the presence of fracture networks calls for a new line of strategy. In this case, if the fractures are open, it is recommended that intensive fracking be used. Note that open fractures and low productivity is typical of shallow unconventional reservoirs. Fracturing does not work well in deep formations, for which fracturing is both prohibitively expensive and least effective. Hydraulic fractures would be formed in a direction orthogonal to the principal direction of natural fractures. However, prior to creating new fractures, the injected fluid would open existing fractures. In terms of volume, these newly opened fractures can account for very significant increase in gas production. Once hydraulic fractures are created and proppants placed, the overall productivity is sustained at a high value. The placement of hydraulic fractures is more challenging with a horizontal well (Figure 4.63). However, this challenge is easily overcome when the formation is shallow. For deeper formations, hydraulic fractures are more difficult to create and to sustain.
For reservoirs with open fractures, the question to be asked is if multilaterals are useful. Most of the cases, multilaterals translate into increased productivity. For a multilateral to be effective, following conditions have to be fulfilled:
1. horizontal well should intersect most of the fractures;
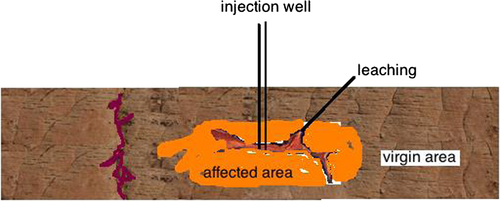
Figure 4.62 Chemically active water or gas can affect a large area in a tight reservoir.
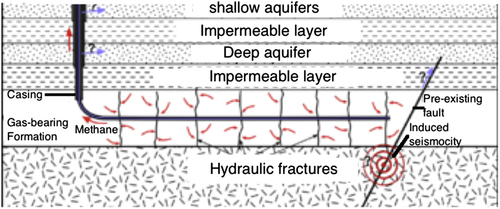
Figure 4.63 Hydraulic fracturing is most effective in shallow unconventional formations.
3. flow near wellbore is Darcian (as non-Darcy effects can reduce flow effectiveness);
4. pressure drop in the horizontal wellbore is not significant, in which case telescopic liner can be used to complete the horizontal well.
Figure 4.64 shows how the productivity improvement factor is generally impacted for various cases of reservoirs. Naturally fractured formations offer the best probability of success over vertical wells, even for the unconventional gas reservoirs as long as open fractures are present.
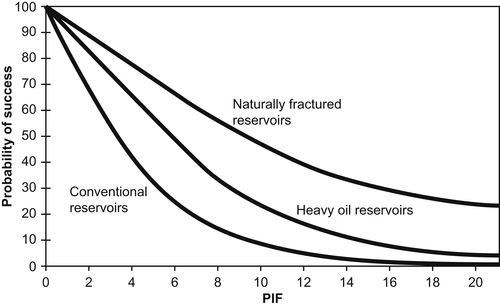
Figure 4.64 Probability of success with horizontal wells for various types of reservoirs.
Table 4.14
Various Types of Unconventional Reservoirs with Different Priorities
| Type of formation | Priority 1 | Priority 2 | Priority 3 |
| Sandstone | Fracking | Displacement | Thermal cracking |
| Shale | Fracking | Thermal cracking | Displacement |
| Coal bed methane | Thermal cracking | Displacement | Fracking |
| Carbonate | Displacement | High pressure air injection |
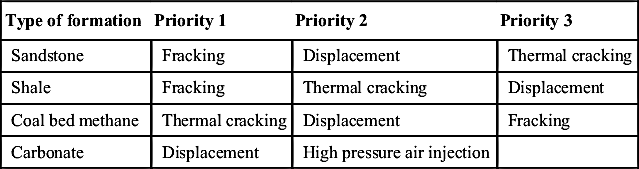
For cases for which multilaterals fail to yield satisfactory results, different types of schemes are recommended for different types of formations. Table 4.14 summarizes the final recommendation for this category.
..................Content has been hidden....................
You can't read the all page of ebook, please click here login for view all page.