Chapter 2
World Gas Reserve and the Role of Unconventional Gas
Abstract
The role of petroleum products in shaping human energy needs is undeniable. Even though the word “natural gas” is synonymous with petroleum gas, few understand the natural traits of “natural gas” and even fewer appreciate the role of “natural gas” in a natural setting. While there had been no ambiguity in terms what constitutes natural in both material and spiritual senses before modern age, modern age all the way to information is rife with confusion regarding sustainability of energy as well as mere existence of the human race. This chapter presents a delinearized history of energy developments in relation to petroleum production, particularly as it relates to natural gas. The discussion then revolves around energy needs of the future and how unconventional natural gas will play the most significant role in meeting the energy needs of the future generation. It is shown that unconventional natural gas is the most environment friendly and the cleanest of all natural resources.
Keywords
Coalbed methane; Fracking; Multilateral; Natural resources; Shale gas; Tight gas2.1. Summary
The role of petroleum products in shaping human energy needs is undeniable. Even though the word “natural gas” is synonymous with petroleum gas, few understand the natural traits of “natural gas” and even fewer appreciate the role of “natural gas” in a natural setting. While there had been no ambiguity in terms what constitutes natural in both material and spiritual senses before modern age, modern age all the way to information is rife with confusion regarding sustainability of energy as well as mere existence of the human race. This chapter presents a delinearized history of energy developments in relation to petroleum production, particularly as it relates to natural gas. The discussion then revolves around energy needs of the future and how unconventional natural gas will play the most significant role in meeting the energy needs of the future generation. It is shown that unconventional natural gas is the most environment friendly and the cleanest of all natural resources.
2.2. Petroleum in the Big Picture
Captain Drake is usually credited to have drilled the first-ever oil well in Titusville, Pennsylvania in 1859. Even if one discards the notion that petroleum was in use for thousands of years, there is credible evidence that the first well in modern age was drilled in Canada. Canadian, Charles Nelson Tripp was the first in North America to have recovered commercial petroleum products. The drilling was completed in 1851 at Enniskillen Township, near Sarnia, in present-day Ontario, which was known as Canada West at that time. Soon after the “mysterious gum” bed was discovered, first oil company was incorporated in Canada through a parliamentary charter. Tripp became the president of this company on December 18, 1854. The charter empowered the company to explore for asphalt beds and oil and salt springs, and to manufacture oils, naphtha paints, burning fluids. Even though this company (International Mining and Manufacturing) was not a financial success, the petroleum products received an honorable mention for excellence at the Paris Universal Exhibition in 1855. Failure of the company can be attributed to several factors contributed to the downfall of the operation. Lack of roads in the area made the movement of machinery and equipment to the site extremely difficult. And after every heavy rain the area turned into a swamp and the gum beds made drainage extremely slow. This added to the difficulty of distributing finished products.
In subsequent years, James Miller Williams became interested and visited the site in 1856; Tripp unloaded his hopes, his dreams, and the properties of his company, saving for himself a spot on the payroll as landman. The former carriage builder formed J.M. Williams & Company in 1857 to develop the Tripp properties. Besides asphalt, he began producing kerosene. This “refined” product, kerosene is a combustible hydrocarbon liquid. The name is derived from Greek: κ μ ρ ó ς (keros) meaning wax. The word “kerosene” was registered as a trademark by Abraham Gesner in 1854, and for several years, only the North American Gas Light Company and the Downer Company (to which Gesner had granted the right) were allowed to call their lamp oil “Kerosene” in the United States. Gesner was a medical doctor by training (from London) but took special interest in geology. Gesner's research in minerals resulted in his 1846 development of a process to refine a liquid fuel from coal, bitumen, and oil shale. His new discovery, which he named kerosene, burned more cleanly and was less expensive than competing products, such as whale oil. In 1850, Gesner created the Kerosene Gas Light Company and began installing lighting in the streets in Halifax and other cities. By 1854, he had expanded to the United States where he created the North American Kerosene Gas Light Company at Long Island, New York. Demand grew to where his company’s capacity to produce became a problem, but the discovery of petroleum, from which kerosene could be more easily produced, solved the supply problem. This was the first time in recorded history artificial processing technique was introduced in refining petroleum products. Gesner did not use the term “refined” but made fortune out of the sale of this artificial processing. In 1861, he published a book titled: A Practical Treatise on Coal, Petroleum and Other Distilled Oils, which became a standard reference in the field. As Gesner's company was absorbed into the petroleum monopoly, Standard Oil, he returned to Halifax, where he was appointed a professor of natural history at Dalhousie University. It is this university that was founded on pirated money while other pirates continued to be hanged by the Royal Navy at Point Pleasant Park's Black Rock Beach as late as 1844.1
In the mean time, a parallel event took place elsewhere in Canada. In 1858, Williams dug a well in search of cleaner drinking water and came across oil at a depth of 15.5 m. It became the first commercial oil well in North America, remembered as the Williams No. 1 well at Oil Springs, Ontario. The Sarnia Observer and Lambton Advertiser, quoting from the Woodstock Sentinel, published on page two on August 5, 1858:
An important discovery has just been made in the Township of Enniskillen. A short time since, a party, in digging a well at the edge of the bed of Bitumen, struck upon a vein of oil, which combining with the earth forms the Bitumen.
Some historians challenge Canada's claim to North America's first oil field, arguing that Pennsylvania's famous Drake Well was the continent's first. But there is evidence to support Williams, not least of which is that the Drake well did not come into production until August 28, 1859. The controversial point might be that Williams found oil above bedrock while “Colonel” Edwin Drake's well located oil within a bedrock reservoir.
History is not clear as to when Williams abandoned his Oil Springs refinery and transferred his operations to Hamilton. He was certainly operating there by 1860, however. Spectator advertisements offered coal oil for sale at 16 cents per gallon for quantities from 4000 US gallons (15,000 L) to 100,000 US gallons (380,000 L). By 1859 Williams owned 800 acres of land in Oil Springs. Williams reincorporated in 1860 as the Canadian Oil Company. His company produced oil, refined it, and marketed refined products. That mix of operations qualifies Canadian Oil Company as the world's first integrated oil company.
Exploration in the Lambton county backwoods quickened with the first flowing well in 1860; previous wells had relied on hand pumps. The first gusher erupted on January 16, 1862, when oil struck at 158 ft (48 m). For a week the oil gushed unchecked at levels reported as high as 3000 barrels per day, eventually coating the distant waters of Lake St Clair with a black film. There is historical controversy concerning whether it was John Shaw or another oil driller named Hugh Nixon Shaw who drilled this oil gusher; the newspaper article cited below identifies John Shaw.
News of the gusher spread quickly and was reported in the Hamilton Times four days later:
I have just time to mention that to-day at half past eleven o'clock, a.m., Mr. John Shaw, from Kingston, C. W., tapped a vein of oil in his well, at a depth of one hundred and fifty-eight feet in the rock, which filled the surface well, (forty-five feet to the rock) and the conductors [sic] in the course of fifteen minutes, and immediately commenced flowing. It will hardly be credited, but nevertheless such is the case, that the present enormous flow of oil cannot be estimated at less than two thousand barrels per day, (twenty-four hours), of pure oil, and the quantity increasing every hour. I saw three men in the course of one hour, fill fifty barrels from the flow of oil, which is running away in every direction; the flat presenting the appearance of a sea of oil. The excitement is intense, and hundreds are rushing from every quarter to see this extraordinary well.
Historically, the ability of oil to flow freely has fascinated developers and at the same time ability of gas to leak and go out of control has intimidated them. Such fascination and intimidation continues today while nuclear electricity is considered to be benign while natural gas considered to be the source of global warming, all because it contains carbon—the very component nature needs for creating an organic product. Scientifically, however, the need for refining stems from the necessity of producing clean flame. Historically, Arabs were reportedly the first ones to use refined olive oil. They used exclusively natural chemicals in order to refine oil (Islam et al., 2010). However, such use of natural chemicals is nonexistent in modern day petroleum industry. When it comes to petroleum gas, it had been in use for millennia but only recent time “processing” of such gas has been introduced.
Natural gas seeps in Ontario County, New York were first reported in 1669 by the French explorer, M. de La Salle, and a French missionary, M. de Galinee, who were shown the springs by local Native Americans. This is the debut of natural gas industry in North America. Subsequently, William Hart, a local gunsmith, drilled the first commercial natural gas well in the United States in 1821 in Fredonia, Chautauqua County. He drilled a 27-foot deep well in an effort to get a larger flow of gas from a surface seepage of natural gas. This was the first well intentionally drilled to obtain natural gas. Hart built a simple gas meter and piped the natural gas to an innkeeper on the stagecoach route from Buffalo to Cleveland. Because there was no pipeline network in place, this gas was almost invariably used to light streets at night. However, in late 1800s, electric lamps were beginning to be used for lighting streets. This led to gas producers scrambling for alternate market. Shallow natural gas wells were soon drilled throughout the Chautauqua County shale belt. This natural gas was transported to businesses and street lights in Fredonia at the cost of US$.50 a year for each light (Website 1). In the mean time, in mid-1800s, Robert Bunsen invented the “Bunsen burner” that helped produce artificial flame by controlling air inflow in an open flame. This was significant because it helped producing intense heat and controlling the flame at the same time. This led ways to develop usage of natural gas for both domestic and commercial use.
The original Hart gas well produced until 1858 and supplied enough natural gas for a grist mill and for lighting in four shops. By the 1880s, natural gas was being piped to towns for lighting and heat, and to supply energy for the drilling of oil wells. Natural gas production from sandstone reservoirs in the Medina formation was discovered in 1883 in Erie County. Medina production was discovered in Chautauqua County in 1886. By the early years of the twentieth century, Medina production was established in Cattaraugus, Genesee, and Ontario counties.
Gas in commercial quantities was first produced from the Trenton limestone in Oswego County in 1889 and in Onondaga County in 1896. By the end of the nineteenth century, natural gas companies were developing longer intrastate pipelines and municipal natural gas distribution systems. The first gas storage facility in the United States was developed in 1916 in the depleted Zoar gas field south of Buffalo.
By the late 1920s, declining production in New York's shallow gas wells prompted gas companies to drill for deeper gas reservoirs in Allegany, Schuyler, and Steuben counties. The first commercial gas production from the Oriskany sandstone was established in 1930 in Schuyler County. By the 1940s, deeper gas discoveries could no longer keep pace with the decline in shallow gas supplies. Rapid depletion and overdrilling of deep gas pools prompted gas companies in western New York to sign long-term contracts to import gas from out of state.
It took the construction of pipelines to bring natural gas to new markets. Although one of the first lengthy pipelines was built in 1891—it was 120 miles long and carried gas from fields in central Indiana to Chicago —there were very few pipelines built until after World War II in the 1940s. Similar to all other developments in modern Europe, World War II brought about changes that led to numerous inventions and technological breakthroughs in the area of petroleum production and processing. Improvements in metals, welding techniques, and pipe making during the War made pipeline construction more economically attractive. After World War II, the nation began building its pipeline network. Throughout the 1950s and 1960s, thousands of miles of pipeline were constructed throughout the United States. Today, the US pipeline network, laid end-to-end, would stretch to the moon and back twice. The phenomenon of pipelining is of significance. Because of this, there has been tremendous surge in the corrosion control industry.
Onondaga reef fields were discovered by seismic prospecting in the late 1960s. Seven reef fields have been discovered to date in southern New York. Today, the Onondaga reef fields and many Oriskany fields are largely depleted and are being converted to gas storage fields. This state of depletion was achieved after a long production period and extensive hydraulic fracturing throughout 1970s and 1980s. These were considered to be tight gas sands. Recently, the same technology has made a comeback. The rapid development of New York's current Trenton-Black River gas play is made possible by technological advances in three-dimensional (3D) seismic imaging, horizontal drilling, and well completion. The surge in domestic oil and gas production through “fracking” emerges from technologies popularized in the 1970s. However, 3D seismic or multilateral drilling technology was not in place at the time. Figure 2.1 shows how natural gas production evolved in the state of New York throughout history.
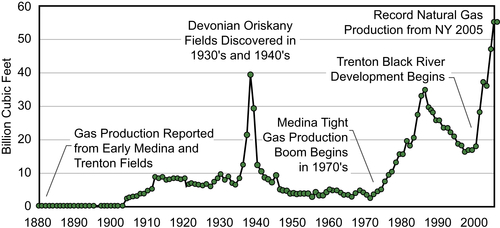
Figure 2.1 Natural gas production history in New York State. From Website 1.
In this figure, the first spike relates to discovery of Devonian shale. That spike led to a quick depletion. In early 1970s, production from “tight gas” formations led to another more sustained spike in gas recovery. During that period, extensive hydraulic was introduced as a means for increasing productivity. However, it was not considered to be a reservoir production enhancement scheme. In 2000, at the nadir of oil price, yet another spike took place in the state of New York. This related to the development of Trenton-Black River field. This gas production scheme would lead to record gas production in that state in 2005. This spike continued and led the way to producing domestic gas and oil from unconventional reservoirs in United States. Today, production from unconventional gas reservoirs has taken an unprecedented turn. In 2013, production from shale gas, tight gas, and coalbed methane (CBM) accounted for domestic production surpassing imports for the first time in 30 years. Shale gas, tight oil, or other unconventional resources are found in many of the states that had already produced from conventional sources. Figure 2.2 shows the locations of these unconventional formations.
The primary recovery techniques from these shale plays involve multilaterals and intense hydraulic fracturing, now known as “fracking.” Two significant differences between fracking and old-fashioned hydraulic fracturing are (1) fracking uses multistage fractures with horizontal multilaterals and (2) fracking uses artificial sands as well fluid. One such example is shown in Picture 2.1. Figure 2.3 shows how these artificial proppants with cylindrical shape creates better fractures.
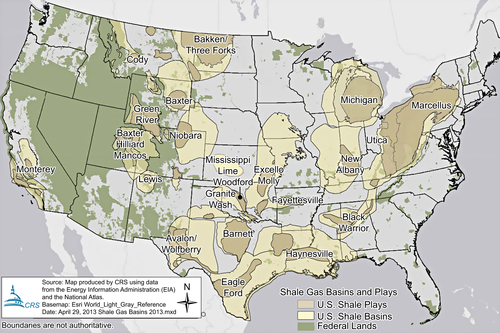
Figure 2.2 Locations of unconventional shale plays in lower 48 states. From Ratner and Tiemann, 2014.

Picture 2.1 Latest fracking techniques use artificial proppants (cylindrical shaped, magnified 25 times).
Figure 2.3 demonstrates that sands have the worst fracture efficiency, while the rod-shaped proppants have the highest efficiency. In this process, material cost of fracturing has skyrocketed and accounts for bulk of the fracturing scheme. The same can be said about fracturing fluid. It turns out water is not conducive to creating fractures in shale formations. In 1976, the US government started the Eastern Gas Shales Project, a set of dozens of public–private hydraulic fracturing pilot demonstration projects. During the same period, the Gas Research Institute, a gas industry research consortium, received approval for research and funding from the Federal Energy Regulatory Commission. That was the beginning of fracturing shale formations that gave boost in gas production throughout late 1970s and 1980s.
In 1997, based on earlier techniques used by Union Pacific Resources, now part of Anadarko Petroleum Corporation, Mitchell Energy, now part of Devon Energy, developed the hydraulic fracturing technique known as “slickwater fracturing” that involves adding chemicals to water thereby allowing increase to the fluid flow, which made the shale gas extraction economical. These chemicals are both expensive and toxic to the environment.
The fracturing fluid varies in composition depending on the type of fracturing used, the conditions of the specific well being fractured, and the water characteristics. A typical fracture treatment uses between 3 and 12 additive chemicals. A typical fracturing operation involves the following chemicals.
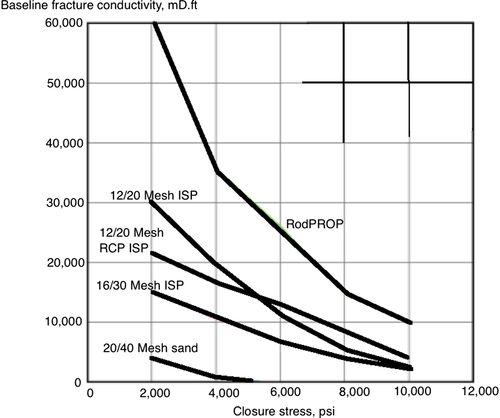
Figure 2.3 Comparison of long-term conductivity between rod-shaped proppant and conventional spherical proppant at 2 lbm/ft2 at 250° F.
Acids: hydrochloric acid (for carbonate cements) or acetic acid (for silicate cement) is used in the prefracturing stage for cleaning the perforations and initiating fissure in the near-wellbore rock.
Sodium chloride: delays breakdown of the gel polymer chains.
Polyacrylamide and other friction reducers: reduces turbulence (lower Reynold's number), while increasing proppant transport in the tubing or drill pipe.
Ethylene glycol: prevents formation of scale deposits in the pipe.
Borate salts: thermal stabilizers that maintain fluid viscosity under high temperature conditions.
Sodium and potassium carbonates: used for maintaining effectiveness of cross-linkers that stabilize the polymer.
Glutaraldehyde: used as disinfectant of the water to prevent bacterial growth and subsequent biodegradation of the fluid.
Guar gum and other water-soluble gelling agents: increases viscosity of the fracturing fluid to deliver more efficiently the proppant into the formation.
Citric acid: used for corrosion prevention as it is a milder form for corrosion inhibitors.
Isopropanol: increases the viscosity of the fracturing fluid.
The most common chemical used for hydraulic fracturing in the United States in 2005–2009 was methanol, while some other most widely used chemicals were isopropyl alcohol, 2-butoxyethanol, and ethylene glycol. New generation of chemicals include: Conventional linear gels (carboxymethyl cellulose, hydroxyethyl cellulose, carboxymethyl hydroxyethyl cellulose, hydroxypropyl cellulose, methyl hydroxyl ethyl cellulose), guar or its derivatives (hydroxypropyl guar, carboxymethyl hydroxypropyl guar), etc. These gels have higher viscosity at pH9 onwards and are used to carry proppants. After the fracturing job the pH is reduced to 3–4 so that the cross-links are broken and the gel is less viscous and can be pumped out. Organometallic cross-linked fluid zirconium, chromium, antimony, titanium salts are known to cross-link the guar-based gels. The cross-linking mechanism is not reversible. Aluminum phosphate–ester oil gels. Aluminum phosphate and ester oils are slurried to form a cross-linked gel. These are one of the first known gelling systems.
Hydraulic fracturing has been used for decades to stimulate increased production from existing oil or gas wells. This technique, along with other well stimulation techniques, has been regulated to varying degrees through state oil and gas codes. The detail and scope of applicable regulations vary across the states, and some states have regulated “well stimulation” broadly without addressing hydraulic “fracturing” explicitly. State regulators have noted that hydraulic fracturing operations are regulated through provisions that address various production activities, including requirements regarding well construction (e.g., casing and cementing), well stimulation (e.g., hydraulic fracturing), and well operation (e.g., pressure testing and blowout prevention). Nonetheless, state groundwater protection officials also have reported that development of shale gas and tight oil using high-volume hydraulic fracturing, in combination with directional drilling, has posed new challenges for the management and protection of water resources. Consequently, many of the major producing states have revised or are in the process of revising their oil and gas laws and regulations to respond to these advances in oil and natural gas production technologies and related changes in the industry.
Today, activism against fracking has taken an unprecedented twist. From California to New York, from Nova Scotia to British Columbia, people have lined up in almost a cultlike fervor to “ban fracking.” This comes with a backdrop of months of intense debate, extensive reviews of the scientific literature, and input from citizens, industry, responsible environmentalists and academics, leading to several states writing legislature on the most far-reaching hydraulic fracturing law of modern time. Three things that did not happen are (1) scientific investigation pointing to the real short comings of fracking, (2) abatement in fracking operations in unconventional gas and oil reservoirs, and (3) research into how to turn fracking operations environmentally acceptable and sustainable. In the mean time, the United States is poised to continue to produce from unconventional reservoirs in an unprecedented pace.
Figure shows overall energy outlook of the United States. In terms of project, natural gas shows the highest growth in the 30-year projection. In fact, other than natural gas, only renewable and liquid biofuels show modest increase, while others drop or remain constant. Natural gas plays even more intense role when it comes to electrical power usage. Figure 2.5 shows the energy outlook of the United States. This figure shows natural gas is the most promising energy provider in coming decades. It indicates that US dry natural gas production increases 1.3% per year throughout the reference case projection, outpacing domestic consumption by 2019. Higher volumes of shale gas production are central to higher total production volumes and a transition to net exports. As domestic supply has increased in recent years, natural gas prices have declined, making the United States a less attractive market for imported natural gas and more attractive for export.
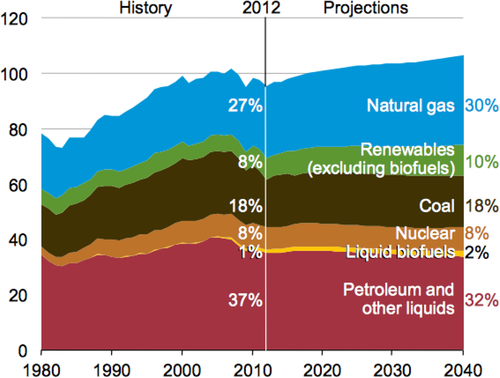
Figure 2.4 Overall energy outlook of the United States in quadrillion Btu. From EIA Energy Outlook report, 2014.
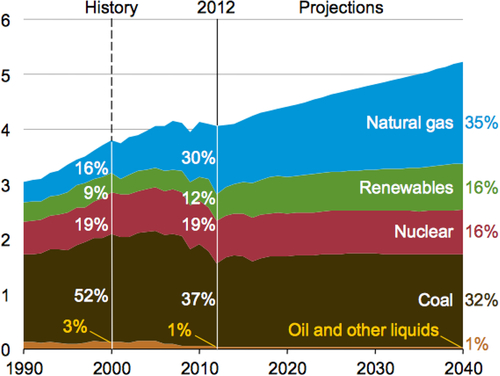
Figure 2.5 Past and projected electricity use in trillion Kwh. From EIA Energy outlook report, 2014.
Figure 2.6 shows total US natural gas production, consumption, and net imports in the reference case, 1990–2040 (trillion cubic feet, Tcf). This figure indicates that US net exports of natural gas grow to 3.6 Tcf in 2040. Most of the projected growth in US exports consists of pipeline exports to Mexico, which increase steadily as growing volumes of imported natural gas from the United States fill the widening gap between Mexico's production and consumption. Declining natural gas imports from Canada also contribute to the growth in US net exports. Net US imports of natural gas from Canada decline sharply from 2016 to 2022, then stabilize somewhat before dropping off again in the final years of the projection, as continued growth in domestic production mitigates the need for imports.
The share of coal in electric power generation falls over the projection period. Although coal is expected to continue its important role in the US electricity generation, there are many uncertainties that could affect future outcomes. The most important factor is the relationship between coal and natural gas prices and the potential for policies aimed at reducing greenhouse gas emissions. In 2012, natural gas prices were low enough for a few months for power companies to run natural gas-fired generation plants more economically than coal plants in many areas. During those months, coal and natural gas were nearly tied in providing the largest share of total electricity generation, something that had never happened before.
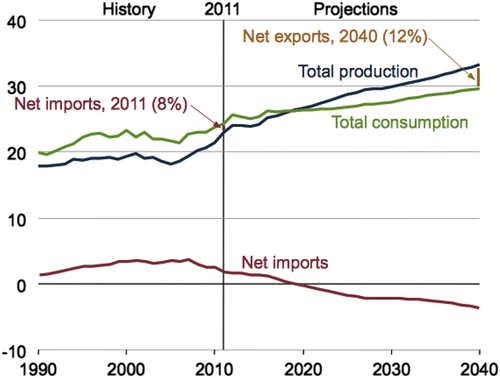
Figure 2.6 Natural gas production, consumption and import in trillion cubic feet. From EIA Energy outlook report, 2013.
In the mean time, oil and gas production from unconventional sources is likely to be dominating the US domestic production. Figure 2.7 shows recovery projection from tight oil and shale gas formations. Note that shale gas production is projected to grow continuously, eclipsing tight oil in just over a decade. This potential of shale gas is credited to multilaterals and fracking techniques. However, other techniques should also be investigated and more research directed toward making fracking techniques environmentally sustainable.
This scenario plays out well with global energy outlook. Figure 2.8 shows the global energy outlook of the future along with the recent past. The International Energy Outlook 2013 (IEO2013) projects that world energy consumption will grow by 56% between 2010 and 2040. Total world energy use rises from 524 quadrillion British thermal units (Btu) in 2010 to 630 quadrillion Btu in 2020 and to 820 quadrillion Btu in 2040 (Figure 2.8). Much of the growth in energy consumption occurs in non-OECD (Organization for Economic Cooperation and Development), where demand is driven by strong, long-term economic growth. Energy use in non-OECD countries increases by 90% as compared to 17% in OECD countries.
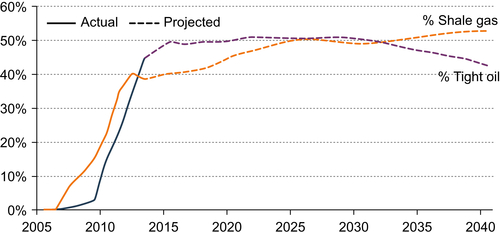
Figure 2.7 Percentage of U.S. oil and natural gas from tight oil and shale gas. From EIA report, 2014.
It is commonly perceived that renewable energy and nuclear power are the world's fastest growing energy sources, each increasing by 2.5% per year. However, fossil fuels continue to supply almost 80% of world energy use through 2040. Natural gas is the fastest growing fossil fuel in the outlook. Global natural gas consumption increases by 1.7% per year. Increasing supplies of tight gas, shale gas, and CBM support growth in projected worldwide natural gas use. Coal use grows faster than petroleum and other liquid-fuel use until after 2030, mostly because of increases in China's consumption of coal and tepid growth in liquid demand attributed to slow growth in the OECD regions and high sustained oil prices.
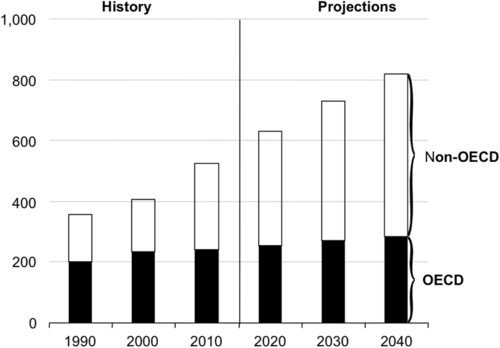
Figure 2.8 Global Energy consumption in the past and the future. From EIA, 2013.
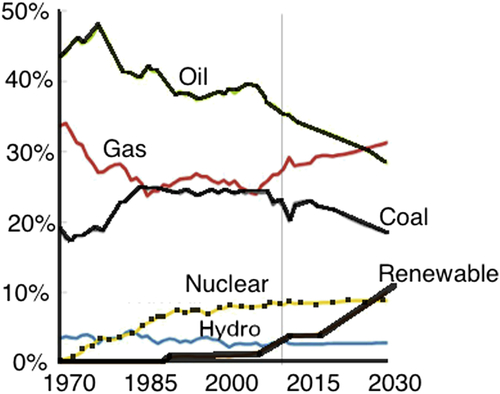
Figure 2.9 Shares of the US primary energy. Courtesy BP.
Figure 2.9 shows the US shares of various energy sources. As far as the United States is concerned, all energy resources other than natural gas and renewable are in decline. Only renewable energy, such as wind, solar are predicted to be increasing in demand. However, Islam et al. (2010) have demonstrated that these “renewable” energy sources are neither renewable nor beneficial to the ecosystem. In addition, they are much more inefficient and toxic to the environment than the conventional fossil fuel burning. Even though “renewable” energy source is no threat to natural gas, one must note that renewable energy sources are subscribed and they are not renewable or sustainable, as noted by Chhetri and Islam (2008).
Figure 2.10 shows the breakdown of “renewable energy” outlook. Wind is the only energy source that is predicted to grow in future. The US oil and natural gas production is on the rise, primarily driven by resources from tight formations. The techniques developed to produce shale gas—directional drilling and hydraulic fracturing—have migrated to the oil sector. The United States is the third largest oil producer in the world, but also the fastest growing producer. The United States surpassed Russia in 2009 as the world's largest natural gas producer. Production from tight formations is expected to make up a significant part of production of each commodity well into the future.
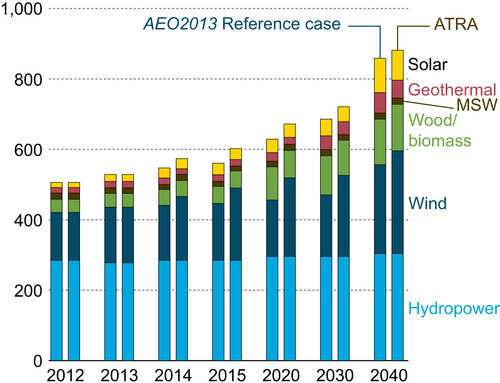
Figure 2.10 Renewable energy outlook.
It is often suggested that unconventional oil and gas resources can pose environmental risks. These risks are purported to be due to contamination of water resources. For example, increased unconventional oil and gas production activity is thought to have placed a strain on water resources, and on wastewater treatment plants that were not designed to remove chemicals, salts, and other contaminants from hydraulic fracturing flowback and produced water. The argument in favor of additional natural gas production is made by showing it as a “bridge” fuel that can provide more energy per unit of greenhouse gas produced than some alternatives (e.g., coal). While this second one is true, the science behind these conclusions is inaccurate. Hydraulic fracturing activities can be minimized, but more importantly, they can be rendered sustainable by removing artificial chemicals from the fracturing scheme. This aspect will be discussed in a later chapter of this book. In addition, natural gas itself is scientifically most environment-friendly natural resource and can be rendered environmentally sustainable by eliminating artificial chemicals during the processing cycle.
Nonetheless, the rapid expansion of oil and natural gas extraction using high-volume hydraulic fracturing has generated controversy in both rural and urban communities. Protests against “fracking” has become a routine phenomenon. Water quality issues have received the most attention, and of these, the potential risks associated with well stimulation by hydraulic fracturing have been at the forefront. Complaints of contaminated well water have emerged in various areas where unconventional oil and gas development is occurring, although regulators have not reported a direct connection between hydraulic fracturing of shale formations at depth and groundwater contamination. In shale formations, the vertical distance separating the target zone from usable aquifers generally is much greater than the length of the fractures induced during hydraulic fracturing. Thousands of feet of rock layers typically overlay the produced portion of shale, and these layers serve as barriers to flow. In these circumstances, geologists and state regulators generally view as remote the possibility of creating a fracture that could reach a potable aquifer. If the shallow portions of shale formations were developed, then the thickness of the overlying rocks would be less and the distance from the shale to potable aquifers would be shorter, posing more of a risk to groundwater. In contrast to shale, CBM basins often qualify as underground sources of drinking water. All these concerns can be mitigated by resorting to “green” fracturing fluid and natural materials that have coexisted with human activities for millennia.
State regulators have expressed more concern about the groundwater contamination risks associated with developing a natural gas or oil well (drilling through an overlying aquifer and casing, cementing, and completing the well), as opposed to hydraulic fracturing per se. The challenges of sealing off the groundwater and isolating it from possible contamination are common to the development of any oil or gas well, and are not unique to hydraulic fracturing. This special sensitivity is somewhat curious because natural gas is nature processed and can coexist with other natural systems, such as ground water. The confusion arises from the legislations that fail to distinguish between natural chemicals and artificial chemicals and all chemicals are painted with the same brush, regardless of their origins. In fact, natural gas and crude oil are considered to be the most toxic agent that needs to be removed from drilling mud (Khan and Islam, 2007). This reaction extends from oil to natural gas. Air pollution associated with unconventional oil and natural gas production has also raised public health concerns and has drawn regulatory scrutiny. Air pollutants can be released during various stages of oil and natural gas production, not just hydraulic fracturing. Emission sources include pad, road, and pipeline construction; well drilling and completion, and flowback activities; and natural gas processing, storage, and transmission equipment. Key pollutants include methane (the main component of natural gas and a potent greenhouse gas), volatile organic compounds (VOCs), nitrogen oxides, sulfur dioxide, particulate matter, and various hazardous air pollutants. According to Environmental Protection Agency (EPA), the oil and gas industry is a significant source of VOCs, which react with nitrogen oxides to form ozone (smog). EPA has identified hydraulically fractured gas wells during flowback as an additional source of VOC emissions in the natural gas industry.
The debate over the groundwater contamination risks associated with hydraulic fracturing operations has been fueled, in part, by the lack of scientific studies to assess more thoroughly the current practices and related complaints and uncertainties. To help address this issue, Congress has directed the EPA to conduct a study on the relationship between hydraulic fracturing and drinking water. The “hydraulic fracturing” debate also has been complicated by terminology. Many who express concern over the potential environmental impacts associated with hydraulic fracturing do not differentiate the well stimulation process of “fracking” from the full range of activities associated with unconventional oil and gas exploration and production. Figure 2.11 shows various regions of USA with their status vis-a-vis fracking practices.
2.3. Petroleum Reserve around the World
Scientifically, the word “reserve” implies technically and economically recoverable resource. However, technology as well as economic constraints both evolve continuously in addition to being intricately linked with sociopolitical aspects. Standardization of the term “reserve” has been a concern for some time.
Proven reserves are those reserves claimed to have a reasonable certainty (normally at least 90% confidence) of being recoverable under existing economic and political conditions, with existing technology. Industry specialists refer to this as P90 (i.e., having a 90% certainty of being produced). Proven reserves are also known in the industry as 1P (SPE, 2005). This “confidence” value arises from probability assignments that are themselves of spurious origin (Hossain and Islam, 2009). However, this denomination has been in place for sometime.
Proven reserves are further subdivided into “proven developed” (PD) and “proven undeveloped” (PUD) (Wright et al., 2008). PD reserves are reserves that can be produced with existing wells and perforations or from additional reservoirs where minimal additional investment (operating expense) is required, keeping the infrastructure/capital cost to zero. PUD reserves require additional capital investment (e.g., infill drilling) to add to the oil and gas production.
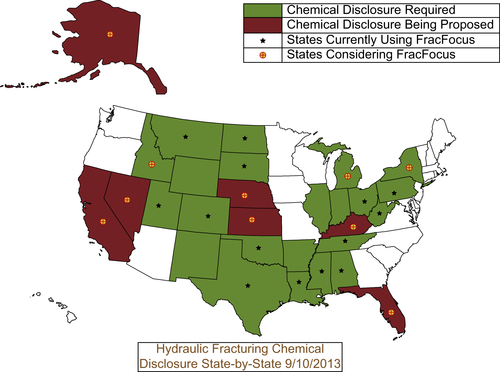
Figure 2.11 Hydraulic fracturing chemical disclosure by state. From Ratner and Tiemann, 2014.
Until December 2009 “1P” proven reserves were the only type the U.S. Securities and Exchange Commission (SEC) allowed oil companies to report to investors. Companies listed on US stock exchanges must substantiate their claims, but many governments and national oil companies do not disclose verifying data to support their claims. Since January 2010 the SEC now allows companies to also provide additional optional information declaring “2P” (both proven and probable) and “3P” (proven + probable + possible) provided the evaluation is verified by qualified third party consultants, though many companies choose to use 2P and 3P estimates only for internal purposes.
Unproven reserves are based on geological and/or engineering data similar to that used in estimates of proven reserves, but technical, contractual, or regulatory uncertainties preclude such reserves being classified as proven. Unproven reserves may be used internally by oil companies and government agencies for future planning purposes but are not routinely compiled. They are subclassified as probable and possible.
Probable reserves are attributed to known accumulations and claim a 50% confidence level of recovery. Industry specialists refer to them as “P50” (i.e., having a 50% certainty of being produced). These reserves are also referred to in the industry as “2P” (proven + probable).
Possible reserves are attributed to known accumulations that have a less likely chance of being recovered than probable reserves. This term is often used for reserves that are claimed to have at least a 10% certainty of being produced (“P10”). Reasons for classifying reserves as possible include varying interpretations of geology, reserves not producible at commercial rates, uncertainty due to reserve infill (seepage from adjacent areas), and projected reserves based on future recovery methods. They are referred to in the industry as “3P” (proven + probable + possible).
Figure 2.12 shows that world proved oil reserves at the end of 2012 reached 1668.9 billion barrels, sufficient to meet 52.9 years of global production. Even though an increase in official Iraqi reserves was the single largest addition, adding 6.9 billion barrels, subsequent data indicate that similar increase is also warranted due to current ability to access unconventional oil and gas. Organization of the Petroleum Exporting Countries (OPEC) members continue to dominate, holding 72.6% of the global total. South and Central America continue to hold the highest reserve/production ratio. Global proved reserves have increased by 26%, or nearly 350 billion barrels, over the past decade. This is similar to the rise in reported in the previous decade.
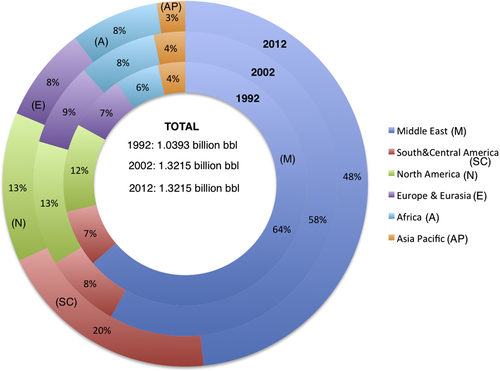
Figure 2.12 World proved reserve growth in last two decades. Data from BP, 2013.
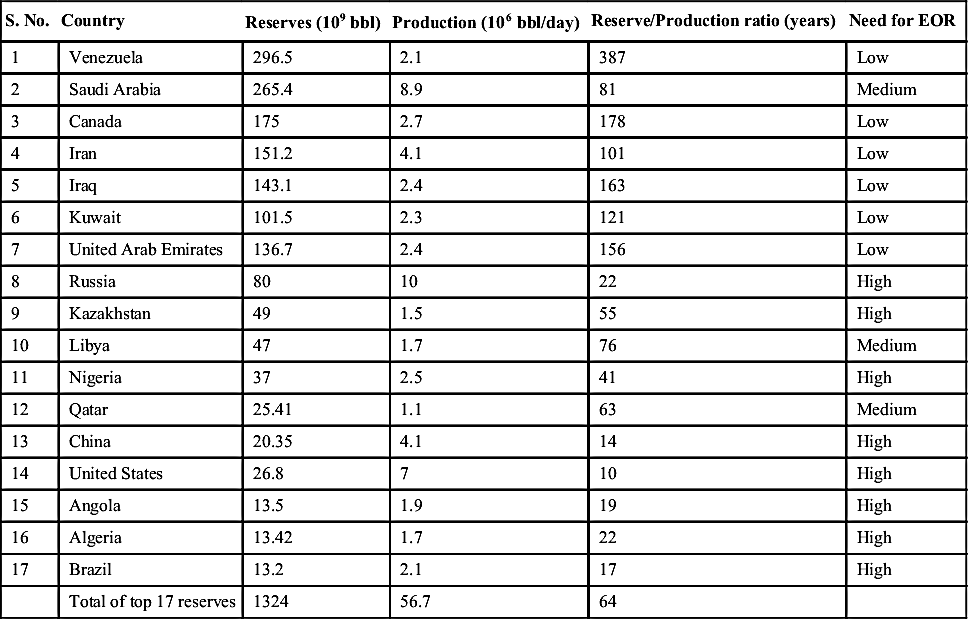
Table 2.1 shows total oil reserve as well as reserve/production ratio of top oil producing countries. Each country is marked for its need for enhanced oil recovery (EOR). Note that the need does not imply suitability nor does it mean that other countries would not benefit from an EOR scheme. This is a crucial element as the status of “reserve” depends on the technology that can increase the recovery in the short term.
This table shows Venezuela's proved reserve has surpassed that of Saudi Arabia. This is a recent development and partly fueled by the addition of unconventional petroleum to the previous reserve. Few countries routinely update their proven reserves. In addition, due to lack of consistent criteria, some national oil companies have resorted to back calculate original oil in place from a proven reserve value that had little relevance to original in place and was decided by political events (e.g., quota in OPEC). This problem, along with others, prompted the Society of Petroleum Engineers (SPE) to appoint a committee, titled Oil and Gas Reserves Committee (OGRC) that compiled a study of reserve/resource classification systems published by the following eight international entities:
Table 2.1
Summary of Proven Reserve Data as of 2012
| S. No. | Country | Reserves (109 bbl) | Production (106 bbl/day) | Reserve/Production ratio (years) | Need for EOR |
| 1 | Venezuela | 296.5 | 2.1 | 387 | Low |
| 2 | Saudi Arabia | 265.4 | 8.9 | 81 | Medium |
| 3 | Canada | 175 | 2.7 | 178 | Low |
| 4 | Iran | 151.2 | 4.1 | 101 | Low |
| 5 | Iraq | 143.1 | 2.4 | 163 | Low |
| 6 | Kuwait | 101.5 | 2.3 | 121 | Low |
| 7 | United Arab Emirates | 136.7 | 2.4 | 156 | Low |
| 8 | Russia | 80 | 10 | 22 | High |
| 9 | Kazakhstan | 49 | 1.5 | 55 | High |
| 10 | Libya | 47 | 1.7 | 76 | Medium |
| 11 | Nigeria | 37 | 2.5 | 41 | High |
| 12 | Qatar | 25.41 | 1.1 | 63 | Medium |
| 13 | China | 20.35 | 4.1 | 14 | High |
| 14 | United States | 26.8 | 7 | 10 | High |
| 15 | Angola | 13.5 | 1.9 | 19 | High |
| 16 | Algeria | 13.42 | 1.7 | 22 | High |
| 17 | Brazil | 13.2 | 2.1 | 17 | High |
| Total of top 17 reserves | 1324 | 56.7 | 64 |
EOR, Enhanced oil recovery.
1. US Security and Exchange Commission (SEC-1978)
2. UK Statement of Recommended Practices (SORP-2001)
3. Canadian Security Administrators (CSA-2002)
4. Russian Ministry of Natural Resources (RF-2005)
5. China Petroleum Reserves Office (PRO-2005)
6. Norwegian Petroleum Directorate (NPD-2001)
7. United States Geological Survey (USGS-1980)
8. United Nations Framework Classification (UNFC-2004)
The overall structure of, and reserves definitions within, each system were compared to the 1997 SPE/WPC reserves definitions, the 2000 SPE/WPC/AAPG classification, the 2001 supplemental guidelines, and the 2004 glossary (hereafter referred to as the “SPE definitions”). The following conclusions were drawn (SPE, 2005):
• All systems define major resource categories that can be mapped directly to the SPE categories: undiscovered (prospective resources), discovered unrecoverable, discovered subcommercial (contingent resources), and discovered commercial (reserves).
• Most classifications recognize three deterministic scenarios with decreasing technical certainty: a low estimate, best estimate, and high estimate. It is generally accepted that the equivalent estimates on a cumulative probability distribution would be greater than or equal to P90, P50, and P10, respectively. For discovered and commercial volume estimates, the discrete (incremental) volumes within these bounds are generally referred to as proved, probable, and possible reserves. The Russian, UNFC, and USGS recognize similar certainty classes but use alternative terminology.
• The regulatory agencies typically define a subset of the total classification for disclosure to investors and further impose specific rules around technical and commercial certainty. The SEC guidance is the most restrictive while the Canadian and UK regulations allow disclosures more closely aligned with assessments used for internal resource management.
• The UNFC uniquely provides a high-level classification system that can be applied to all extractive industries including energy minerals (petroleum, coal, and uranium).
Based on the above conclusions, the following recommendations were made:
• Utilize a consistent set of criteria to segregate discovered from undiscovered without reference to ultimate commerciality. All such discovered volumes should be initially categorized as contingent resources.
• Estimates of recoverable quantities must clearly identify the development project(s) applied to a specific accumulation (reservoir) and its in-place hydrocarbons. The “project-reservoir” intersect becomes the resource entity for which an uncertainty distribution of recoverable quantities is defined. The project maturity/chance of reaching production status is used to segregate reserves from contingent resources.
• To maintain consistency, the same class confidence hurdles (P90/P50/P10) should be applied to estimates whether assessed using deterministic or probabilistic methods. Although the assessment should support either arithmetic summation or probabilistic aggregation, the guidelines should clearly identify that these certainty guidelines apply to the project-reservoir entity.
• From a business perspective, the inclusion of additional deterministic technical and commercial criteria for reserves classes (proved, probable, possible) or discrete estimates (1P, 2P, 3P) may have value in providing increased consistency in assessments. However, these should be provided as guidelines and not imbedded in the class definitions. The definitions should be broad enough to accommodate such criteria as imposed by regulatory agencies.
• Apply developed/undeveloped status to all reserve classes. Reserves that remain undeveloped beyond a reasonable period demonstrate lack of commitment and should be reclassified as contingent resources.
• The definitions should encompass all hydrocarbons whether conventional or unconventional (gas, liquid, or solid phases) irrespective of the extraction method and processing applied.
• The total system should provide for accounting of all components to support mass balance; that is, the sum of produced, recoverable, production/processing losses, and unrecoverable quantities should equal the estimated initially in-place hydrocarbons. The guidelines should provide the option, subject to regulatory rules, of including hydrocarbons to be consumed as fuel in production and processing as reserves and contingent resources.
• Documentation regarding reserves and resources is best presented in a more structured manner consisting of:
Overall resource classification—chart and resource category definitions
Reserves definitions—high level, principle-based
Application guidelines—detailed guidance, subject to periodic revisions
Application examples—illustrations of both common and exceptional issues
This work of SPE highlights the need of going back to original definition of petroleum resource as per geologic and geophysical data irrespective of the technology being used. This solves the problem of coupling technology to the definition of reserve, which is of particular relevance when it comes to unconventional oil and gas. The total estimated amount of oil and gas in a petroleum reservoir is called the original oil or gas in place. Even though only a fraction of this oil can be brought to the surface, the fraction of produced oil and gas depends on several factors, most important of which is the enhanced oil and gas recovery technique used. For instance, it is estimated that 12% of oil in place in the United States is recoverable through EOR. This amount is incremental to other technologies (e.g., primary, secondary). This number is estimated to be much higher for gas reservoirs. However, few gas reservoirs are actually subject to enhanced gas recovery scheme. For unconventional gas and oil, the problem arises from the fact that the entire volume of unconventional oil and gas is considered to be nonproducible with conventional definition of “proven reserve.” As the prospect of unconventional oil and gas expands, the need to consider the entire oil and gas in place for future planning becomes a necessity (OPEC, 2011).
Even though Venezuela has exceeded Saudi Arabia in terms of oil (including gas condensate and liquid natural gas), it is generally recognized that Venezuelan deposits are more difficult to extract and are not readily available like Saudi Arabia. Figure 2.13 shows how proven reserve has evolved for some of the countries with greatest reserves. In recent years, Saudi Arabia and Canada both have held proved reserve at a constant value. Venezuela and Iran have made the most spectacular gains in proven reserve estimates. This gain is due to acceptance of internal data by OPEC and the rest of the world and it was not a matter of new technology of new discovery (Zatzman, 2012). There had to be some structural change in OPEC in order for it to recognize Venezuela's claim of greater reserve as legitimate. Of course, Iraq's reserve was updated due to uncertainties arising political unrests. A measure of the uncertainty about Iraq's oil reserves is indicated by widely differing estimates. The U.S. Department of Energy estimated in 2003 that Iraq had 112 billion barrels (17.8 × 10⁹ m3). In 1995, the USGS-estimated proven reserves were 78 billion bbl (12.4 × 10⁹ m3). Iraq's prewar deputy oil minister said that potential reserves might be 300 billion bbl (48 × 109 m3). The source of the uncertainty is that due to decades of war and unrest, many of Iraq's oil wells are rundown and unkept. Repairs to the wells and oil facilities should make far more oil available economically from the same deposits. This intermingling of political, technical, and social issues is characteristic of oil business.
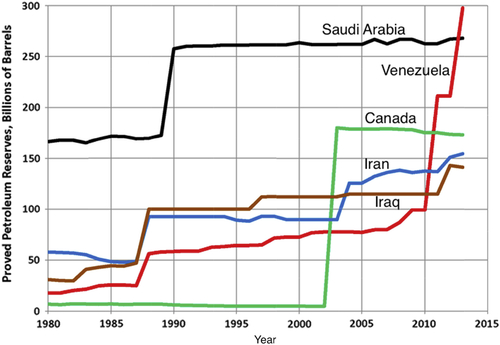
Figure 2.13 Proven reserve of top holders of petroleum reserve. Data from USA EIA.
Even for the OECD countries, such as Canada, estimation of proven reserve is not without controversy. For instance, when Alberta's oil sand deposits of 174 billion barrels (28 × 109 m3) were added as proven reserves by the Alberta Energy and Utilities Board, now known as the Energy Resources Conservation Board (ERCB), a great deal of skepticism was offered because oil sand is not “readily” usable as a petroleum resource.
While it is true that oil sand has to be mined, heated, or diluted with solvents to allow it to be produced and must be upgraded to lighter oil to be usable by refineries, it is still economically attractive, particularly in view of the vastness of the resource. Historically known as bituminous sands or sometimes as “tar sands,” the deposits were exposed as major rivers cut through the oil-bearing formations to reveal the bitumen in the river banks. In recent years technological breakthroughs have overcome the economical and technical difficulties of producing the oil sands, and by 2007 64% of Alberta's petroleum production of 1.86 million barrels per day (296,000 m3/day) was from oil sands rather than conventional oil fields. The ERCB estimates that by 2017 oil sands production will make up 88% of Alberta's predicted oil production of 3.4 million barrels per day (540,000 m3/day) (ERCB, 2008). Until now, OPEC does not recognize Canada's oil sand reserve as part of the “proved reserve.”
2.4. Worldwide Gas Reserve
Some of the most dramatic energy developments of recent years have been in the realm of natural gas. Even before the “rush” of unconventional shale and tight gas, natural gas has been prominent in the post-Cold War era. In early 2000, the natural gas price remained low while huge quantities of unconventional gas entered commercial levels of production in the United States, changing the strategic picture for the United States by making it self-sufficient in natural gas for the foreseeable future. The benefit of such production boon transformed into US domestic production surpassing import in 2013. This would occur after some 16 years of opposite trend (Bloomberg, 2013). This phenomenon is somewhat different in Europe. Some 30% of European gas demand is met by Russian natural gas. Russia, even though second to USA, is the largest exporter.
Even before former USSR broke down, gas export from Russia had been declining. Even though such decline is often correlated with political events and US hegemony, the fact remains that the so-called “gas war” had to break out in order to restore values of natural gas to the level comparable to crude oil or petroleum liquids. Even though Gazprom was privatized in 2005, the Russian government has held a controlling share in Gazprom. The earliest sign of restoration of natural gas price to an equitable value was in place when on October 2, 2008, the Ukrainian Prime Minister Julia Timoshenko and the then Russian Prime Minister Vladimir Putin had agreed in a memorandum on the Ukraine raising the gas price to world market standards within the next three years. Previous to that, Russia had delivered gas to the Ukraine far below world market prices until the end of 2008, namely for US$ 180/1000 m3. Gazprom itself had to import the gas that they delivered to the Ukraine, namely from Central Asian states—at a price of US$ 375/1000 m3. This led to a billion dollar deficit for the Russian gas supplier.
At the end of 2008, the existing contract between the Russian Gazprom and the Ukrainian gas corporations expired—both gas corporations are under state control. A new contract about a new gas price in terms of the October 2008 memorandum and valid from January 1, 2009 on was prevented by the Ukraine, although Russia had made an offer to deliver the gas at a price of US$ 250/1000 m3, which is less than the current world market price.
Thus Gazprom stopped its gas deliveries to the Ukraine on January 1, 2009. And this led to Ukraine unlawfully tapping the transit pipelines running through the Ukraine to other European states. Russia reacted by discontinuing the gas transfer across the Ukraine, completely.
Gazprom has an interesting background. Originally, Gazprom was an offshoot of the Soviet Gas Ministry, set up in 1965 when the USSR decided to develop the production and consumption of gas. In 1989, Gazprom became an “independent” company, in line with Khrushchev's original initiative to “modernize” USSR economy. Its first chairman was Viktor Chernomyrdin, a former prime minister of Russia under Boris Yeltsin and an ambassador to Ukraine (2001–2009). In August 1989, under the leadership of Chernomyrdin, the Ministry of Gas Industry was transformed itself into the State Gas Concern, Gazprom, which became the country's first state-corporate enterprise. Chernomyrdin was elected its first chairman. The company was still controlled by the state, but now the control was exercised through shares of stock, 100% of which were owned by the state. When the Soviet Union dissolved in late 1991, assets of the former Soviet state in the gas sector were transferred to newly created national companies such as Ukrgazprom and Turkmengazprom. Gazprom kept assets located in the territory of Russia and was able to secure a monopoly in the gas sector.
Gazprom's political influence increased markedly after the new Russian President Boris Yeltsin appointed the company's chairman Chernomyrdin as his Prime Minister in 1992. Rem Viakhirev took Chernomyrdin's place as Chairman both of the Board of Directors and of the Managing Committee. Gazprom was one of the backbones of the country's economy in 1990s, though the company underperformed during that decade. This was mainly because gas price was much lower than its equitable value. In the 2000s, Gazprom became the largest extractor of natural gas in the world and the largest Russian company. In 1993, the company was reorganized into a joint-stock company named RAO Gazprom, before becoming OAO Gazprom in 1998, the name it retains to this day.
In 2005, the Russian state became the company's majority shareholder with 50.01% of the share capital. At present Gazprom controls 25% of the world's gas reserve and 94% of Russia's natural gas. Gazprom owns the entire gas transport infrastructure in Russia—some 144,000 km of pipelines—and all of the country's compressor stations. It is the only company legally authorized to sell gas outside Russia. Gazprom employs around 300,000 people and represents 25% of Russia's total budgetary revenue.
This combination of energy and politics has made Gazprom an instrument of politico-social regulation in Russia. Russia is the world's second largest consumer of gas after the United States, although its economic power is almost 20 times less that of the United States. Russia therefore wastes its energy. Table 2.2 shows natural gas consumption of world's top 25 consumers.
The average price of 1000 cubic meters of gas for a Russian household has remained for a long time near US$ 15, although it did come close to US$ 40 in 2006. The low gas prices also reflect political interests: companies, which are not very competitive and major users of energy, can use them to lower their costs; low gas prices also prevent many Russian households from experiencing financial difficulties, which would happen if were prices to rise.
Soon after the first “gas war” the gas price rose to an unprecedented US$12/MMBtu (million Btu). However, the gas price has fluctuated ever since and hit a low value in mid-2012 in sync with “gas glut” due to unconventional gas production in the United States (Figure 2.14). This production of unconventional gas reverberated around the world and is synonymous with the culture of “fracking.” In early 2014, gas price in the United States rose to a 6-year high mainly because of a severe cold spill. Even then, the real crisis began in late February of 2014.
It must be added that Russia has been trying for some time to gain access to the Ukrainian pipeline network in order to invest in the system of pipelines and guarantee an uninterrupted gas delivery to Europe. It has therefore suggested to establish an international consortium for the maintenance of that network. In 2014, the political crisis led to threat of invasion of Crimea; Gazprom declared it intends to start charging Ukraine around US$ 400/1000 m3 for its gas, as opposed to the $270-odd it has been paying since Yanukovych spurned Brussels for Moscow.
In the mean time, since the first “gas war” of 2006, many European countries have made huge efforts to increase their gas storage capacity and stocks high. Some countries, such as Bulgaria, Slovakia, and Moldova, which lack large storage capacity and depend heavily on gas supplies via Ukraine, would certainly suffer from any disruption in supplies. But Gas Infrastructure Europe, which represents the gas infrastructure industry, estimated that in late February European gas storage was 10% points higher than this time last year and about half full; the National Grid puts Britain's stocks at about 25% points above the average for that time of year.
Table 2.2
Natural Gas Consumption of Top 25 Consumers
| Rank | Country | Natural gas consumption (cubic meters/year) | Date of information |
| 1 | United States | 689,900,000,000 | 2011 est. |
| 2 | Russia | 457,200,000,000 | 2012 est. |
| 3 | European Union | 443,900,000,000 | 2010 est. |
| 4 | Iran | 144,600,000,000 | 2010 est. |
| 5 | China | 143,000,000,000 | 2011 est. |
| 6 | Japan | 112,600,000,000 | 2011 est. |
| 7 | Saudi Arabia | 99,230,000,000 | 2011 est. |
| 8 | Canada | 82,480,000,000 | 2010 est. |
| 9 | United Kingdom | 82,210,000,000 | 2011 est. |
| 10 | Germany | 75,200,000,000 | 2010 est. |
| 11 | Italy | 68,700,000,000 | 2010 est. |
| 12 | India | 64,490,000,000 | 2010 est. |
| 13 | United Arab Emirates | 60,540,000,000 | 2010 est. |
| 14 | Mexico | 59,150,000,000 | 2011 est. |
| 15 | Ukraine | 56,200,000,000 | 2010 est. |
| 16 | Netherlands | 54,850,000,000 | 2010 est. |
| 17 | Korea, South | 49,660,000,000 | 2011 est. |
| 18 | France | 47,990,000,000 | 2010 est. |
| 19 | Uzbekistan | 46,800,000,000 | 2012 est. |
| 20 | Egypt | 46,170,000,000 | 2010 est. |
| 21 | Thailand | 45,080,000,000 | 2010 est. |
| 22 | Argentina | 43,290,000,000 | 2010 est. |
| 23 | Pakistan | 42,900,000,000 | 2011 est. |
| 24 | Indonesia | 39,560,000,000 | 2010 est. |
| 25 | Turkey | 38,130,000,000 | 2010 est. |
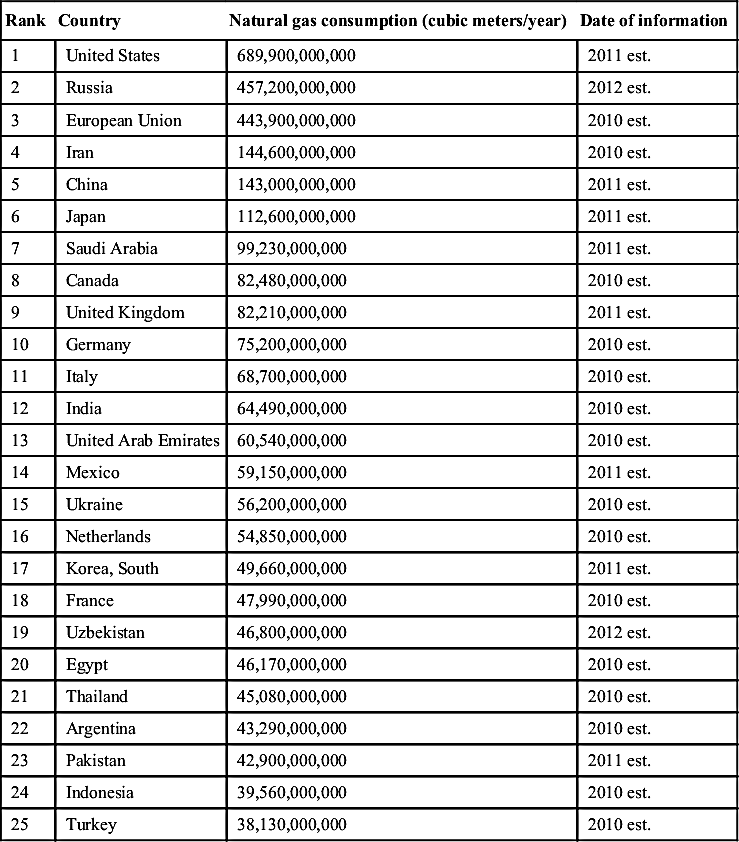
CIA Factbook.
Russia is Europe's biggest gas supplier, providing around a quarter of continental demand, which at current daily flows of 270 million cubic meters is worth almost US$ 100 million a day. Around a third of Russia's gas is exported through Ukraine (Figure 2.15).
In this energy politics scenario, natural gas from unconventional sources looms large. Access to such reservoirs means longstanding gas exporters, such as Russia, now have to fight for their share of the market. Previously such competition was offered only from producers such as Qatar that would export to Europe in the form of liquefied natural gas. The unconventional reserves will also compensate for any “glut” created through North Sea gas that has captured a good share of the European market. The recent improvement in fracking technologies has opened up eastern Europe to major oil companies such as Chevron, who have been very active in western Ukraine, Poland, and Romania over the last two years, signing agreements to commence drilling operations in these countries. Fracking technology has been proven to be efficient in numerous cases in the United States. However, this is not the only technology that can make unconventional resources appealing. Emerging technologies as well as technologies well established in other areas of petroleum engineering will make much higher amount of natural gas available with minimum additional cost of production and operations. This contribution is markedly superior both in environmental and economic term than offshore reserves that are currently considered to be the alternative to “political gas.”
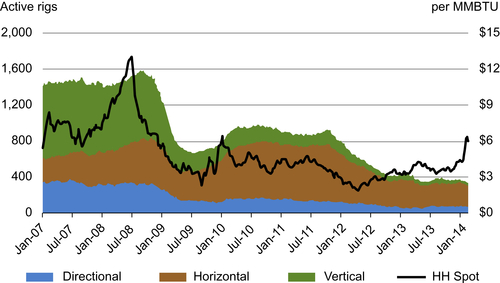
Figure 2.14 History of gas price and active rigs. From EIA.
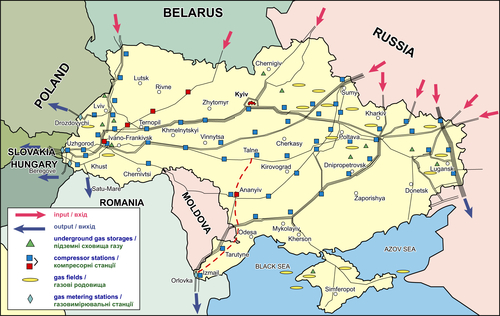
Figure 2.15 One-third of Russia's supply to Europe go through Ukraine.
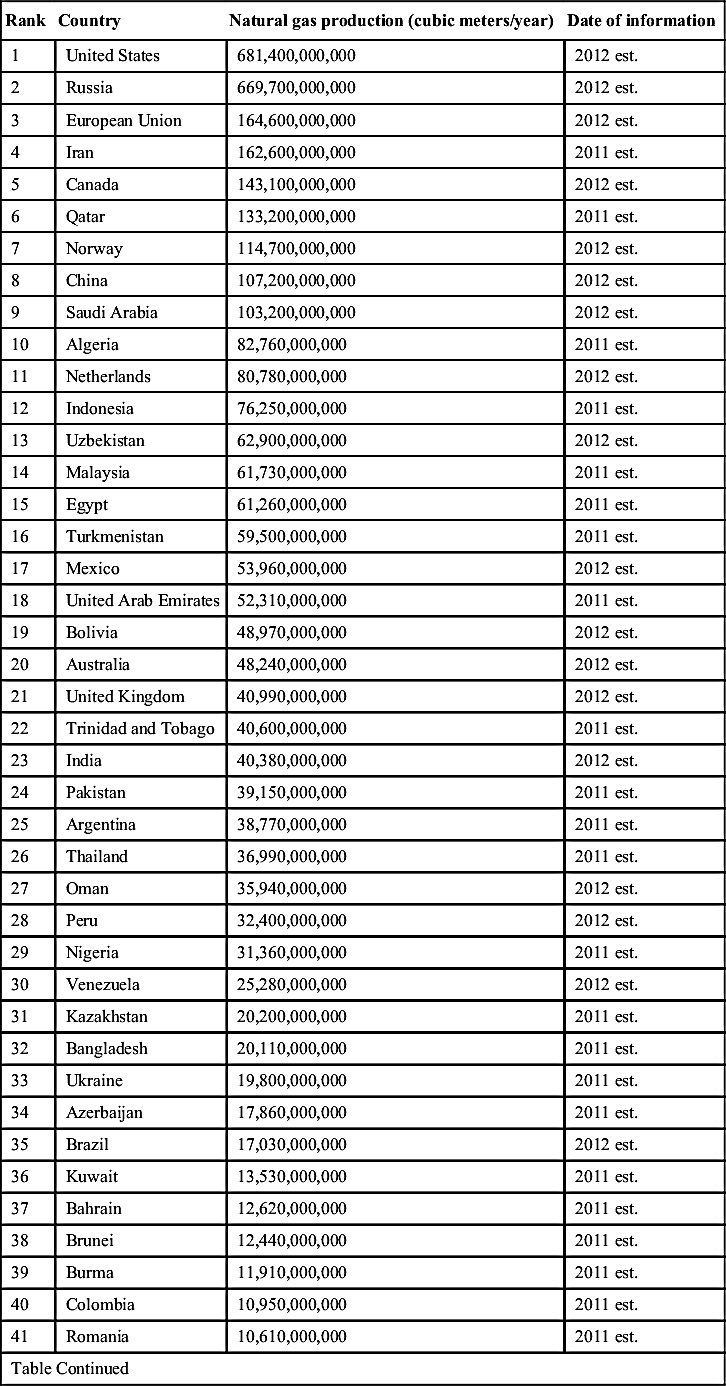
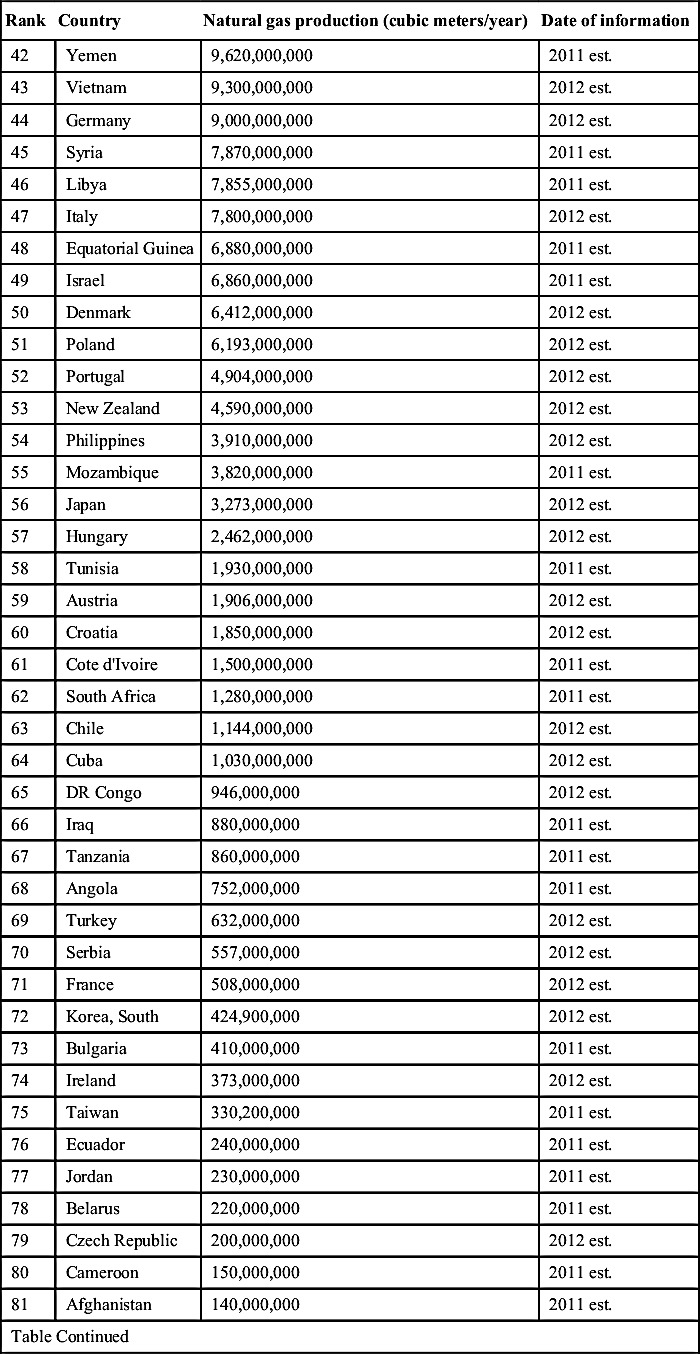
Table 2.3 shows the yearly natural gas production from various countries, as supplied by CIA Factbook.
The natural gas production should be tallied against natural gas export in order to determine the overall dependence or dominance of a country in natural gas trade. Table 2.4 shows natural gas export by various countries. Note how the ranking changes from producers to exporters.
Of significance is how the United States has grown both in its production as well as export of natural gas. Figure 2.16 shows how exponential growth has taken place in US export of natural gas.
During the same period, considerable decline in natural gas import has taken place. This is evident from Figure 2.17. Coinciding with the first “gas war” that saw a price hike of natural gas worldwide, the United States has successfully decreased its net import of natural gas. This trend continues even when unusually cold winter in United States (simultaneous with unusually warm winter in Europe) led to record consumption of natural gas in 2013.
Figure 2.18 shows the natural gas export history of Russia. Interestingly Russia and USA share opposite profiles in terms of net export. Soon after the gas crisis of 2006, Russia's export declined sharply whereas that of United States increased, while its imports decreased. The United States exports continue to increase while imports continue to decline right through the financial crisis of 2008. This surplus can be explained with the emergence of “fracking” technology that unlocked tremendous amount of unconventional gas, particularly that from shale gas resources. Figure 2.19 shows shares of natural gas from various sources in the United States.
Table 2.3
Natural Gas Production from Various Countries
| Rank | Country | Natural gas production (cubic meters/year) | Date of information |
| 1 | United States | 681,400,000,000 | 2012 est. |
| 2 | Russia | 669,700,000,000 | 2012 est. |
| 3 | European Union | 164,600,000,000 | 2012 est. |
| 4 | Iran | 162,600,000,000 | 2011 est. |
| 5 | Canada | 143,100,000,000 | 2012 est. |
| 6 | Qatar | 133,200,000,000 | 2011 est. |
| 7 | Norway | 114,700,000,000 | 2012 est. |
| 8 | China | 107,200,000,000 | 2012 est. |
| 9 | Saudi Arabia | 103,200,000,000 | 2012 est. |
| 10 | Algeria | 82,760,000,000 | 2011 est. |
| 11 | Netherlands | 80,780,000,000 | 2012 est. |
| 12 | Indonesia | 76,250,000,000 | 2011 est. |
| 13 | Uzbekistan | 62,900,000,000 | 2012 est. |
| 14 | Malaysia | 61,730,000,000 | 2011 est. |
| 15 | Egypt | 61,260,000,000 | 2011 est. |
| 16 | Turkmenistan | 59,500,000,000 | 2011 est. |
| 17 | Mexico | 53,960,000,000 | 2012 est. |
| 18 | United Arab Emirates | 52,310,000,000 | 2011 est. |
| 19 | Bolivia | 48,970,000,000 | 2012 est. |
| 20 | Australia | 48,240,000,000 | 2012 est. |
| 21 | United Kingdom | 40,990,000,000 | 2012 est. |
| 22 | Trinidad and Tobago | 40,600,000,000 | 2011 est. |
| 23 | India | 40,380,000,000 | 2012 est. |
| 24 | Pakistan | 39,150,000,000 | 2011 est. |
| 25 | Argentina | 38,770,000,000 | 2011 est. |
| 26 | Thailand | 36,990,000,000 | 2011 est. |
| 27 | Oman | 35,940,000,000 | 2012 est. |
| 28 | Peru | 32,400,000,000 | 2012 est. |
| 29 | Nigeria | 31,360,000,000 | 2011 est. |
| 30 | Venezuela | 25,280,000,000 | 2012 est. |
| 31 | Kazakhstan | 20,200,000,000 | 2011 est. |
| 32 | Bangladesh | 20,110,000,000 | 2011 est. |
| 33 | Ukraine | 19,800,000,000 | 2011 est. |
| 34 | Azerbaijan | 17,860,000,000 | 2011 est. |
| 35 | Brazil | 17,030,000,000 | 2012 est. |
| 36 | Kuwait | 13,530,000,000 | 2011 est. |
| 37 | Bahrain | 12,620,000,000 | 2011 est. |
| 38 | Brunei | 12,440,000,000 | 2011 est. |
| 39 | Burma | 11,910,000,000 | 2011 est. |
| 40 | Colombia | 10,950,000,000 | 2011 est. |
| 41 | Romania | 10,610,000,000 | 2011 est. |
| Table Continued | |||
| Rank | Country | Natural gas production (cubic meters/year) | Date of information |
| 42 | Yemen | 9,620,000,000 | 2011 est. |
| 43 | Vietnam | 9,300,000,000 | 2012 est. |
| 44 | Germany | 9,000,000,000 | 2012 est. |
| 45 | Syria | 7,870,000,000 | 2011 est. |
| 46 | Libya | 7,855,000,000 | 2011 est. |
| 47 | Italy | 7,800,000,000 | 2012 est. |
| 48 | Equatorial Guinea | 6,880,000,000 | 2011 est. |
| 49 | Israel | 6,860,000,000 | 2011 est. |
| 50 | Denmark | 6,412,000,000 | 2012 est. |
| 51 | Poland | 6,193,000,000 | 2012 est. |
| 52 | Portugal | 4,904,000,000 | 2012 est. |
| 53 | New Zealand | 4,590,000,000 | 2012 est. |
| 54 | Philippines | 3,910,000,000 | 2012 est. |
| 55 | Mozambique | 3,820,000,000 | 2011 est. |
| 56 | Japan | 3,273,000,000 | 2012 est. |
| 57 | Hungary | 2,462,000,000 | 2012 est. |
| 58 | Tunisia | 1,930,000,000 | 2011 est. |
| 59 | Austria | 1,906,000,000 | 2012 est. |
| 60 | Croatia | 1,850,000,000 | 2012 est. |
| 61 | Cote d'Ivoire | 1,500,000,000 | 2011 est. |
| 62 | South Africa | 1,280,000,000 | 2011 est. |
| 63 | Chile | 1,144,000,000 | 2012 est. |
| 64 | Cuba | 1,030,000,000 | 2012 est. |
| 65 | DR Congo | 946,000,000 | 2012 est. |
| 66 | Iraq | 880,000,000 | 2011 est. |
| 67 | Tanzania | 860,000,000 | 2011 est. |
| 68 | Angola | 752,000,000 | 2011 est. |
| 69 | Turkey | 632,000,000 | 2012 est. |
| 70 | Serbia | 557,000,000 | 2012 est. |
| 71 | France | 508,000,000 | 2012 est. |
| 72 | Korea, South | 424,900,000 | 2012 est. |
| 73 | Bulgaria | 410,000,000 | 2011 est. |
| 74 | Ireland | 373,000,000 | 2012 est. |
| 75 | Taiwan | 330,200,000 | 2011 est. |
| 76 | Ecuador | 240,000,000 | 2011 est. |
| 77 | Jordan | 230,000,000 | 2011 est. |
| 78 | Belarus | 220,000,000 | 2011 est. |
| 79 | Czech Republic | 200,000,000 | 2012 est. |
| 80 | Cameroon | 150,000,000 | 2011 est. |
| 81 | Afghanistan | 140,000,000 | 2011 est. |
| Table Continued | |||
| Rank | Country | Natural gas production (cubic meters/year) | Date of information |
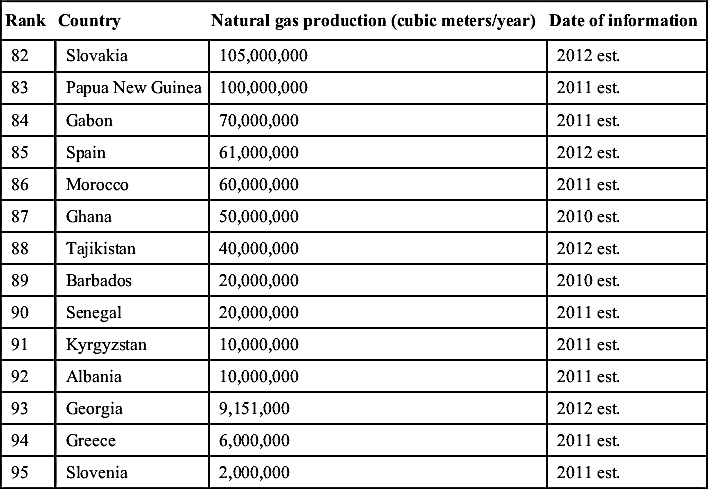
| 82 | Slovakia | 105,000,000 | 2012 est. |
| 83 | Papua New Guinea | 100,000,000 | 2011 est. |
| 84 | Gabon | 70,000,000 | 2011 est. |
| 85 | Spain | 61,000,000 | 2012 est. |
| 86 | Morocco | 60,000,000 | 2011 est. |
| 87 | Ghana | 50,000,000 | 2010 est. |
| 88 | Tajikistan | 40,000,000 | 2012 est. |
| 89 | Barbados | 20,000,000 | 2010 est. |
| 90 | Senegal | 20,000,000 | 2011 est. |
| 91 | Kyrgyzstan | 10,000,000 | 2011 est. |
| 92 | Albania | 10,000,000 | 2011 est. |
| 93 | Georgia | 9,151,000 | 2012 est. |
| 94 | Greece | 6,000,000 | 2011 est. |
| 95 | Slovenia | 2,000,000 | 2011 est. |
It can be seen from Figure 2.19 that shale gas is the only one that has been rising continuously during the period in question. The U.S. Energy Information Association (EIA) projection shows that such rise will continue for next few decades. What is of importance here is that tight gas as well as CBM resources are predicted to hold steady. However, new technologies or more sustainable techniques can unlock significant amount from these reservoirs that have quite high original gas in place. That would change the dynamics of natural gas market in the United States as well as the world. Russia is estimated to have 5–20 trillion cubic meters (Tcm) of natural gas in unconventional reservoirs. However, these reservoirs remain untapped mainly because Russia's conventional reserve is so vast that they do not see prudence in creating gas glut by exploiting unconventional resources.
Canada offers an interesting perspective to global natural gas market. Figure 2.20 shows Canadian production and consumption history over the years 2000–2011. In most part Canadian production and net export has remained steady throughout this period. During the 2008-financial crisis and its aftermath, there was some decline in consumption of natural gas, which resulted in decline in overall production of natural gas but this did not affect the net export. Canada does have an estimated 1000 Tcf of unconventional gas, but most of it remains undeveloped. However, this scenario is changing as several “fracking” projects are underway.
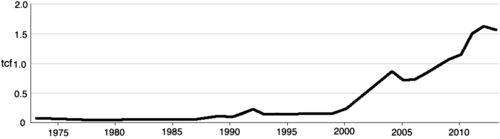
Figure 2.16 US export of natural gas.
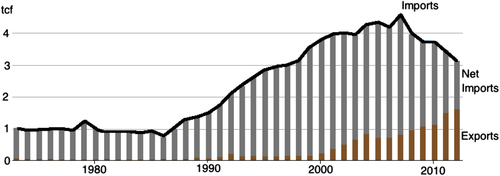
Figure 2.17 US export and import of natural gas. Data from EIA.
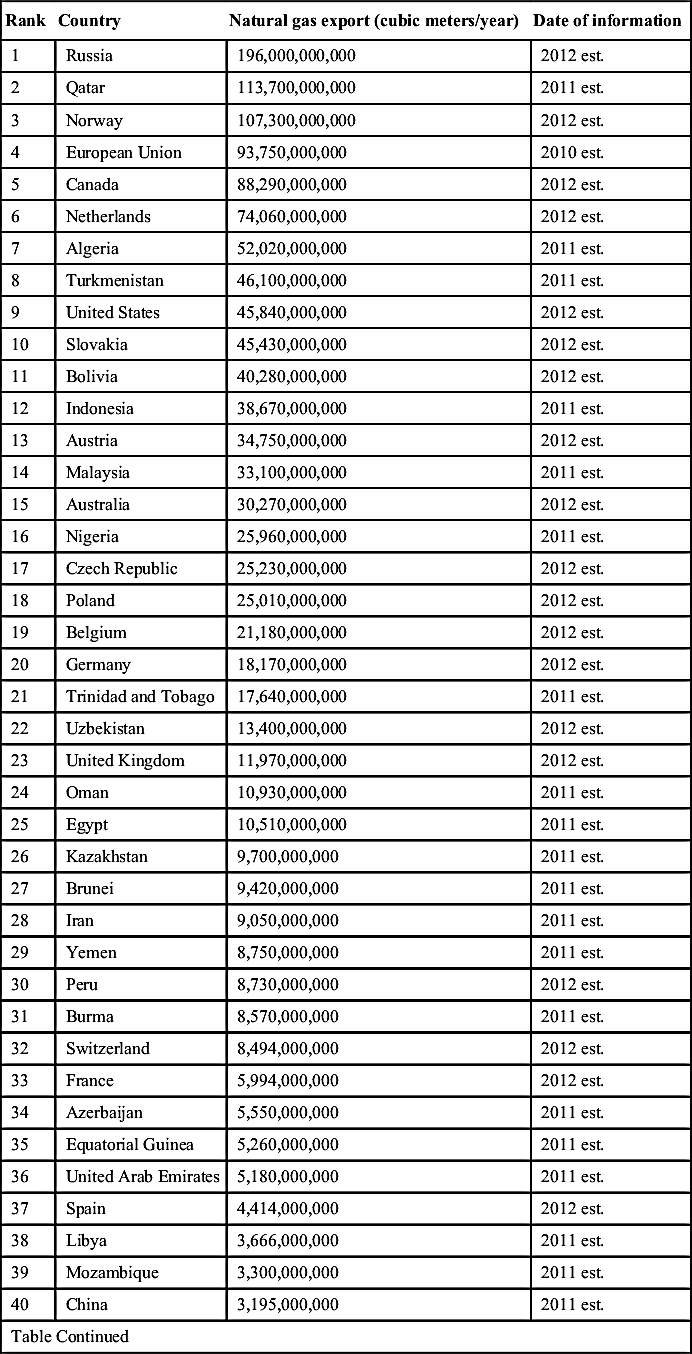
Table 2.4
Natural Gas Export by Various Countries
| Rank | Country | Natural gas export (cubic meters/year) | Date of information |
| 1 | Russia | 196,000,000,000 | 2012 est. |
| 2 | Qatar | 113,700,000,000 | 2011 est. |
| 3 | Norway | 107,300,000,000 | 2012 est. |
| 4 | European Union | 93,750,000,000 | 2010 est. |
| 5 | Canada | 88,290,000,000 | 2012 est. |
| 6 | Netherlands | 74,060,000,000 | 2012 est. |
| 7 | Algeria | 52,020,000,000 | 2011 est. |
| 8 | Turkmenistan | 46,100,000,000 | 2011 est. |
| 9 | United States | 45,840,000,000 | 2012 est. |
| 10 | Slovakia | 45,430,000,000 | 2012 est. |
| 11 | Bolivia | 40,280,000,000 | 2012 est. |
| 12 | Indonesia | 38,670,000,000 | 2011 est. |
| 13 | Austria | 34,750,000,000 | 2012 est. |
| 14 | Malaysia | 33,100,000,000 | 2011 est. |
| 15 | Australia | 30,270,000,000 | 2012 est. |
| 16 | Nigeria | 25,960,000,000 | 2011 est. |
| 17 | Czech Republic | 25,230,000,000 | 2012 est. |
| 18 | Poland | 25,010,000,000 | 2012 est. |
| 19 | Belgium | 21,180,000,000 | 2012 est. |
| 20 | Germany | 18,170,000,000 | 2012 est. |
| 21 | Trinidad and Tobago | 17,640,000,000 | 2011 est. |
| 22 | Uzbekistan | 13,400,000,000 | 2012 est. |
| 23 | United Kingdom | 11,970,000,000 | 2012 est. |
| 24 | Oman | 10,930,000,000 | 2011 est. |
| 25 | Egypt | 10,510,000,000 | 2011 est. |
| 26 | Kazakhstan | 9,700,000,000 | 2011 est. |
| 27 | Brunei | 9,420,000,000 | 2011 est. |
| 28 | Iran | 9,050,000,000 | 2011 est. |
| 29 | Yemen | 8,750,000,000 | 2011 est. |
| 30 | Peru | 8,730,000,000 | 2012 est. |
| 31 | Burma | 8,570,000,000 | 2011 est. |
| 32 | Switzerland | 8,494,000,000 | 2012 est. |
| 33 | France | 5,994,000,000 | 2012 est. |
| 34 | Azerbaijan | 5,550,000,000 | 2011 est. |
| 35 | Equatorial Guinea | 5,260,000,000 | 2011 est. |
| 36 | United Arab Emirates | 5,180,000,000 | 2011 est. |
| 37 | Spain | 4,414,000,000 | 2012 est. |
| 38 | Libya | 3,666,000,000 | 2011 est. |
| 39 | Mozambique | 3,300,000,000 | 2011 est. |
| 40 | China | 3,195,000,000 | 2011 est. |
| Table Continued | |||
| Rank | Country | Natural gas export (cubic meters/year) | Date of information |
| 41 | Denmark | 2,983,000,000 | 2012 est. |
| 42 | Hungary | 2,837,000,000 | 2012 est. |
| 43 | Ukraine | 2,600,000,000 | 2010 est. |
| 44 | Colombia | 2,110,000,000 | 2011 est. |
| 45 | Slovenia | 1,181,000,000 | 2012 est. |
| 46 | Turkey | 600,000,000 | 2012 est. |
| 47 | Brazil | 400,000,000 | 2012 est. |
| 48 | Italy | 324,000,000 | 2012 est. |
| 49 | Croatia | 222,000,000 | 2012 est. |
| 50 | Argentina | 200,000,000 | 2011 est. |
| 51 | DR Congo | 39,000,000 | 2012 est. |
| 52 | Mexico | 11,000,000 | 2012 est. |
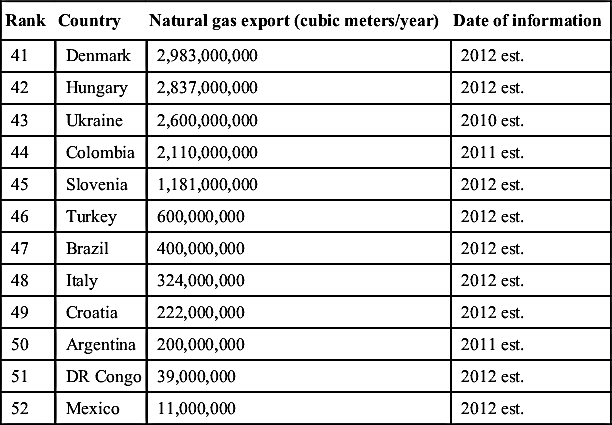
From CIA Factbook.
Of the above, a significant natural gas production comes from unconventional sources. For instance, see Figure 2.21 that shows the gas production from shale gas.
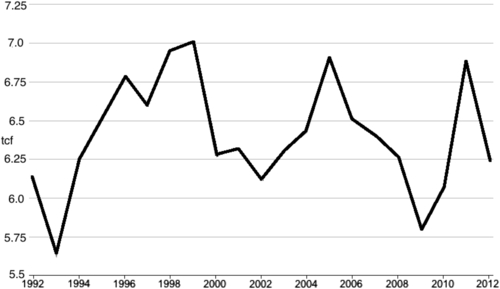
Figure 2.18 Net export of Russia. Data from EIA.
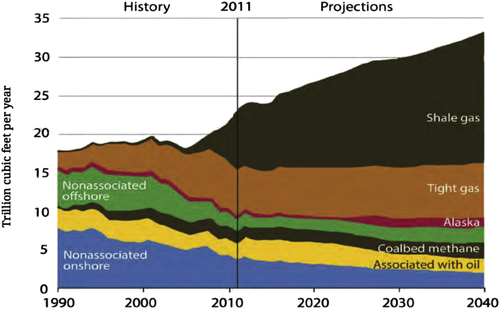
Figure 2.19 Shares of various natural gas sources in the United States. Data from EIA.
The term “proven gas reserve” is not free of controversy, even though natural gas is free from the constraints associated to liquid petroleum recovery. Based on data from BP, at the end of 2009 proven gas reserves were dominated by three countries: Iran, Russia, and Qatar, which together held nearly half the world's proven reserves.
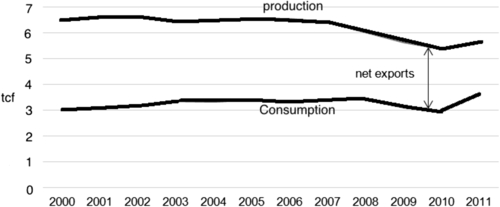
Figure 2.20 Import and export of Canada. Data from EIA.
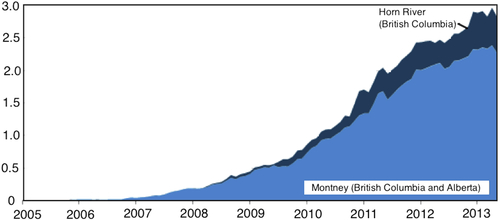
Figure 2.21 Shale gas production (billion cubic feet per day) from Canada. Data from Canadian National Energy Board.
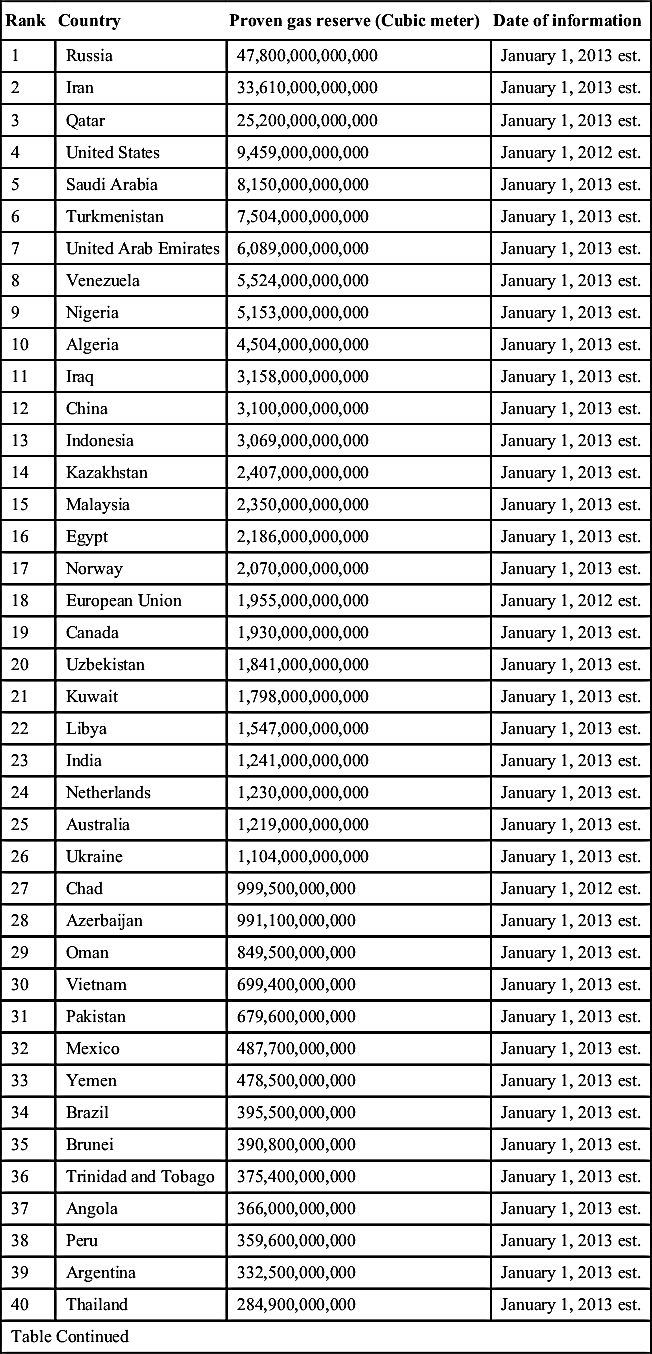
There is some disagreement on which country has the largest proven gas reserves. Sources that list Russia as having by far the largest proven reserves include the US CIA (47.6 Tcm), the Oil and Gas Journal (47.8 Tcm), the U.S. EIA (47.8 Tcm), and OPEC (48.7 Tcm). However, BP credits Russia with only 32.9 Tcm, which would place it in second place, slightly behind Iran (33.1–33.8 Tcm, depending on the source). CIA Factbook gives the following list (Table 2.5) of proven gas reserve of countries that are known to have gas.
BP on the other hand gives the following list (Table 2.6) of reserves.
Figure 2.22 shows historical listing of proved natural gas reserves for top five countries. During last 30 years, Iran has been adding to its proved gas reserve steadily. This is typical of an underdeveloped natural resource. The political side of it has been discussed in the context of proved oil reserve. Qatar had similar increase but it was halted in 2004. The proven reserve of Saudi Arabia has been increasing steadily since 1980. For the United States, there has been a period of decline in proven gas reserve. However, shortly after 2000, the gas reserve has been increasing mainly due to the addition of unconventional gas.
Table 2.5
Proven Gas Reserve of Different Countries as per CIA Factbook
| Rank | Country | Proven gas reserve (Cubic meter) | Date of information |
| 1 | Russia | 47,800,000,000,000 | January 1, 2013 est. |
| 2 | Iran | 33,610,000,000,000 | January 1, 2013 est. |
| 3 | Qatar | 25,200,000,000,000 | January 1, 2013 est. |
| 4 | United States | 9,459,000,000,000 | January 1, 2012 est. |
| 5 | Saudi Arabia | 8,150,000,000,000 | January 1, 2013 est. |
| 6 | Turkmenistan | 7,504,000,000,000 | January 1, 2013 est. |
| 7 | United Arab Emirates | 6,089,000,000,000 | January 1, 2013 est. |
| 8 | Venezuela | 5,524,000,000,000 | January 1, 2013 est. |
| 9 | Nigeria | 5,153,000,000,000 | January 1, 2013 est. |
| 10 | Algeria | 4,504,000,000,000 | January 1, 2013 est. |
| 11 | Iraq | 3,158,000,000,000 | January 1, 2013 est. |
| 12 | China | 3,100,000,000,000 | January 1, 2013 est. |
| 13 | Indonesia | 3,069,000,000,000 | January 1, 2013 est. |
| 14 | Kazakhstan | 2,407,000,000,000 | January 1, 2013 est. |
| 15 | Malaysia | 2,350,000,000,000 | January 1, 2013 est. |
| 16 | Egypt | 2,186,000,000,000 | January 1, 2013 est. |
| 17 | Norway | 2,070,000,000,000 | January 1, 2013 est. |
| 18 | European Union | 1,955,000,000,000 | January 1, 2012 est. |
| 19 | Canada | 1,930,000,000,000 | January 1, 2013 est. |
| 20 | Uzbekistan | 1,841,000,000,000 | January 1, 2013 est. |
| 21 | Kuwait | 1,798,000,000,000 | January 1, 2013 est. |
| 22 | Libya | 1,547,000,000,000 | January 1, 2013 est. |
| 23 | India | 1,241,000,000,000 | January 1, 2013 est. |
| 24 | Netherlands | 1,230,000,000,000 | January 1, 2013 est. |
| 25 | Australia | 1,219,000,000,000 | January 1, 2013 est. |
| 26 | Ukraine | 1,104,000,000,000 | January 1, 2013 est. |
| 27 | Chad | 999,500,000,000 | January 1, 2012 est. |
| 28 | Azerbaijan | 991,100,000,000 | January 1, 2013 est. |
| 29 | Oman | 849,500,000,000 | January 1, 2013 est. |
| 30 | Vietnam | 699,400,000,000 | January 1, 2013 est. |
| 31 | Pakistan | 679,600,000,000 | January 1, 2013 est. |
| 32 | Mexico | 487,700,000,000 | January 1, 2013 est. |
| 33 | Yemen | 478,500,000,000 | January 1, 2013 est. |
| 34 | Brazil | 395,500,000,000 | January 1, 2013 est. |
| 35 | Brunei | 390,800,000,000 | January 1, 2013 est. |
| 36 | Trinidad and Tobago | 375,400,000,000 | January 1, 2013 est. |
| 37 | Angola | 366,000,000,000 | January 1, 2013 est. |
| 38 | Peru | 359,600,000,000 | January 1, 2013 est. |
| 39 | Argentina | 332,500,000,000 | January 1, 2013 est. |
| 40 | Thailand | 284,900,000,000 | January 1, 2013 est. |
| Table Continued | |||
| Rank | Country | Proven gas reserve (Cubic meter) | Date of information |
| 41 | Burma | 283,200,000,000 | January 1, 2013 est. |
| 42 | Bolivia | 281,500,000,000 | January 1, 2013 est. |
| 43 | Israel | 268,500,000,000 | January 1, 2013 est. |
| 44 | United Kingdom | 246,000,000,000 | January 1, 2013 est. |
| 45 | Syria | 240,700,000,000 | January 1, 2013 est. |
| 46 | Timor-Leste | 200,000,000,000 | January 1, 2006 est. |
| 47 | Bangladesh | 183,700,000,000 | January 1, 2013 est. |
| 48 | Colombia | 169,900,000,000 | January 1, 2013 est. |
| 49 | Papua New Guinea | 155,300,000,000 | January 1, 2013 est. |
| 50 | Cameroon | 135,100,000,000 | January 1, 2013 est. |
| 51 | Mozambique | 127,400,000,000 | January 1, 2013 est. |
| 52 | Germany | 125,000,000,000 | January 1, 2013 est. |
| 53 | Romania | 105,500,000,000 | January 1, 2013 est. |
| 54 | Philippines | 98,540,000,000 | January 1, 2013 est. |
| 55 | Chile | 97,970,000,000 | January 1, 2013 est. |
| 56 | Bahrain | 92,030,000,000 | January 1, 2013 est. |
| 57 | Poland | 92,000,000,000 | January 1, 2013 est. |
| 58 | DR Congo | 90,610,000,000 | January 1, 2013 est. |
| 59 | Cuba | 70,790,000,000 | January 1, 2013 est. |
| 60 | Tunisia | 65,130,000,000 | January 1, 2013 est. |
| 61 | South Sudan | 63,710,000,000 | January 1, 2013 est. |
| 62 | Italy | 62,350,000,000 | January 1, 2013 est. |
| 63 | Namibia | 62,290,000,000 | January 1, 2013 est. |
| 64 | Rwanda | 56,630,000,000 | January 1, 2013 est. |
| 65 | Afghanistan | 49,550,000,000 | January 1, 2013 est. |
| 66 | Serbia | 48,140,000,000 | January 1, 2013 est. |
| 67 | Denmark | 42,980,000,000 | January 1, 2013 est. |
| 68 | Equatorial Guinea | 36,810,000,000 | January 1, 2013 est. |
| 69 | New Zealand | 29,420,000,000 | January 1, 2013 est. |
| 70 | Gabon | 28,320,000,000 | January 1, 2013 est. |
| 71 | Mauritania | 28,320,000,000 | January 1, 2013 est. |
| 72 | Cote d'Ivoire | 28,320,000,000 | January 1, 2013 est. |
| 73 | Ethiopia | 24,920,000,000 | January 1, 2013 est. |
| 74 | Croatia | 24,920,000,000 | January 1, 2013 est. |
| 75 | Ghana | 22,650,000,000 | January 1, 2013 est. |
| 76 | Sudan | 21,240,000,000 | January 1, 2013 est. |
| 77 | Japan | 20,900,000,000 | January 1, 2013 est. |
| 78 | South Africa | 16,000,000,000 | January 1, 2012 est. |
| 79 | Uganda | 14,160,000,000 | January 1, 2013 est. |
| 80 | Slovakia | 14,160,000,000 | January 1, 2013 est. |
| 81 | Austria | 10,820,000,000 | January 1, 2013 est. |
| 82 | France | 10,700,000,000 | January 1, 2013 est. |
| Table Continued | |||
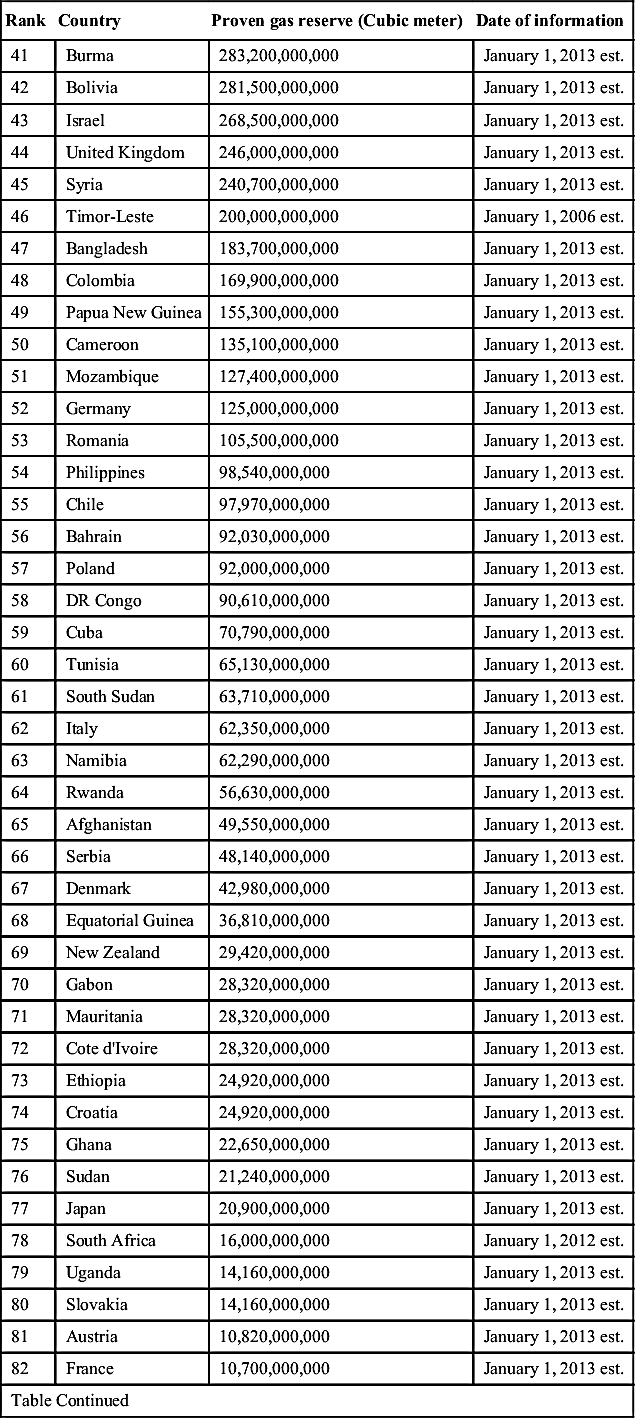
| Rank | Country | Proven gas reserve (Cubic meter) | Date of information |
| 83 | Ireland | 9,911,000,000 | January 1, 2013 est. |
| 84 | Georgia | 8,495,000,000 | January 1, 2013 est. |
| 85 | Hungary | 8,098,000,000 | January 1, 2013 est. |
| 86 | Ecuador | 6,994,000,000 | January 1, 2013 est. |
| 87 | Tanzania | 6,513,000,000 | January 1, 2013 est. |
| 88 | Taiwan | 6,229,000,000 | January 1, 2013 est. |
| 89 | Turkey | 6,173,000,000 | January 1, 2013 est. |
| 90 | Jordan | 6,031,000,000 | January 1, 2013 est. |
| 91 | Kyrgyzstan | 5,663,000,000 | January 1, 2013 est. |
| 92 | Tajikistan | 5,663,000,000 | January 1, 2013 est. |
| 93 | Bulgaria | 5,663,000,000 | January 1, 2013 est. |
| 94 | Somalia | 5,663,000,000 | January 1, 2013 est. |
| 95 | Korea, South | 5,269,000,000 | January 1, 2013 est. |
| 96 | Czech Republic | 3,964,000,000 | January 1, 2013 est. |
| 97 | Guatemala | 2,960,000,000 | January 1, 2006 est. |
| 98 | Belarus | 2,832,000,000 | January 1, 2013 est. |
| 99 | Spain | 2,548,000,000 | January 1, 2013 est. |
| 100 | Madagascar | 2,010,000,000 | January 1, 2012 est. |
| 101 | Morocco | 1,444,000,000 | January 1, 2013 est. |
| 102 | Benin | 1,133,000,000 | January 1, 2013 est. |
| 103 | DR Congo | 991,100,000 | January 1, 2013 est. |
| 104 | Greece | 991,100,000 | January 1, 2013 est. |
| 105 | Albania | 849,500,000 | January 1, 2013 est. |
| 106 | Barbados | 113,300,000 | January 1, 2013 est. |
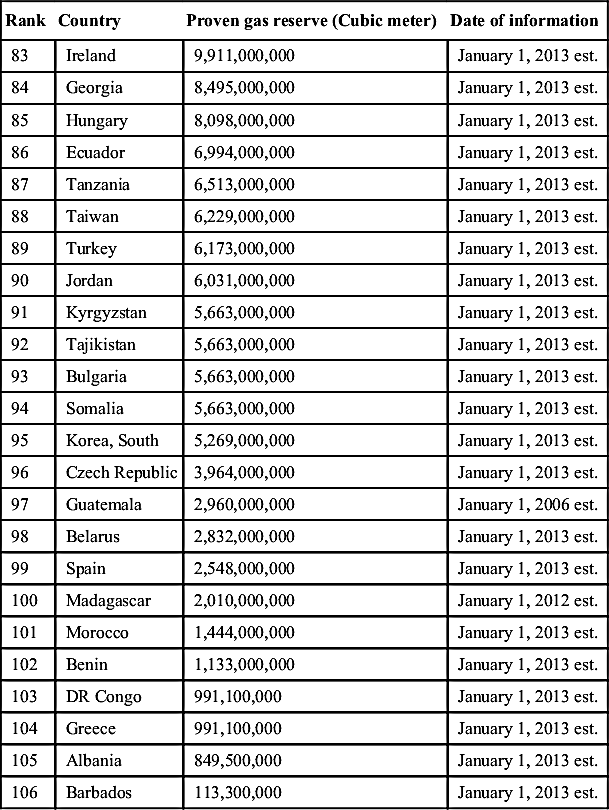
2.5. Unconventional Gas around the World
The notion that conventional gas and oil is miniscule compared to unconventional gas reserve is decades old. With it comes the notion that it is more challenging to produce unconventional petroleum resource. In addition, at least for petroleum oil the notion that unconventional resource is more challenging to process is prevalent. This notion is false. With the renewed awareness of the environmental sustainability it is becoming clear that unconventional resources offer more opportunities to produce environment-friendly products than conventional resources. Figure 2.23 shows the pyramid of both oil and gas resources.
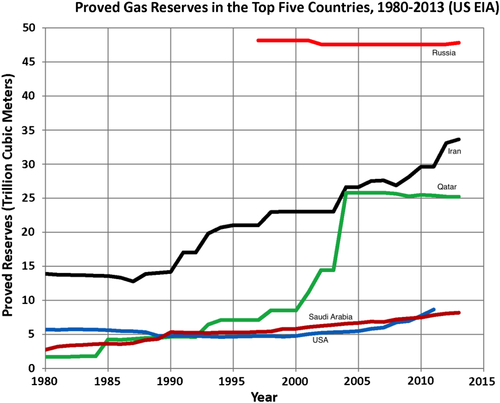
Figure 2.22 History of proven natural gas reserve for top five countries.
Table 2.6
World Proven Gas Reserve in Recent Decades as per BP
| Natural Gas: Proven reserves | At end 1992 | At end 2002 | At end 2011 | At end 2012 | |||
| Tcm | Tcm | Tcm | Tcf | Tcm | Share of total | R/P ratio | |
| United States | 4.7 | 5.3 | 8.8 | 300.0 | 8.5 | 4.5% | 12.5 |
| Canada | 2.7 | 1.7 | 2.0 | 70.0 | 2.0 | 1.1% | 12.7 |
| Mexico | 2.0 | 0.4 | 0.4 | 12.7 | 0.4 | 0.2% | 6.2 |
| Total North America | 9.3 | 7.4 | 11.2 | 382.7 | 10.8 | 5.8% | 12.1 |
| Argentina | 0.5 | 0.7 | 0.3 | 11.3 | 0.3 | 0.2% | 8.5 |
| Bolivia | 0.1 | 0.8 | 0.3 | 11.2 | 0.3 | 0.2% | 17.0 |
| Brazil | 0.1 | 0.2 | 0.5 | 16.0 | 0.5 | 0.2% | 26.0 |
| Colombia | 0.2 | 0.1 | 0.2 | 5.5 | 0.2 | 0.1% | 12.9 |
| Peru | 0.3 | 0.2 | 0.4 | 12.7 | 0.4 | 0.2% | 27.9 |
| Trinidad & Tobago | 0.2 | 0.6 | 0.4 | 13.3 | 0.4 | 0.2% | 8.9 |
| Venezuela | 3.7 | 4.2 | 5.5 | 196.4 | 5.6 | 3.0% | ∗ |
| Other South & Central America | 0.2 | 0.1 | 0.1 | 2.0 | 0.1 | ◆ | 15.5 |
| Total South & Central America | 5.4 | 7.0 | 7.5 | 268.3 | 7.6 | 4.1% | 42.8 |
| Azerbaijan | n/a | 0.9 | 0.9 | 31.5 | 0.9 | 0.5% | 57.1 |
| Denmark | 0.1 | 0.1 | 0.0 | 1.3 | 0.0 | ◆ | 5.9 |
| Germany | 0.2 | 0.2 | 0.1 | 2.0 | 0.1 | ◆ | 6.1 |
| Italy | 0.3 | 0.2 | 0.1 | 1.9 | 0.1 | ◆ | 7.0 |
| Kazakhstan | n/a | 1.3 | 1.3 | 45.7 | 1.3 | 0.7% | 65.6 |
| Netherlands | 1.7 | 1.4 | 1.0 | 36.7 | 1.0 | 0.6% | 16.3 |
| Norway | 1.4 | 2.1 | 2.1 | 73.8 | 2.1 | 1.1% | 18.2 |
| Poland | 0.2 | 0.1 | 0.1 | 4.2 | 0.1 | 0.1% | 28.3 |
| Romania | 0.5 | 0.3 | 0.1 | 3.6 | 0.1 | 0.1% | 9.3 |
| Table Continued | |||||||
| Natural Gas: Proven reserves | At end 1992 | At end 2002 | At end 2011 | At end 2012 | |||
| Tcm | Tcm | Tcm | Tcf | Tcm | Share of total | R/P ratio | |
| Russian Federation | n/a | 29.8 | 32.9 | 1162.5 | 32.9 | 17.6% | 55.6 |
| Turkmenistan | n/a | 2.3 | 17.5 | 618.1 | 17.5 | 9.3% | ∗ |
| Ukraine | n/a | 0.7 | 0.7 | 22.7 | 0.6 | 0.3% | 34.6 |
| United Kingdom | 0.6 | 1.0 | 0.2 | 8.7 | 0.2 | 0.1% | 6.0 |
| Uzbekistan | n/a | 1.2 | 1.1 | 39.7 | 1.1 | 0.6% | 19.7 |
| Other Europe & Eurasia | 34.7 | 0.4 | 0.3 | 10.1 | 0.3 | 0.2% | 29.2 |
| Total Europe & Eurasia | 39.6 | 42.1 | 58.4 | 2062.5 | 58.4 | 31.2% | 56.4 |
| Bahrain | 0.2 | 0.1 | 0.2 | 7.0 | 0.2 | 0.1% | 14.0 |
| Iran | 20.7 | 26.7 | 33.6 | 1187.3 | 33.6 | 18.0% | ∗ |
| Iraq | 3.1 | 3.2 | 3.6 | 126.7 | 3.6 | 1.9% | ∗ |
| Kuwait | 1.5 | 1.6 | 1.8 | 63.0 | 1.8 | 1.0% | ∗ |
| Oman | 0.2 | 0.9 | 0.9 | 33.5 | 0.9 | 0.5% | 32.8 |
| Qatar | 6.7 | 25.8 | 25.0 | 885.1 | 25.1 | 13.4% | ∗ |
| Saudi Arabia | 5.2 | 6.6 | 8.2 | 290.8 | 8.2 | 4.4% | 80.1 |
| Syria | 0.2 | 0.3 | 0.3 | 10.1 | 0.3 | 0.2% | 37.5 |
| United Arab Emirates | 5.8 | 6.1 | 6.1 | 215.1 | 6.1 | 3.3% | ∗ |
| Yemen | 0.4 | 0.5 | 0.5 | 16.9 | 0.5 | 0.3% | 63.1 |
| Other Middle East | 0.0 | 0.1 | 0.2 | 7.3 | 0.2 | 0.1% | 78.0 |
| Total Middle East | 44.0 | 71.8 | 80.4 | 2842.9 | 80.5 | 43.0% | ∗ |
| Algeria | 3.7 | 4.5 | 4.5 | 159.1 | 4.5 | 2.4% | 55.3 |
| Egypt | 0.4 | 1.7 | 2.2 | 72.0 | 2.0 | 1.1% | 33.5 |
| Libya | 1.3 | 1.5 | 1.5 | 54.6 | 1.5 | 0.8% | ∗ |
| Nigeria | 3.7 | 5.0 | 5.2 | 182.0 | 5.2 | 2.8% | ∗ |
| Other Africa | 0.8 | 1.1 | 1.3 | 44.3 | 1.3 | 0.7% | 68.1 |
| Total Africa | 9.9 | 13.8 | 14.7 | 512.0 | 14.5 | 7.7% | 67.1 |
| Table Continued | |||||||
| Natural Gas: Proven reserves | At end 1992 | At end 2002 | At end 2011 | At end 2012 | |||
| Tcm | Tcm | Tcm | Tcf | Tcm | Share of total | R/P ratio | |
| Australia | 1.0 | 2.5 | 3.8 | 132.8 | 3.8 | 2.0% | 76.6 |
| Bangladesh | 0.3 | 0.3 | 0.3 | 6.5 | 0.2 | 0.1% | 8.4 |
| Brunei | 0.4 | 0.3 | 0.3 | 10.2 | 0.3 | 0.2% | 22.9 |
| China | 1.4 | 1.3 | 3.1 | 109.3 | 3.1 | 1.7% | 28.9 |
| India | 0.7 | 0.8 | 1.3 | 47.0 | 1.3 | 0.7% | 33.1 |
| Indonesia | 1.8 | 2.6 | 3.0 | 103.3 | 2.9 | 1.6% | 41.2 |
| Malaysia | 1.7 | 2.5 | 1.2 | 46.8 | 1.3 | 0.7% | 20.3 |
| Myanmar | 0.3 | 0.4 | 0.2 | 7.8 | 0.2 | 0.1% | 17.4 |
| Pakistan | 0.6 | 0.8 | 0.7 | 22.7 | 0.6 | 0.3% | 15.5 |
| Papua New Guinea | 0.4 | 0.4 | 0.4 | 15.6 | 0.4 | 0.2% | ∗ |
| Thailand | 0.2 | 0.4 | 0.3 | 10.1 | 0.3 | 0.2% | 6.9 |
| Vietnam | 0.1 | 0.2 | 0.6 | 21.8 | 0.6 | 0.3% | 65.6 |
| Other Asia Pacific | 0.3 | 0.4 | 0.3 | 11.8 | 0.3 | 0.2% | 18.6 |
| Total Asia Pacific | 9.4 | 13.0 | 15.5 | 545.6 | 15.5 | 8.2% | 31.5 |
| Total World | 117.6 | 154.9 | 187.8 | 6614.1 | 187.3 | 100.0% | 55.7 |
R/P ratio, Reserve/production ratio.
On the oil side, the quality of oil is considered to be declining as the American Petroleum Institute gravity declines. This correlation is related to the processing required for crude oil to be ready for conversion into usable energy, which is related to heating value. Heating value is typically increased by refining crude oil upon addition of artificial chemicals that are principally responsible for global warming (Chhetri and Islam, 2008; Islam et al., 2010). In addition, the process is inefficient resulting harmful products to the environment. Figure 2.24 shows the trend in efficiency, environmental benefit, and real value with the production cost of refined crude. This figure shows clearly there is great advantage in using petroleum products in their natural state. This is the case for unconventional oil. For instance, shale oil burns naturally. The color of flames (left image of Picture2.2 ) indicates that crude oil produced from shale oil does not need further processing. The right image of Picture 2.2 emerges from burning gasoline and has similar colors to those of the left.
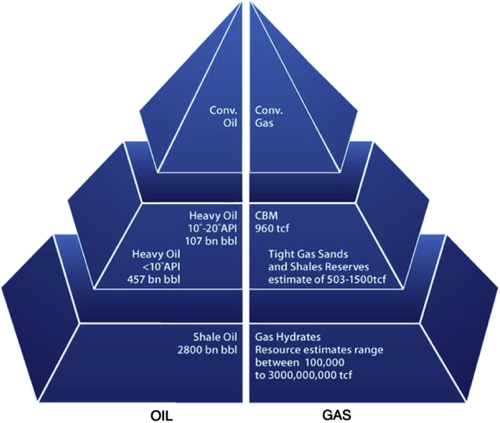
Figure 2.23 The volume of petroleum resources increases as one moves from conventional to unconventional.
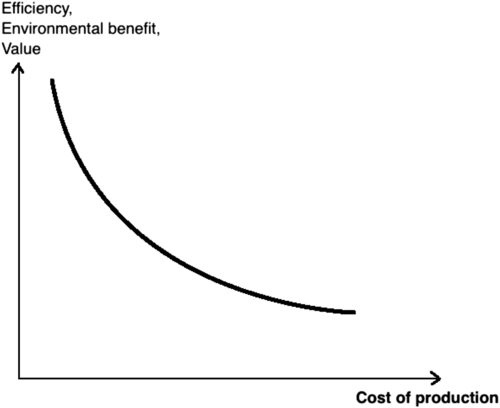
Figure 2.24 Cost of production increases as efficiency, environmental benefits, and real value of crude oil declines. Modified from Islam et al., 2010.
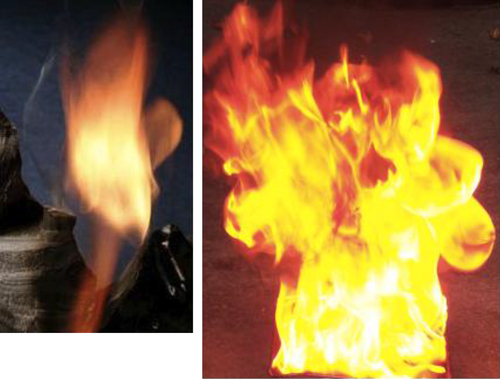
Picture 2.2 Images of burning crude oil from shale oil (left) and refined oil (right).
In addition, crude oil from shale oil is “cleaner” than other forms of crude oil because of the fact that it is relatively low in tar content as well as sand particles. Another crucial aspect is the fact that sulfur content or other toxic elements of crude oil have no correlation with unconventional or conventional sources. Also, heavier oils do not have more of these toxic elements and are not in need of refinement to be usable.
Lighter crudes are considered to be easier and less expensive to produce only because modern engineering uses refined version of the crude oil and all refining technologies are specially designed to handle light crude oil. If sustainable refining techniques are used, lighter or conventional oil offers no particular advantage over unconventional one and yet the volume and ease of production of unconventional are greater in unconventional resources.
For natural gas, the quality of gas actually improves with unconventional resources. For oil, the lighter the oil the more toxic it is considered. Whereas for gas, more readily available resources are less toxic. For instance, biogas is least toxic, whereas it is most plentiful. As can be seen in Figure 2.23, as one transits from conventional gas to CBM to tight gas and shale gas all the way to hydrates, one encounters more readily combustible natural resources. In fact, CBM burns so readily that coal mine safety primarily revolves around combustion of methane gas. Processing of gas does not involve making it more combustible, it rather involves the removal of components that do not add heating value or create safety concerns (e.g., water, CO2, H2S).
Figure 2.25 shows how the volume of resources goes up as one moves from conventional to unconventional resources. In this process the quality of gas also increases. For instance, hydrate has the purest form of methane and can be burnt directly with little or no safety concern. At the same time, the volume of natural gas in hydrate is very large. The concentration of “sour” gas components also decreases with abundance of the resources. Such trend can be explained by the processing time of a particular resource. There is a continuity in nature that dictates that the natural processing increases both the value and global efficiency of energy sources (Chhetri and Islam, 2008). Figure 2.26 depicts the nature of volume of natural resources as a function of processing time.
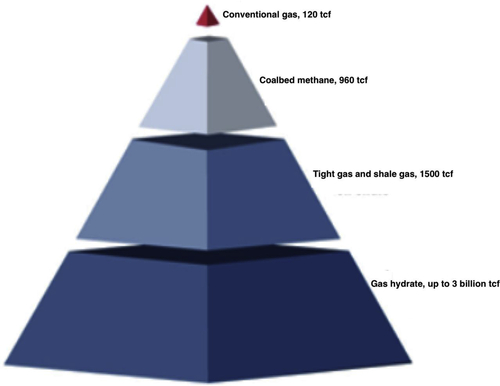
Figure 2.25 Current estimate of conventional and unconventional gas reserve.
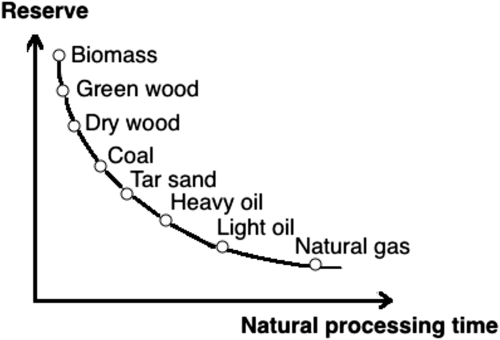
Figure 2.26 Abundance of natural resources as a function of time.
In this picture, “natural gas” relates to petroleum products in conventional sense. This figure shows natural gas, in general, is most suitable for clean energy generation. Within unconventional gas sources, there exists another correlation between reserve volume and processing time. In general, the processing time for various energy sources is not a well-understood science. Scientists are still grappling with the origin of earth or universe; some discovering only recently that water was and remains the matrix component for all matter (Pearson et al., 2014). Figure 2.27 shows how natural evolution on earth involved a distinctly different departure point not previously recognized. Pearson et al. (2014) observed a “rough diamond” found along a shallow riverbed in Brazil that unlocked the evidence that a vast “wet zone” deep inside the earth that could hold as much water as all the world's oceans put together. This discovery is important for two reasons. Water and carbon are both essential for living organisms. They also mark the beginning and end of a life cycle. All natural energy sources have carbon or require carbon to transform energy in usable form (e.g., photosynthesis).
With this information and uncertainty in the backdrop, let us discuss geologic age of unconventional resources. CBM resides within a “coal zone,” as discrete coal seams and/or packages with several thin and thick seams interbedded with noncoaly rock layers or beds. Coal zones are found in strata ranging in age from Late Jurassic (approximately 145 million years old) to Tertiary (approximately 65 million years old). Shale gas and tight gas can have older age depending on the age of the rock. At present, gas hydrates are known to enclose the freshest methane. Methane hydrates, icelike compounds in which methane is held in crystalline cages formed by water molecules, are widespread in areas of permafrost such as the Arctic and in sediments on the continental margins. However, gas hydrates are not confined to the surface of the earth. They can exist deep in the ocean and some can enclose much older methane. Either way, gas hydrates provide one with the cleanest gas that can be burnt readily.
Figure 2.27 Water plays a more significant role in material production than previously anticipated. (Modified from the Guardian, March 12, 2014).
2.5.1. Shale Gas Reserve
Figure 2.28 shows the locations of shale gas reserves around the world. This distribution has to be explained in terms of current status of exploration as well as interest in expanding unconventional resources. Only a few of these locations are also rich in conventional gas reserves. In addition, this ranking is different from the ranking in conventional natural gas reserves. Table 2.7 shows the ranking of top 10 countries in terms of shale gas reserve.
Even though, shale gas is distributed around the globe, North America dominates shale gas development and production. According to EIA estimate, the world has 7299 Tcf of technically recoverable shale gas resources, adding approximately 47% to the 15,500 Tcf of technically recoverable conventional gas resources. This number is much larger if one considers the fact that the technologies for shale gas production are evolving and several of the most promising techniques are not commercially applied to date. World energy outlook 2012 projects in their new policies scenario that Europe will produce 7.7 Tcf of gas in 2035 and import 16 Tcf (68% of demand), mainly from Russia, Africa, and the Middle East.
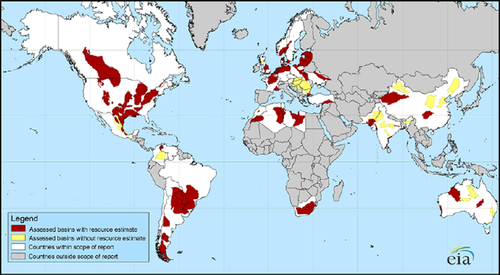
Figure 2.28 Locations of major shale gas reservoirs.
2.5.2. CBM Gas Reserve
CBM reserve estimates are not readily amenable to calculations. The difficulty arises from the fact that only a fraction of coal reserve is counted in estimating CBM reserves. Figure 2.29 shows how the CBM reserve estimates have fluctuated in the United States.
Table 2.7
Shale Gas Reserve for Top 10 Countries and Their Rankings in Terms of Conventional Gas Reserve
| Countries | Shale gas ranking | Conventional gas ranking | Shale gas reserve (Tcf) |
| China | 1 | 12 | 1115 |
| Argentina | 2 | 39 | 802 |
| Algeria | 3 | 10 | 707 |
| U.S.A. | 4 | 4 | 665 |
| Canada | 5 | 19 | 573 |
| Mexico | 6 | 32 | 545 |
| Australia | 7 | 25 | 437 |
| South Africa | 8 | 78 | 390 |
| Russia | 9 | 1 | 285 |
| Brazil | 10 | 34 | 245 |
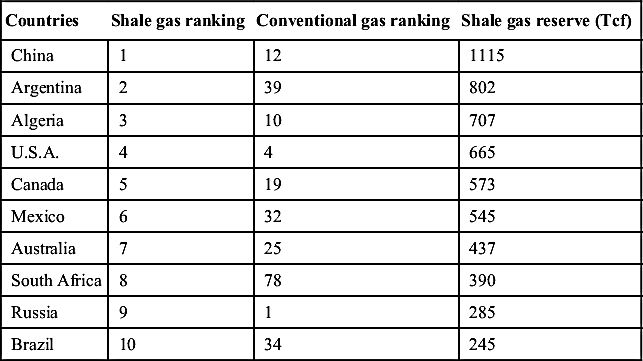
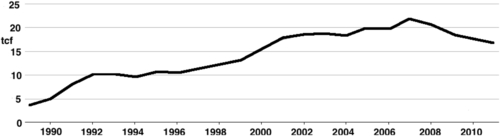
Figure 2.29 History of coalbed methane reserve in the United States. Data from EIA.
CBM is related to coal reserve. Coal remains a crucial contributor to energy supply in many countries. Coal is the most widespread fossil fuel around the world, and more than 75 countries have coal deposits. The current share of coal in global power generation is over 40% (WEO, 2013). These coal reserves are directly related to CBM. However, not all coal reserve owners develop their CBM reserve. Table 2.8 shows the coal reserve for countries with greatest reserve.
This reserve connects to following major distribution of CBM around the world (Table 2.9).
The above ranking shows that Canada and UK follow a different ranking than the ranking accorded by coal reserve. Such is the case because coal reserves in these countries have declined whereas CBM estimates have been accelerated. In fact, the search for and production of CBM follows a different trend. Figure 2.30 shows various spots that have active CBM projects or have dealt with CBM production.
Table 2.8
Coal Reserve in Countries with Most Reserve
| Country | Reserves (Mt) | Production (Mt) | 2011 R/P years | ||
| 2011 | 1993 | 2011 | 1993 | ||
| United States of America | 237,295 | 168,391 | 1092 | 858 | >100 |
| Russian Federation | 157,010 | 168,700 | 327 | 304 | >100 |
| China | 114,500 | 80,150 | 3384 | 1150 | 34 |
| Australia | 76,400 | 63,658 | 398 | 224 | >100 |
| India | 60,600 | 48,963 | 516 | 263 | >100 |
| Rest of World | 245,725 | 501,748 | 1805 | 1675 | >100 |
| Global total | 891,530 | 1,031,610 | 7520 | 4474 | >100 |
R/P = reserve/yearly production
From WEO, 2013.
2.5.3. Tight Gas Reserve
Tight gas reserves are usually linked to currently producible oil and gas reservoirs. The United States is the leader of tight gas production. Not surprisingly, the United States has developed extensive data base on tight gas reserve. Figure 2.31 shows history and projection of tight sand gas in the United States, along with other unconventional reserves.
The estimates of gas production, reserves, and potential from the tight gas basins in the United States are compatible with the concept of the resource triangle. Figure 2.32 illustrates the tight gas resource base estimates from the Gas Technology Institute (GTI). The gas produced throughout the year 2000 from tight gas reservoirs is estimated to be 58 Tcf. Proven reserves in tight gas reservoirs are 34 Tcf. Thus, the sum of produced gas plus proven reserves adds up to 92 Tcf. GTI estimates the volume of technically recoverable gas from known US tight gas accumulations at 185 Tcf. The term “technically recoverable” means that the gas is known to exist; the technology is available to drill, complete, stimulate, and produce this gas; but the gas cannot be booked as reserves until the wells are drilled and the reservoirs are developed. The next category in Figure 2.32 is called undiscovered, which represents the GTI estimate of gas that is likely to be discovered in known tight gas basins. Finally, the largest category is called resources. This value represents the gas in place in the US tight gas basins. Substantial improvements in technology or changes in the gas market are required before the gas in the resources category can be produced economically.
Figure 2.30 Coalbed methane distribution around the world (red spots show past or present activities). For interpretation of the references to color in this figure legend, the reader is referred to the online version of this book.
Figure 2.31 Recovery and projection of various unconventional gas resources. (Redrawn from BP, 2013).
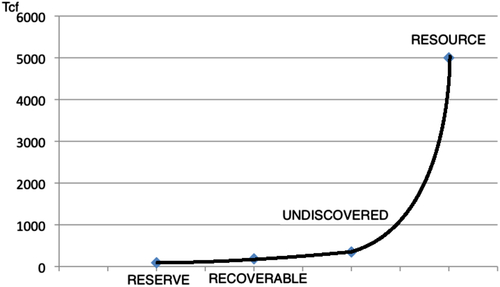
Figure 2.32 Resource triangle for tight gas in the United States.
Figure 2.32 highlights the need for improving technologies in order to access much larger reserve. It is to be noted, almost all large conventional oil reservoirs will have tight gas or oil attached to them. However, they are not counted for political and economical reasons. Figure 2.33 shows how unconventional resources will make an impact on some countries whereas others, such as Saudi Arabia, would remain unaffected. For the United States, China, and Canada, unconventional gas production will become more prominent than conventional production, whereas countries, such as Iran, Qatar, Algeria, Saudi Arabia and Turkmenistan will have no recovery from unconventional resources (Figure 2.34).
In United States, it is expected that shale gas production, will grow by 113% from 2011 to 2040. Tight gas, on the other hand, is expected to grow by 24% (Figure 2.35). Such prediction is pessimistic and does not consider the full potential of tight gas.
2.5.4. Gas Hydrate
It is well known that gas hydrates as a source of natural gas have tremendous potentials. It is so vast that the estimates of global reserves are only sketchy, but range from 2800 trillion to 8 billion trillion m3 of natural gas. This is several times higher than global reserves of 440 Tcm of conventional gas. While gas hydrate burns readily (Picture 2.3), exploitation of hydrate reserve is considered to be a difficult task.
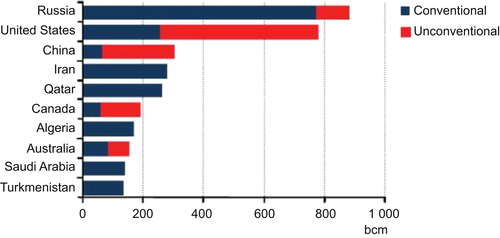
Figure 2.33 Projection of gas production in 2035. From IEA Energy outlook, 2011.
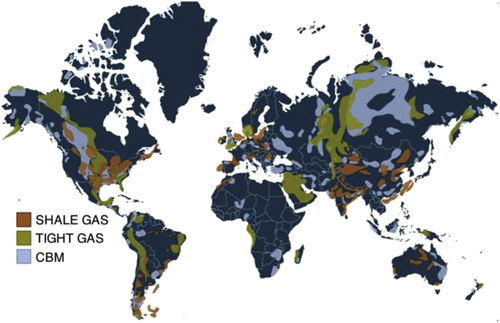
Figure 2.34 Distribution of various unconventional gas reserves around the world.
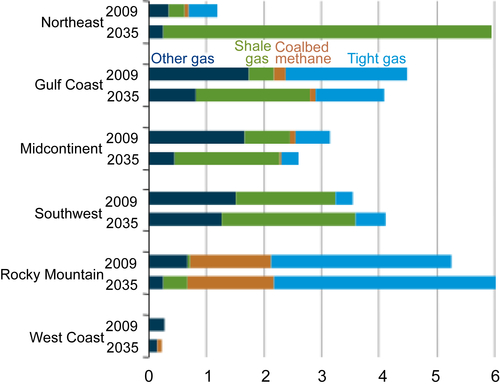
Figure 2.35 Past and future production of gas from unconventional resources. From EIA, 2013.
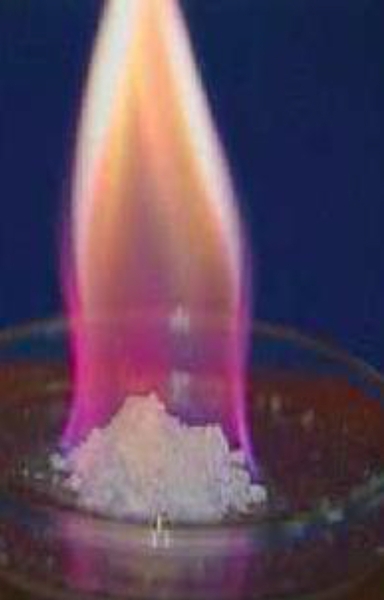
Picture 2.3 Hydrate burns readily without any safety or environmental hazard.
EIA global estimates place the gas volume resident in oceanic natural gas hydrate deposits in the range of 30,000 to 49,100,000 Tcf, and in continental natural gas hydrate deposits in the range of 5000 to 12,000,000 Tcf. Comparatively, current worldwide natural gas resources are about 13,000 Tcf and natural gas reserves are about 5000 Tcf. The current mean (expected value) estimate of domestic natural gas hydrates in place is 320,222 Tcf. In comparison, as of 1997 the mean estimate of all untapped technically recoverable US natural gas resources was 1301 Tcf, US proven natural gas reserves were 167 Tcf, and annual US natural gas consumption was about 22 Tcf.
Large volumes of natural gas hydrates are known to exist in both onshore and offshore Alaska, offshore the States of Washington, Oregon, California, New Jersey, North Carolina, and South Carolina, and in the deep Gulf of Mexico. Most of the volume is expected to be in Federal jurisdiction offshore waters, although 519 Tcf of hydrated gas in place was assessed for onshore Alaska—more than three times the 1997 level of US proven natural gas reserves. The USGS assessment indicates that the North Slope of Alaska may host about 85 Tcf of undiscovered technically recoverable gas hydrate resources (Figure 2.36). According to the report, technically recoverable gas hydrate resources could range from a low of 25 Tcf to as much as 158 Tcf on the North Slope. Total US consumption of natural gas in 2007 was slightly more than 23 Tcf. Of the mean estimate of 85 Tcf of technically recoverable gas hydrates on the North Slope, 56% is located on federally managed lands, 39% on lands and offshore waters managed by the state of Alaska, and the remainder on Native lands. The total area comprised by the USGS assessment is 55,894 square miles, and extends from the National Petroleum Reserve in the west to the Arctic National Wildlife Refuge in the east (Figure 2.36). The area extends north from the Brooks Range to the state–federal offshore boundary three miles north of the Alaska coastline. Gas hydrates might also be found outside the assessment area.
Global estimates by the committee for gas estimates reported methane in gas hydrate deposits to be in the range of 3.1 × 10¹⁵ to 7600 × 1015 m3 for oceanic sediments and from 0.014 × 10¹⁵ to 34 × 1015 m3 for polar regions (Figure 2.37) (Max, 2003). Boswell and Collett (2011) puts this reserve to a volume of 1–120 × 1015 m3 of methane trapped within global reserve. In near future, hydrates can alter the energy demography for the world. Such efforts are in progress in India (Sain, 2012), Japan (Pfeifer, 2014), and others. This has the potential of creating another energy revolution the likes of which did not occur in last 100+ years. Following is an estimate of currently known hydrate reserve for some of the leading countries.
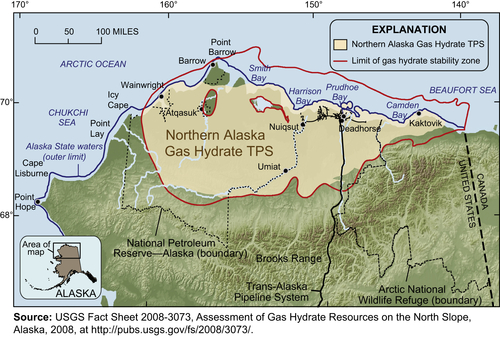
Figure 2.36 Gas hydrate deposits of Alaska.
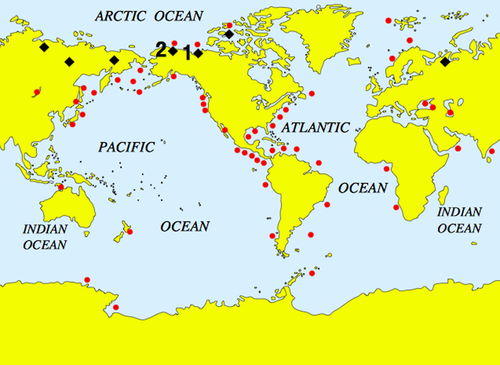
Figure 2.37 Known and inferred natural gas hydrate occurrences in marine (red circles) and permafrost (black diamonds) environments. (Figure from USGS http://pubs.usgs.gov/fs/fs021-01/fs021-01.pdf).
USA-318,000 Tcf
Alaska North Slope-590 Tcf
Japan-1765 Tcf
India-4307 Tcf
Canada-1550–28,600 Tcf
2.6. Summary and Conclusions
A scientific approach to looking at natural gas resources of the world reveals that future of energy lies within exploiting unconventional gas. Unlike what has been promoted in recent decades, unconventional gas is more likely to generate truly “clean” energy. Thankfully this fact is being recognized by future players. Figure 2.38 shows how there will be major shift in terms of usage of unconventional gas. This trend will shape the future of energy.
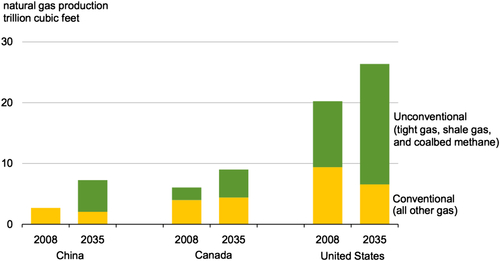
Figure 2.38 Future trends in some of the major future user of unconventional gas. From EIA report, 2013.
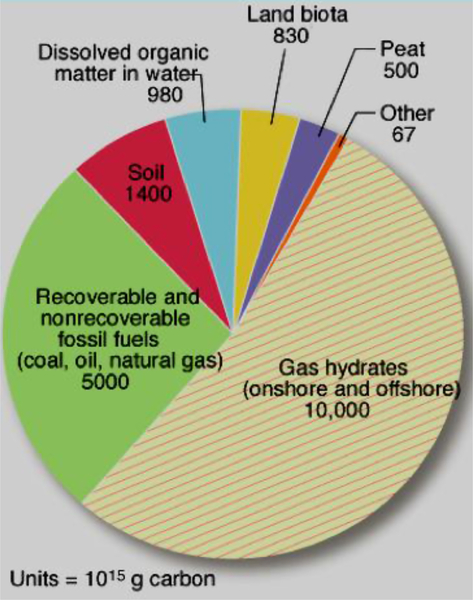
Figure 2.39 Gas hydrates that are the largest global sink for organic carbon offer the greatest prospect for the future of energy.
In even longer term future, gas hydrates offer the greatest promise of meeting energy needs. Gas hydrates are the most abundant of unconventional gas resources and they are the largest global sink for organic carbon (Figure 2.39).
At present, over 30 countries are actively involved at least in exploration of unconventional gas. For even the most active countries, this assessment of unconventional reserve is at its nascent state. For instance, for shale gas, Table 2.10 shows how different continents have addressed very limited percentage of the total possible gas in place. These numbers are lower for CBM, and much lower for gas hydrates.
..................Content has been hidden....................
You can't read the all page of ebook, please click here login for view all page.