
Tables are ideal for presenting information in a row-and-column format. You create Wikipedia tables using wiki markup, which begins with “{|” and ends with “|}”. Since you’ll edit tables much more often than create them, this section begins with editing. (To see how to create a wikicode table, flip to Creating Tables.)
Even if you never create a table from scratch, you still need to understand the basic structure to edit a table. Figure 14-13 shows the wikicode underlying a simple table.
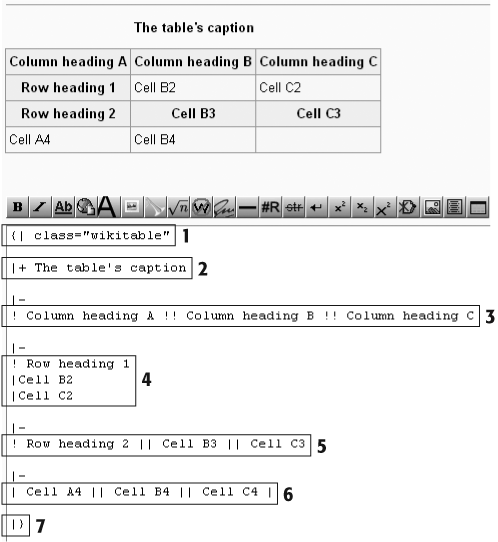
Figure 14-13. Here’s a table (top) and its underlying wikicode (bottom). The wikicode is split into seven chunks by six blank lines, for ease of understanding. You don’t usually find blank lines in the wikicode between rows of a table, as is the case here. (These blank lines make no difference in what the reader sees.)
Here are the elements of the wikicode that makes up a table:
1. A table always begins with “{|”. In this case, an optional parameter, class="wikitable”, has been added. That parameter tells the software to do standard table formatting, such as shading the top row.
2. This line adds an optional caption (starting with “|+”).
3 through 6. Each row of a table, including column headings (if any) consists of two or more lines, with the first line essentially saying, “A new row starts here!”
3, 4, 5 and 6 illustrate four different ways that cells in a table can look in wikitext. Each cell must be separated from the previous cell in its row by either inserting two vertical lines between the cells, if the cells are placed on the same line, or putting the second cell on a new line, with one vertical line (“|”) at the beginning.
In 3, 4, and 5, one or more of the “|” symbols have been replaced by the “!” symbol, which tells Wikipedia to format that cell as a heading. Exactly how that heading appears to the viewer depends on the viewer’s browser.
Comparing 4 to 5, the reason that cells B3 and B4 are bolded (treated like headings) is because they’re on the same line as row heading 2, which has an “!” in front of it. Row 4 is correct; row 5 is wrong.
7. A table must end with “|}” on its own line
When editing a table, you generally want to do one of three things: Change the content of an existing cell, add a row, or delete a row. The first is fairly straightforward: In editing mode, find where the cell starts, and add or change text. Adding a row isn’t difficult either: In editing mode, find the row above or below where you want to add a row; copy that row and paste it into the table. Now you have two identical rows; edit one of them with the information you’re adding. (Deleting a row is even easier than adding one; just select the lines that make up that row, and delete away.)
Note
Figure 14-13 makes it clear where a row starts and ends, but in real life you don’t see the blank lines that clearly separate one row from another. The first line of a row has “|-” at the beginning; the row is always two or more lines long; and a row continues until you see another line that starts “|-”, indicating that the next row’s starting.
To test your understanding of editing tables, see if you can answer the following question: In Figure 14-13, look at the last three rows in the table. How many lines of wikicode are there for each of these three rows? (Do count the first line of each row, the line that begins “|-”; don’t count any of the six blank lines inserted in the wikicode to make it easier to read.) The answer: 4 lines, 2 lines, and 2 lines, respectively. If you got that, then you’re ready to copy, insert, and even delete rows from any table you find.
In your career as a Wikipedia editor, you’ll make lists, as described at the beginning of this chapter, much more often then tables. First off, lists are much easier to create—for most, you just type an asterisk before each list item. Tables involve much more complex wikicode.
You probably don’t want to create a table unless your information needs three or more columns. If there’s only one column, you can simply display the information in a list, which is much easier to edit than a table. If there are two columns, it’s still better to present information as a list (either annotated or indented, as discussed on ???) unless it would be useful to sort the information by the second column. (Tables can be sorted, lists can’t.) For a fuller discussion of when to create a table instead of list, check out the guideline Wikipedia:When to use tables (shortcut: WP:TABLE), which is part of Wikipedia’s Manual of Style. If you’re still sure you want to create a table, read on.
Note
If you know HTML, you may be tempted to create tables using the <table> tag. But don’t. Although the <table> tag still works (it used to be the only way to create tables in Wikipedia), wikicode tables are more flexible, sortable, and easier to edit.
For the most basic table, you can use the edit toolbar’s table icon to generate some starter wikicode (Figure 14-14). Then you can expand it and add your information.
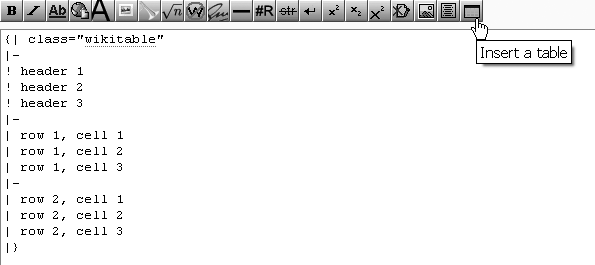
Figure 14-14. On the edit toolbar, if you click the “table” icon, in editing mode, the software generates a basic table for you. It may not be much, but it’s a start if you’re creating a table from scratch.
You can also use a table to format a multicolumn list. To do so, use the simplified wikicode shown in Figure 14-15.
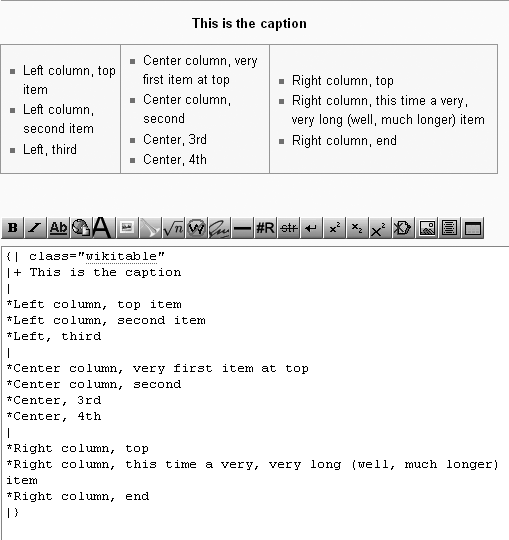
Figure 14-15. This table arranges a list of information into three columns. In some sense, this isn’t a true table because it doesn’t have rows (or, to be exact, it’s formatted as if it had only one row), and the information in one column doesn’t necessarily line up with information in the other columns. (Notice that the center column has four entries, versus three entries for the left and right columns.) Still, it can be useful for getting a long list to fit into much less space.
If neither of the previous two examples meets your needs, you need to create a table from scratch. Here’s a quick three-step plan for creating a table:
Read the page Help:Table; which has lots of detailed information and examples.
Read the tutorial User:Smurrayinchester/Tutorial/Tables and slightly more advanced User:Dcljr/Tables.
Find a table in an existing article that’s pretty close to what you want, and copy it. Then you only have to tinker with the formatting, add or subtract rows, and edit the contents of the cells in the table, replacing them with whatever you want in your table.
You can make tables more usable to everyone, not just normally sighted people with high resolution monitors, by doing several things:
Don’t set fixed column widths, unless you’re trying to slim down a column where only a few cells have lengthy text. Setting a lot of fixed width columns, even if the total is less than 800 pixels, can cause problems for users with narrow viewports (mobile devices) or those using large text sizes. If you need to, specify a percentage to allow a degree of flexibility. Even then, you may still be better off simply trusting the software to deliver an acceptably viewable table.
Put a summary in the top line of the table. The format is simple: summary=“...” (you don’t need a comma, or any other separator, before or after). A summary (which isn’t displayed visually) provides a description of the table’s purpose and structure for non-visual browsers, which read the page aloud. For example, a summary might say, “The table is organized with the oldest model of the automobile first, and the latest model last.”
Use exclamation points (“!”) for row and column headings, as shown in Figure 14-13, Figure 14-14, and Figure 14-15, rather than specifying specific formatting for headings (bold, larger font size, or whatever). When you let the software do the work, it can adjust for different browsers and screen sizes and resolution. Also, omitting your own personalized formatting for headings simplifies the table.
When voice browsers read a table aloud, they repeat the appropriate column headings when reading a cell. If they can’t figure out the column heading, they just read cell information without the context of a column heading.
Add an abbreviation for voice browsers if column headings are more than a word or so. For example, if a column heading is Number of edits, change that to abbr=“Edits” | Number of edits. The heading stills visually displays “Number of edits”, but the voice browser just says, “Edits.”
Don’t code information into the table using only colors or colored symbols. For example, in a table about U.S. politicians, if you color rows about Republicans in one way, and Democrat rows in another way, you should also include text in the rows that specifies party affiliation. Similarly, in a table about subway stations, it’s okay to indicate the subway lines that stop at a station by using colored boxes, but you also need to put text in those boxes.
Coloring and bolding are good things, not problems, since they provide immediate visual cues. But make the same information available in text form as well, at least subtly: “(R)” for Republican, “(D)” for Democratic, for example, or by putting a “B” or a “BL” inside the blue box that indicates that the Blue Line stops at that station.
Being able to sort a table—especially a long table—makes it much more valuable to readers. For example, some people may want to look at a list of U.S. presidents in chronological order; others want to see it alphabetically. Whenever you create or edit a table, consider whether you can make it sortable.
Sortable tables have arrows in the cells of the top row that you can click to sort by that column, as shown in Figure 14-10 (???). The code to make a table sortable is straightforward: Instead of class=“wikitable”, in the first line of the table, use class=“wikitable sortable”.
Note
If you’ve never seen a sortable table in Wikipedia, go to Help:Sorting and check some of the examples there. If you can’t get any tables there to sort themselves, then you don’t have JavaScript turned on in your browser. (See Setting Up Your Browser for how to do so.)
In a sortable table, when you click an arrow, the table sorts itself based on the selected column, in ascending order. The arrow’s a toggle switch: If you click it again, the table sorts itself in descending order rather than ascending order.
Note
Just because a table is sortable is no reason for you to just add new rows at the bottom of the table. Some readers won’t understand the table is sortable, and folks viewing via a mobile device, or via a screen reader, or on a printed page, won’t be able to. Sorting should always be an option for a reader who wants to see a table in a different way, not a requirement to see it in the correct sequence.
If you create a sortable table or change one to be sortable, you need to understand the software’s logic when sorting. First, the software decides which of four types of data is in that column: dates, currency, numbers, or text (what Wikipedia calls strings). Looking down the column, the software finds the first non-blank cell and assumes that everything else in the column is in the same format. But a number of things can go wrong:
Mixed types of data in a column don’t sort right. For example, in a column that’s for calendar dates, don’t put “Unknown” where a date isn’t known. Just leave the cell blank.
Numbers aren’t displayed correctly. The sorting algorithm isn’t thrown off by commas or decimal places, but it doesn’t insert missing commas, or align a column of numbers on the decimal point (rather, columns are aligned left or right, or centered). So make sure to format numbers consistently. Don’t put commas in some figures and leave them out of others. Similarly, when you have figures with decimal places, try to have the same number of digits to the right of the decimal point.
Dates aren’t formatted correctly. The correct format for Wikipedia purposes is “14 June 2007”, not “June 14, 2007”. If you use the latter, the software thinks you’re using text, and alphabetizes the column.
Tip
Avoid using a format like “05-01-2007”; in some countries that date would be May 1, 2007, in others it would be January 5, 2007.