
Dense Medium Separation (DMS)
Dense medium separation is also known as heavy medium separation or the sink-and-float process. It has two principal applications: the preconcentration of minerals, that is, the rejection of gangue prior to grinding for final liberation, and in coal preparation to produce a commercially graded end-product, that is, clean coal being separated from the heavier shale or high-ash coal. The history of the process, innovations, and failures are reviewed by Napier-Munn et al..
Keywords
Dense medium types; gravitational separators; centrifugal separators; DMS circuits; heavy liquid tests; partition curves
11.1 Introduction
Dense medium separation (DMS) is also known as heavy medium separation (HMS) or the sink-and-float process. It has two principal applications: the preconcentration of minerals, that is, the rejection of gangue prior to grinding for final liberation, and in coal preparation to produce a commercially graded end-product, that is, clean coal being separated from the heavier shale or high-ash coal. The history of the process, innovations, and failures are reviewed by Napier-Munn et al. (2014).
In principle, it is the simplest of all gravity processes and has long been a standard laboratory method for separating minerals of different specific gravity. Heavy liquids of suitable density are used, so that those minerals less dense (“lighter”) than the liquid float, while those denser (“heavier”) than it sink (Figure 11.1). Rather than quoting a density value, it is common to refer to specific gravity (s.g.), “relative density” (RD), or simply “density.”

Since most of heavy liquids are expensive or toxic, the dense medium used in industrial separations is a suspension of particles of some dense solid in water, which behaves as a heavy liquid.
The process offers some advantages over other gravity processes. It has the ability to make sharp separations at any required density, with a high degree of efficiency, even in the presence of high percentages of near-density material (or near-gravity material, i.e., material close to the desired density of separation). The density of separation can be closely controlled, within a RD of ±0.005, and can be maintained under normal conditions for indefinite periods. The separating density can be changed as required and fairly quickly, to meet varying requirements. The process is, however, rather expensive, mainly due to the ancillary equipment needed to clean and recycle the medium, and the cost of the medium itself.
For preconcentration, DMS is applicable to any ore in which, after a suitable degree of liberation by comminution, there is enough difference in specific gravity between the particles to separate those which will repay the cost of further treatment from those which will not. The process is most widely applied when the density difference occurs at a coarse particle size, for example, after crushing, as separation efficiency decreases with size due to the slower rate of settling of the particles. Particles should preferably be larger than about 4 mm in diameter, in which case separation can be effective on a difference in specific gravity of 0.1 or less. If the values are finely disseminated throughout the host rock, then a suitable density difference between the crushed particles cannot be developed by coarse crushing.
Providing that a density difference exists, there is no upper size limit except that determined by the ability of the plant to handle the material. Separation down to 500 µm, and less, can be facilitated by the use of centrifugal separators.
Preconcentration is most often performed on metalliferous ores that are associated with relatively light country rock, such as silicates and carbonates. Lead–zinc (galena–sphalerite) ores can be candidates, examples being the operations at Mount Isa (Queensland, Australia) and the Sullivan concentrator (British Columbia, Canada (now closed)). In some of the Cornish tin ores, the cassiterite is found in lodes with some degree of banded structure in which it is associated with other high-specific-gravity minerals such as the sulfides of iron, arsenic, and copper, as well as iron oxides. The lode fragments containing these minerals therefore have a greater density than the siliceous waste and allow early separation.
11.2 The Dense Medium
11.2.1 Liquids
Heavy liquids have wide use in the laboratory for the appraisal of gravity-separation techniques on ores. Heavy liquid testing may be performed to determine the feasibility of DMS on a particular ore and to determine the economic separating density, or it may be used to assess the efficiency of an existing dense medium circuit by carrying out tests on the sink and float products. The aim is to separate the ore samples into a series of fractions according to density, establishing the relationship between the high- and the low-specific-gravity minerals (see Section 11.6).
Tetrabromoethane, having a specific gravity of 2.96, is commonly used and may be diluted with white spirit or carbon tetrachloride (s.g. 1.58) to give a range of densities below 2.96.
Bromoform (s.g. 2.89) may be mixed with carbon tetrachloride to give densities in the range 1.58–2.89. For densities up to 3.3, diiodomethane is useful, diluted as required with triethyl orthophosphate. Aqueous solutions of sodium polytungstate have certain advantages over organic liquids, such as being virtually nonvolatile, nontoxic, and of lower viscosity, and densities of up to 3.1 can easily be achieved (Plewinsky and Kamps, 1984).
For higher density separations, Clerici solution (thallium formate–thallium malonate solution) allows separation at densities up to specific gravity 4.2 at 20°C or 5.0 at 90°C. Separations of up to specific gravity 18 can be achieved by the use of magneto-hydrostatics, that is, the utilization of the supplementary weighting force produced in a solution of a paramagnetic salt or ferrofluid when situated in a magnetic field gradient. This type of separation is applicable primarily to nonmagnetic minerals with a lower limiting particle size of about 50 µm (Parsonage, 1980; Domenico et al., 1994). Lin et al. (1995) describe a modification to the Franz Isodynamic Separator (Chapter 13) for use with magnetic fluids.
Many heavy liquids give off toxic fumes and must be used with adequate ventilation: the Clerici liquids are extremely poisonous and must be handled with extreme care. The use of liquids on a commercial scale has therefore not been found practicable. Magnetic fluids avoid the toxicity but attempts to use industrially also face problems of practicality, such as cleaning and recycling the expensive fluids.
For fractionating low-density materials, notably coals, solutions of salts such as calcium chloride and zinc sulfate can be used where density is controlled by concentration. Commercial application has been attempted but the problems encountered reclaiming the salts for recycle have proven difficult to surmount.
11.2.2 Suspensions
Below a concentration of about 15% by volume, finely ground suspensions in water behave essentially as simple Newtonian fluids. Above this concentration, however, the suspension becomes non-Newtonian and a certain minimum stress, or yield stress, has to be applied before shear will occur and the movement of a particle can commence. Thus, small particles, or those close to the medium density, are unable to overcome the resistance offered by the medium before movement can be achieved. This can be solved to some extent either by increasing the shearing forces on the particles or by decreasing the apparent viscosity of the suspension. The shearing force may be increased by substituting centrifugal force for gravity. The viscous effect may be decreased by agitating the medium, which causes elements of liquid to be sheared relative to each other. In practice, the medium is never static, as motion is imparted to it by paddles, air, etc., and also by the sinking material itself. All these factors, by reducing the yield stress, tend to bring the parting or separating density as close as possible to the density of the medium in the bath.
In order to produce a stable suspension of sufficiently high density, with a reasonably low viscosity, it is necessary to use fine, high-specific-gravity solid particles, agitation being necessary to maintain the suspension and to lower the apparent viscosity. The solids comprising the medium must be hard, with no tendency to slime, as degradation increases the apparent viscosity by increasing the surface area of the medium. The medium must be easily removed from the mineral surfaces by washing and must be easily recoverable from the fine-ore particles washed from the surfaces. It must not be affected by the constituents of the ore and must resist chemical attack, such as corrosion.
For ore preconcentration, galena was initially used as the medium and, when pure, it can give a bath specific gravity of about 4. Above this level, ore separation is slowed down by the viscous resistance. Froth flotation, which is an expensive process, was used to clean the contaminated medium, but the main disadvantage is that galena is fairly soft and tends to slime easily, and it also has a tendency to oxidize, which impairs the flotation efficiency.
The most widely used medium for metalliferous ores is now ferrosilicon, while magnetite is used in coal preparation. Recovery of medium in both cases is by magnetic separation.
Ferrosilicon (s.g. 6.7–6.9) is an alloy of iron and silicon which should contain not less than 82% Fe and 15–16% Si (Collins et al., 1974). If the silicon content is less than 15%, the alloy will tend to corrode, while if it is more than 16% the magnetic susceptibility and density will be greatly reduced. Losses of ferrosilicon from a dense medium circuit vary widely, from as little as 0.1 to more than 2.5 kg t−1 of ore treated, the losses, apart from spillages, mainly occurring in magnetic separation and by the adhesion of medium to ore particles. Corrosion usually accounts for relatively small losses and can be effectively prevented by maintaining the ferrosilicon in its passive state. This is normally achieved by atmospheric oxygen diffusing into the medium or by the addition of small quantities of sodium nitrite (Stewart and Guerney, 1998).
Milled ferrosilicon is produced in a range of size distributions, from 30% to 95%-45 µm, the finer grades being used for finer ores and centrifugal separators. The coarser, lower viscosity grades can achieve medium densities up to about 3.3. Atomized ferrosilicon consists of rounded particles, which produce media of lower viscosity and can be used to achieve densities up to 3.8 (Napier-Munn et al., 2014).
Magnetite (s.g. ca. 5) is used in coal washing as separation densities are not as high as needed for metalliferous ores. Medium densities are up to 2.3 but work on spheroidized magnetite aims to reach bath densities up to 2.8 (Napier-Munn et al., 2014).
11.3 Separating Vessels
Several types of separating vessel are in use, and these may be classified into gravitational (“static-baths”) and centrifugal (“dynamic”) vessels. There is an extensive literature on the performance of these processes, and mathematical models are being developed, which can be used for circuit design and simulation purposes (King, 2012).
11.3.1 Gravitational Vessels
Gravitational units comprise some form of vessel into which the feed and medium are introduced and the floats are removed by paddles or merely by overflow. Removal of the sinks is the most difficult part of separator design. The aim is to discharge the sinks particles without removing sufficient of the medium to cause disturbing downward currents in the vessel. They are largely restricted to treat feeds coarser than ca. 5 mm in diameter. There are a wide range of gravitational devices (Leonard, 1991; Davis, 1992) and just a selection is described here.
Wemco Cone Separator (Figure 11.2)
This unit is widely used for ore treatment, having a relatively high sinks capacity. The cone, which has a diameter of up to 6 m, accommodates feed particles of up to 10 cm in diameter, with capacities up to 500 t h−1.

The feed is introduced on to the surface of the medium by free-fall, which allows it to plunge several centimeters into the medium. Gentle agitation by rakes mounted on the central shaft (stirring mechanism) helps keep the medium in suspension. The float fraction simply overflows a weir, while the sinks are removed by pump (Figure 11.2(a)) or by external or internal air lift (Figure 11.2(b)).
Drum Separators (Figure 11.3)
These are built in several sizes, up to 4.3 m diameter by 6 m long, with capacities of up to 450 t h−1 and treating feed particles of up to 30 cm in diameter. Separation is accomplished by the continuous removal of the sink product through the action of lifters fixed to the inside of the rotating drum. The lifters empty into the sinks launder when they pass the horizontal position. The float product overflows a weir at the opposite end of the drum from the feed chute. Longitudinal partitions separate the float surface from the sink-discharge action of the revolving lifters.
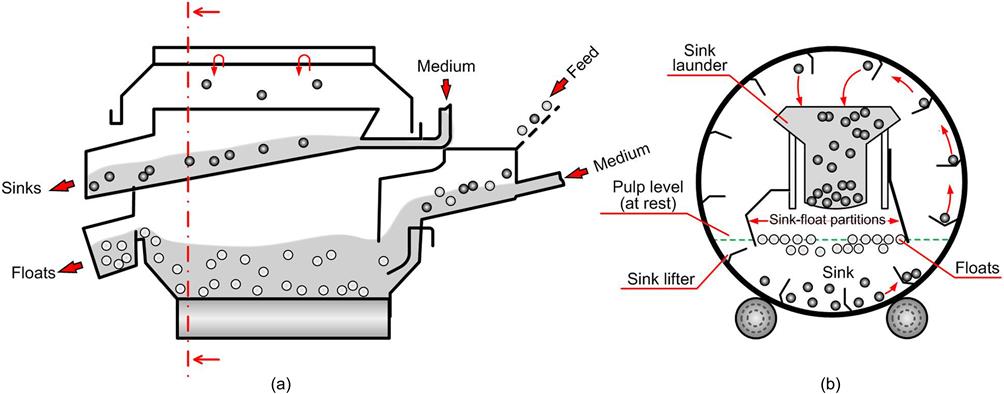
The comparatively shallow pool depth in the drum compared with the cone separator minimizes settling out of the medium particles, giving a uniform gravity throughout the drum.
Where single-stage dense-medium treatment is unable to produce the desired recovery, two-stage separation can be achieved in the two-compartment drum separator (Figure 11.4), which is, in effect, two drum separators mounted integrally and rotating together, one feeding the other. The lighter medium in the first compartment separates a true float product. The sink product is lifted and conveyed into the second compartment, where the middlings and the true sinks are separated.

Although drum separators have large sinks capacities and are inherently more suited to the treatment of metallic ores, where the sinks product is normally 60–80% of the feed, they are common in coal processing, where the sinks product is only 5–20% of the feed, because of their simplicity, reliability, and relatively small maintenance needs. A mathematical model of the DM drum has been developed by Baguley and Napier-Munn (1996).
Drewboy Bath
Once widely employed in the UK coal industry because of its high floats capacity, it is still in use (Cebeci and Ulusoy, 2013). The raw coal is fed into the separator at one end, and the floats are discharged from the opposite end by a star-wheel with suspended rubber, or chain straps, while the sinks are lifted out from the bottom of the bath by a radial-vaned wheel mounted on an inclined shaft. The medium is fed into the bath at two points—at the bottom of the vessel and with the raw coal—the proportion being controlled by valves.
Norwalt Washer
Developed in South Africa, most installations are still to be found in that country. Raw coal is introduced into the center of the annular separating vessel, which is provided with stirring arms. The floats are carried round by the stirrers and are discharged over a weir on the other side of the vessel, being carried out of the vessel by the medium flow. The heavies sink to the bottom of the vessel and are moved along by scrapers attached to the bottom of the stirring arms and are discharged via a hole in the bottom of the bath into a sealed elevator, either of the wheel or bucket type, which continuously removes the sinks product.
11.3.2 Centrifugal Separators
Cyclonic dense medium separators have now become widely used in the treatment of ores and coal. They provide a high centrifugal force and a low viscosity in the medium, enabling much finer separations to be achieved than in gravitational separators. Feed to these devices is typically de-slimed at about 0.5 mm, to avoid contamination of the medium with slimes and to simplify medium recovery. A finer medium is required than with gravitational vessels, to avoid fluid instability. Much work has been carried out to extend the range of particle size treated by centrifugal separators. This is particularly the case in coal preparation plants, where advantages to be gained are elimination of de-sliming screens and reduced need for flotation of the screen undersize, as well as more accurate separation of fine coal. Froth flotation has little effect on sulfur reduction, whereas pyrite can be removed, and oxidized coal can be treated by DMS. Work has shown that good separations can be achieved for coal particles as fine as 0.1 mm, but below this size separation efficiency decreases rapidly. Tests on a lead–zinc ore have shown that good separations can be achieved down to 0.16 mm using a centrifugal separator (Ruff, 1984). These, and similar results elsewhere, together with the progress made in automatic control of medium consistency, add to the growing evidence that DMS can be considered for finer material than had been thought economical or practical until recently. As the energy requirement for grinding, flotation, and dewatering is often up to 10 times that required for DMS, a steady increase of fines preconcentration DMS plants is likely.
Dense Medium Cyclones (DMC)
By far the most widely used centrifugal DM separator is the cyclone (DMC) (Figure 11.5) whose principle of operation is similar to that of the conventional hydrocyclone (Chapter 9). Cyclones typically treat ores and coal in the range 0.5–40 mm. Cyclones up to 1 m in diameter for coal preparation were introduced in the 1990s, and units up to 1.4 m diameter and capable of throughputs of over 250 t h−1 treating feed particles up to 75–90 mm are now common in the coal industry (Luttrell, 2014). Osborne (2010) has documented the decrease in circuit complexity that has accompanied this increase in unit size. The larger DMC units treating coarser sizes may obviate the requirement for static-bath vessels, and the need for fewer units minimizes differences in cut-point densities and surges that are common in banks of smaller units.

DMC sizes have lagged in metalliferous operations, the largest being 0.8 m diameter, but confer similar advantages as experience at Glencore’s lead–zinc plant at Mount Isa has shown (Napier-Munn et al., 2009).
The feed is suspended in the medium and introduced tangentially to the cyclone either via a pump or it is gravity-fed. Gravity feeding requires a taller and therefore more expensive building, but achieves a more consistent flow and less pump wear and feed degradation. The dense material (reject in the case of coal, product in the case of iron ore, for example) is centrifuged to the cyclone wall and exits at the apex. The light product “floats” to the vertical flow around the axis and exits via the vortex finder. In a DMC, there is a difference in density at various points. Figure 11.6 shows a rough indication of the density variations in a DMC containing medium only (Bekker, 2014). The figure is constructed assuming a density cut-point at a RD (RD50) of 2.85 (RD50 refers the density of a particle that has a 50:50 chance of reporting to either floats or sinks, see later). Figure 11.6 is an idealized representation, as in reality there are density gradients radially across the cyclone as well, which the mathematical and computational models of DMCs are showing. Mathematical models of the DMC for coal were developed by King and Juckes (1988); and for minerals by Scott and Napier-Munn (1992). More recently, computational fluid dynamics models of DMCs have been developed, revealing further detail on the flows inside the device (Kuang et al., 2014).

In general, DMCs have a cone angle of 20°, with manufacturers generally staying with one type of cone angle, as there has been shown to be no real benefit achieved by altering it (Bekker, 2014).
Water-Only Cyclones
Particles below ca. 0.5–1 mm are generally too fine for the drainage and washing screens used as part of the circuit to recover/recycle DM (see Section 11.4), and particles in the range 0.2–1 mm are therefore processed by water-based gravity techniques. In the coal industry, the most common such device is the spiral concentrator (Chapter 10) but water-only cyclones are also used (Luttrell, 2014). They separate coal from rock within a self-generated (autogenous) dense medium derived from fine fraction of the heavy minerals in the feed (similar in concept to the fluidized bed separators, Chapter 10). Modern units have a wide angle conical bottom to emphasize density separation and suppress size effects.
Vorsyl Separator (Figure 11.7)
Developed in the 1960s at the British Coal Mining Research and Development Establishment for processing 50–5 mm sized feeds at up to 120 t h−1, the unit continues to be used (Banerjee et al., 2003; Majumder et al., 2009). The feed to the separator, consisting of de-slimed raw coal, together with the separating medium of magnetite, is introduced tangentially, or more recently by an involute entry (see Chapter 9), at the top of the separating chamber, under pressure. Material of specific gravity less than that of the medium passes into the clean coal outlet via the vortex finder, while the near-density material and the heavier shale particles move to the wall of the vessel due to the centrifugal acceleration induced. The particles move in a spiral path down the chamber toward the base of the vessel where the drag caused by the proximity of the orifice plate reduces the tangential velocity and creates a strong inward flow toward the throat. This carries the shale, and near-density material, through zones of high centrifugal force, where a final precise separation is achieved. The shale, and a proportion of the medium, discharge through the throat into the shallow shale chamber, which is provided with a tangential outlet, and is connected by a short duct to a second shallow chamber known as the vortextractor. This is also a cylindrical vessel with a tangential inlet for the medium and reject and an axial outlet. An inward spiral flow to the outlet is induced, which dissipates the inlet pressure energy and permits the use of a large outlet nozzle without the passing of an excessive quantity of medium.

LARCODEMS (Large Coal Dense Medium Separator)
This was developed to treat a wide size range of coal (−100 mm) at high capacity in one vessel (Shah, 1987). The unit (Figure 11.8) consists of a cylindrical chamber which is inclined at approximately 30° to the horizontal. Medium at the required RD is introduced under pressure, either by pump or static head, into the involute tangential inlet at the lower end. At the top end of the vessel is another involute tangential outlet connected to a vortextractor. Raw coal of 0.5–100 mm is fed into the separator by a chute connected to the top end, the clean coal being removed through the bottom outlet. High RD particles pass rapidly to the separator wall and are removed through the top involute outlet and the vortextractor.

The first installation of the device was in the 250 t h−1 coal preparation plant at Point of Ayr Colliery in the United Kingdom (Lane, 1987). In addition to coal processing, the LARCODEMS has found application in concentrating iron ore (for example, a 1.2 m LARCODEMS is used in Kumba’s iron ore concentrator at Sishen in South Africa to treat up to 800 t h−1 of −90+6 mm feeds (Napier-Munn et al., 2014)), and in recycling, notably of plastics (Pascoe and Hou, 1999; Richard et al., 2011).
Dyna Whirlpool Separator (Figure 11.9)
Developed in the United States, this device is similar to the LARCODEMS and is used for treating fine coal, particularly in the Southern Hemisphere, as well as diamonds, fluorspar, tin, and lead–zinc ores, in the size range 0.5–30 mm (Wills and Lewis, 1980).

It consists of a cylinder of predetermined length having identical tangential inlet and outlet sections at either end. The unit is operated in an inclined position and medium of the required density is pumped under pressure into the lower outlet. The rotating medium creates a vortex throughout the length of the unit and leaves via the upper tangential discharge and the lower vortex outlet tube. Raw feed entering the upper vortex tube is sluiced into the unit by a small quantity of medium and a rotational motion is quickly imparted by the open vortex. Float material passes down the vortex and does not contact the outer walls of the unit, thus greatly reducing wear. The floats are discharged from the lower vortex outlet tube. The heavy particles (sinks) of the feed penetrate the rising medium toward the outer wall of the unit and are discharged with medium through the sink discharge pipe. Since the sinks discharge is close to the feed inlet, the sinks are removed from the unit almost immediately, again reducing wear considerably. Only near-density particles, which are separated further along the unit, actually come into contact with the main cylindrical body. The tangential sink discharge outlet is connected to a flexible sink hose and the height of this hose may be used to adjust back pressure to finely control the cut-point.
The capacity of the separator can be as high as 100 t h−1, and it has some advantages over the DM cyclone. Apart from the reduced wear, which not only decreases maintenance costs but also maintains performance of the unit, operating costs are lower, since only the medium is pumped. The unit has a higher sinks capacity and can accept large fluctuations in sink/float ratios (Hacioglu and Turner, 1985).
Tri-Flo Separator (Figure 11.10)
This can be regarded as two Dyna Whirlpool separators joined in series and has been installed in a number of coal, metalliferous, and nonmetallic ore treatment plants (Burton et al., 1991; Kitsikopoulos et al., 1991; Ferrara et al., 1994). Involute medium inlets and sink outlets are used, which produce less turbulence than tangential inlets.

The device can be operated with two media of differing densities to produce sink products of individual controllable densities. Two-stage treatment using a single medium density produces a float and two sinks products with only slightly different separation densities. With metalliferous ores, the second sink product can be regarded as a scavenging stage for the dense minerals, thus increasing their recovery. This second product may be recrushed, and, after de-sliming, returned for retreatment. Where the separator is used for washing coal, the second stage cleans the float to produce a higher grade product. Two stages of separation also increase the sharpness of separation.
11.4 DMS Circuits
Although the separating vessel is the most important element of a DMS process, it is only one part of a relatively complex circuit. Other equipment is required to prepare the feed, and to recover, clean, and recirculate the medium (Symonds and Malbon, 2002).
The feed to a dense medium circuit must be screened to remove fines, and slimes should be removed by washing, thus alleviating any tendency that such slime content may have for creating sharp increases in medium viscosity.
The greatest expense in any dense medium circuit is for reclaiming and cleaning the medium, which leaves the separator with the sink and float products. A typical circuit is shown in Figure 11.11.

The sink and float fractions pass onto separate vibrating drainage screens, where more than 90% of the medium in the separator products is recovered and pumped back via a sump into the separating vessel. The products then pass to wash screens, where washing sprays substantially complete the removal of medium and adhering fines. The finished float and sink (screen overflow) products are discharged from the screens for disposal or further treatment.
The underflows from the drainage screens are combined and a fraction reports to the main medium sump and the remainder is densified by a centrifugal or spiral densifier. The underflows from washing screens, consisting of medium, wash water, and fines, are too dilute and contaminated to be returned directly as medium to the separating vessel. They are treated (together in this case) by magnetic separation to recover the magnetic ferrosilicon or magnetite from the nonmagnetic fines, which also densifies the medium. The densified medium is directed to the main medium sump passing via a demagnetizing coil to ensure a nonflocculated, uniform suspension in the separating vessel.
Most large DMS plants include automatic control of the feed medium density. This is done by densifying sufficient medium to cause the medium density to rise, measuring the feed density with a gamma attenuation gauge, and using the signal to adjust the amount of water added to the medium to return it to the correct density.
The major costs in DMS are power (for pumping) and medium consumption. Medium losses can account for 10–35% of total costs. They are principally due to adhesion to products and losses from the magnetic separators, though the proportions will depend on the size and porosity of the ore, the characteristics of the medium solids, and the plant design (Napier-Munn et al., 1995). Losses increase for fine or porous ore, fine media, and high operating densities.
Correct sizing and selection of equipment, together with correct choice of design parameters, such as rinsing water volumes, are essential. As effluent water always contains some entrained medium, the more of this that can be recycled back to the plant the better (Dardis, 1987). Careful attention should also be paid to the quality of the medium used, Williams and Kelsall (1992) having shown that certain ferrosilicon powders are more prone to mechanical degradation and corrosion than others.
Medium rheology is critical to efficient operation of dense medium systems (Napier-Munn, 1990), although the effects of viscosity are difficult to quantify (Reeves, 1990; Dunglison et al., 2000). Management of viscosity includes selecting the correct medium specifications, minimizing operating density, and minimizing the content of clays and other fine contaminants (Napier-Munn and Scott, 1990). If the amount of fines in the circuit reaches a high proportion due, say, to inefficient screening of the feed, it may be necessary to divert an increased amount of medium into the cleaning circuit. Many circuits have such a provision, allowing medium from the draining screen to be diverted into the washing screen undersize sump.
11.5 Example DMS Applications
The most important use of DMS is in coal preparation, where a relatively simple separation removes the low-ash coal (clean coal) from the heavier high-ash discard and associated shales and sandstones. DMS is preferred to the cheaper jigs when washing coals with a relatively large proportion of middlings, or near-density material, since the separating density can be controlled at much closer limits.
Luttrell (2014) gives a generic flowsheet for a modern US coal processing plant with four independent circuits treating different size fractions: coarse size (+10 mm) using dense medium (i.e., static) vessels; medium size (−10+1 mm) using dense medium cyclones; small size (−1+0.15 mm) using spirals; and fine size (−0.15 mm) using flotation. British coals, in general, are relatively easy to wash, and jigs are used in many cases. Where DMS is preferred, drum and Drewboys separators are most widely used for the coarser fractions, with DM cyclones and Vorsyl separators being preferred for the fines. DMS is essential with most Southern Hemisphere coals, where a high middlings fraction is present. This is especially so with the large, low-grade coal deposits found in the former South African Transvaal province. Drums and Norwalt baths are the most common separators utilized to wash such coals, with DM cyclones and Dyna Whirlpools being used to treat the finer fractions.
At the Landau Colliery in the Transvaal (operated by Anglo Coal), a two-density operation is carried out to produce two saleable products. After preliminary screening of the run-of-mine coal, the coarse (+7 mm) fraction is washed in Norwalt bath separators, utilizing magnetite as the medium to give a separating density of 1.6. The sinks product from this operation, consisting predominantly of sand and shales, is discarded, and the floats product is routed to Norwalt baths operating at a lower density of 1.4. This separation stage produces a low-ash floats product, containing about 7.5% ash, which is used for metallurgical coke production, and a sinks product, which is the process middlings, containing about 15% ash, which is used as power-station fuel. The fine (0.5–7 mm) fraction is treated in a similar two-stage manner using Dyna Whirlpool separators.
In metalliferous mining, DMS is used in the preconcentration of lead–zinc ores, in which the disseminated sulfide minerals often associate together as replacement bandings in the light country rock, such that marked specific gravity differences between particles crushed to fairly coarse sizes can be exploited.
A dense medium plant was incorporated into the lead–zinc circuit at Mount Isa Mines Ltd., Australia, in 1982 in order to increase the plant throughput by 50%. The ore, containing roughly 6.5% lead, 6.5% zinc, and 200 ppm silver, consists of galena, sphalerite, pyrite, and other sulfides finely disseminated in distinct bands in quartz and dolomite. Liberation of the ore into particles which are either sulfide-rich or predominantly gangue begins at around −50 mm and becomes substantial below 18 mm.
The plant treats about 800 t h−1 of material, in the size range 1.7–13 mm by DM cyclones, at a separating RD of 3.05, to reject 30–35% of the run-of-mine ore as tailings, with 96–97% recoveries of lead, zinc, and silver to the preconcentrate. The preconcentrate has a 25% lower Bond Work Index and is less abrasive because the lower specific gravity hard siliceous material mostly reports to the rejects. (The grinding circuit product (cyclone overflow) will also be finer after installation of DMS simply due to the removal of the low-specific-gravity mineral fraction that classifies at a coarser size, as discussed in Chapter 9.) The rejects are used as a cheap source of fill for underground operations. The plant is extensively instrumented, the process control strategy being described by Munro et al. (1982).
DMS is also used to preconcentrate tin and tungsten ores, and nonmetallic ores such as fluorite and barite. It is important in the preconcentration of diamond ores, prior to recovery of the diamonds by electronic sorting (Chapter 14) or grease-tabling (Rylatt and Popplewell, 1999). Diamonds are the lowest grade of all ores mined, and concentration ratios of several million to one must be achieved. DMS produces an initial enrichment of the ore in the order of 100–1,000 to 1 by making use of the fact that diamonds have a fairly high specific gravity (3.5) and are relatively easily liberated from the ore, since they are loosely held in the parent rock. Gravitational and centrifugal separators are utilized, with ferrosilicon as the medium, and separating densities between 2.6 and 3.0. Clays in the ore sometimes present a problem by increasing the medium viscosity, thus reducing separating efficiency and the recovery of diamonds to the sinks.
Upgrading low-grade iron ores for blast furnace feed sometimes uses DMS. Both gravity and centrifugal separators are employed, and in some cases the medium density can exceed 4 (Myburgh, 2002).
11.6 Laboratory Heavy Liquid Tests
Laboratory testing may be performed on ores to assess the suitability of DMS (and other gravity methods) and to determine the economic separating density.
Liquids covering a range of densities in incremental steps are prepared, and the representative sample of crushed ore is introduced into the liquid of highest density. The floats product is removed and washed and placed in the liquid of next lower density, whose float product is then transferred to the next lower density and so on. The sinks product is finally drained, washed, and dried, and then weighed, together with the final floats product, to give the density distribution of the sample by weight (Figure 11.12).

Care should be taken when evaluating ores of fine particle size that sufficient time is given for the particles to settle into the appropriate fraction. Centrifuging is often carried out on fine materials to reduce the settling time, but this should be done carefully, as there is a tendency for the floats to become entrained in the sinks fraction. Unsatisfactory results are often obtained with porous materials, such as magnesite ores, due to the entrainment of liquid in the pores, which changes the apparent density of the particles.
After assaying the fractions for metal content, the distribution of material and metal in the density fractions of the sample can be tabulated. Table 11.1 shows such a distribution from tests performed on a tin ore. The computations are easily accomplished in a spreadsheet. Columns 2, 3, and 4 are self-explanatory. Column 5 is an intermediate calculation step, referred to as “Sn units”, and is the product of %wt and %Sn (i.e., column 2×column 4). Column 6, %Sn Distribution, is then computed by dividing each row in column 5 by the sum of units, 111.90; column 7 is then obtained by cumulating the rows in column 6. Knowing the sum of units gives a back-calculated value of the feed (or head) assay, in this case 1.12% Sn (i.e., sum of units divided by sum of increment weights, 111.90/100 as a percent).
Table 11.1
Heavy Liquid Test Results on Tin Ore Sample
| 1 | 2 | 3 | 4 | 5 | 6 | 7 |
| Specific Gravity Fraction | % Weight | % Sn in s.g. fraction | Sn Units | % Sn | ||
| Incremental | Cumulative | Distribution | Cum. Distribution | |||
| −2.55 | 1.57 | 1.57 | 0.003 | 0.0047 | 0.004 | 0.004 |
| 2.55–2.60 | 9.22 | 10.79 | 0.04 | 0.37 | 0.33 | 0.33 |
| 2.60–2.65 | 26.11 | 36.90 | 0.04 | 1.04 | 0.93 | 1.27 |
| 2.65–2.70 | 19.67 | 56.57 | 0.04 | 0.79 | 0.70 | 1.97 |
| 2.70–2.75 | 11.91 | 68.48 | 0.17 | 2.02 | 1.81 | 3.78 |
| 2.75–2.80 | 10.92 | 79.40 | 0.34 | 3.71 | 3.32 | 7.10 |
| 2.80–2.85 | 7.87 | 87.27 | 0.37 | 2.91 | 2.60 | 9.70 |
| 2.85–2.90 | 2.55 | 89.82 | 1.30 | 3.32 | 2.96 | 12.66 |
| +2.90 | 10.18 | 100.00 | 9.60 | 97.73 | 87.34 | 100.00 |
| Total | 1.12 | 111.90 | ||||
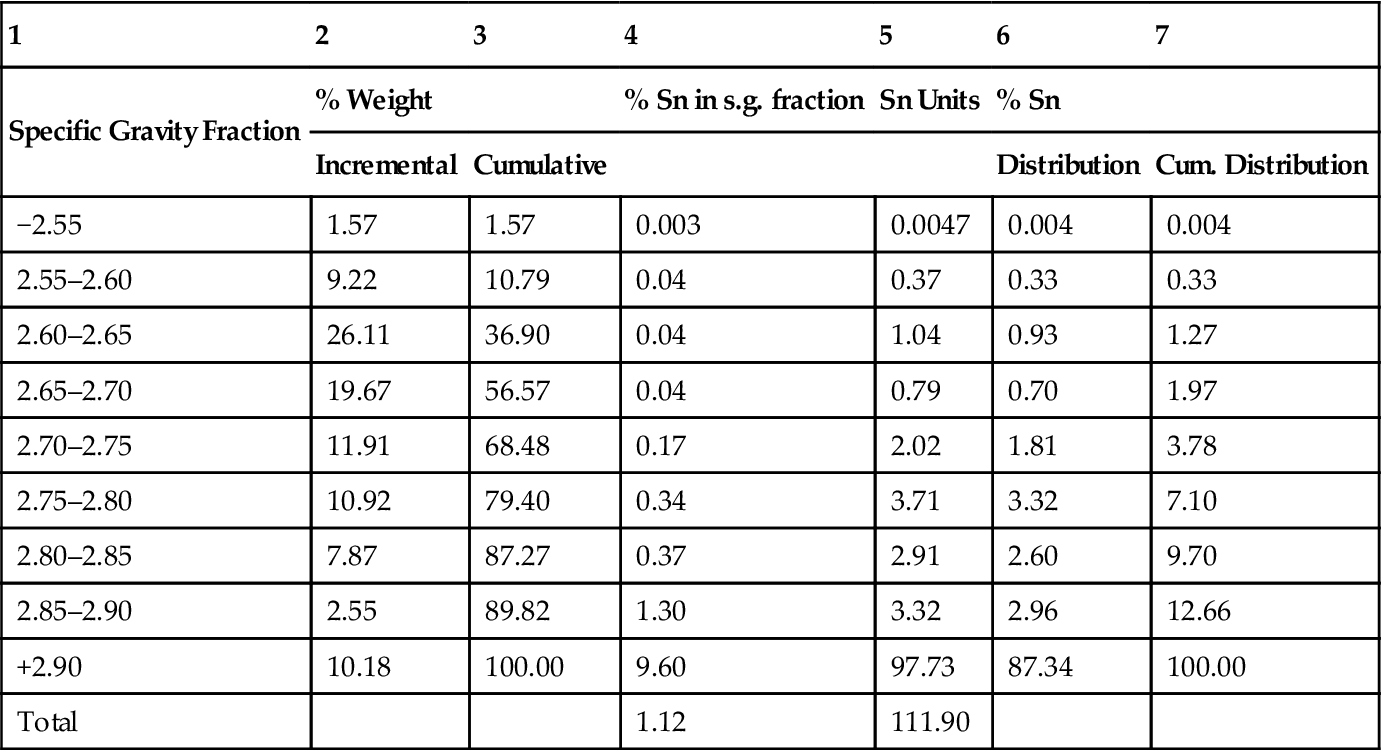
It can be seen from columns 3 and 7 of the table that if a separation density of 2.75 was chosen, then 68.48% of the material, being lighter than 2.75, would be discarded as a float product, and only 3.78% of the tin would be lost in this fraction. Conversely, 96.22% of the tin would be recovered into the sink product (i.e., 100−3.78), which accounts for 31.52% of the original total feed weight. From this information we can quickly calculate the grade of Sn in the sinks by using the definition of recovery (Chapter 1):
(11.1)
where R=96.22%, C/F (weight recovery, or yield)=31.52%, and f=1.12%, hence, solving for c, the tin grade in the sinks product, we find c=3.41% Sn. The analogous calculation can be used to determine the Sn grade in the discard (light) product, t, which gives t=0.062%.
The choice of optimum separating density must be made on economic grounds. In the example shown in Table 11.1, the economic impact of rejecting 68.48% of the feed to DMS on downstream performance must be assessed. The smaller throughput will lower grinding and concentration operating costs, the impact on grinding energy and steel costs often being particularly high. Against these savings, the cost of operating the DMS plant and the impact of losing 3.78% of the run-of-mine tin to floats must be considered. The amount of recoverable tin in this fraction has to be estimated, together with the subsequent loss in smelter revenue. If this loss is lower than the saving in overall milling costs, then DMS is economic. The optimum density is that which maximizes the difference between overall reduction in milling costs per ton of run-of-mine ore and loss in smelter revenue. Schena et al. (1990) have analyzed the economic choice of separating density.
Heavy liquid tests are important in coal preparation to determine the required density of separation and the expected yield of coal of the required ash content. The “ash” content refers to the amount of incombustible material in the coal. Since coal is lighter than the contained minerals, the higher the density of separation the higher is the yield (Chapter 1):
(11.2)
but the higher is the ash content. The ash content of each density fraction from heavy liquid testing is determined by taking about 1 g of the fraction, placing it in a cold well-ventilated furnace, and slowly raising the temperature to 815°C, maintaining the sample at this temperature until constant weight is obtained. The residue is cooled and then weighed. The ash content is the mass of ash expressed as a percentage of the initial sample weight taken.
Table 11.2 shows the results of heavy liquid tests performed on a coal sample. The coal was separated into the density fractions shown in column 1, and the weight fractions and ash contents are tabulated in columns 2 and 3, respectively. The weight percent of each product is multiplied by the ash content to give the ash units (column 4) (same calculation as “units” in Table 11.1).
Table 11.2
Heavy liquid test results on a coal sample
| 1 | 2 | 3 | 4 | 5 | 6 | 7 | 8 | 9 | 10 | 11 |
| Sp. gr. fraction | Wt % | Ash % | Ash units | Separating density | Cumulative float | Cumulative sink | ||||
| Wt % | Ash units | Ash % | Wt % | Ash units | Ash % | |||||
| −1.30 | 0.77 | 4.4 | 3.39 | 1.30 | 0.77 | 3.39 | 4.4 | 99.23 | 2213.76 | 22.3 |
| 1.30–1.32 | 0.73 | 5.6 | 4.09 | 1.32 | 1.50 | 7.48 | 5.0 | 98.50 | 2209.67 | 22.4 |
| 1.32–1.34 | 1.26 | 6.5 | 8.19 | 1.34 | 2.76 | 15.67 | 5.7 | 97.24 | 2201.48 | 22.6 |
| 1.34–1.36 | 4.01 | 7.2 | 28.87 | 1.36 | 6.77 | 44.54 | 6.6 | 93.23 | 2172.61 | 23.3 |
| 1.36–1.38 | 8.92 | 9.2 | 82.06 | 1.38 | 15.69 | 126.60 | 8.1 | 84.31 | 2090.55 | 24.8 |
| 1.38–1.40 | 10.33 | 11.0 | 113.63 | 1.40 | 26.02 | 240.23 | 9.2 | 73.98 | 1976.92 | 26.7 |
| 1.40–1.42 | 9.28 | 12.1 | 112.29 | 1.42 | 35.30 | 352.52 | 10.0 | 64.70 | 1864.63 | 28.8 |
| 1.42–1.44 | 9.00 | 14.1 | 126.90 | 1.44 | 44.30 | 479.42 | 10.8 | 55.70 | 1737.73 | 31.2 |
| 1.44–1.46 | 8.58 | 16.0 | 137.28 | 1.46 | 52.88 | 616.70 | 11.7 | 47.12 | 1600.45 | 34.0 |
| 1.46–1.48 | 7.79 | 17.9 | 139.44 | 1.48 | 60.67 | 756.14 | 12.5 | 39.33 | 1461.01 | 37.1 |
| 1.48–1.50 | 6.42 | 21.5 | 138.03 | 1.50 | 67.09 | 894.17 | 13.3 | 32.91 | 1322.98 | 40.2 |
| +1.50 | 32.91 | 40.2 | 1322.98 | – | 100.00 | 2217.15 | 22.2 | – | – | – |
| Total | 100.0 | 22.2 | 2217.15 | |||||||

The total floats and sinks products at the various separating densities shown in column 5 are tabulated in columns 6–11. To obtain the cumulative floats at each separation density, columns 2 and 4 are cumulated from top to bottom to give columns 6 and 7, respectively. Column 7 is then divided by column 6 to obtain the cumulative percent ash (column 8). Cumulative sink ash is obtained in essentially the same manner, except that columns 2 and 4 are cumulated from bottom to top to give columns 9 and 10, respectively. The results are plotted in Figure 11.13 as typical washability curves.

Suppose an ash content of 12% is required in the coal product. It can be seen from the washability curves that such a coal would be produced at a yield of 55% (cumulative percent floats), and the required density of separation is 1.465.
The difficulty of the separation in terms of operational control is dependent mainly on the amount of material present in the feed that is close to the required density of separation. For instance, if the feed were composed entirely of pure coal at specific gravity 1.3 and shale at specific gravity 2.7, then the separation would be easily carried out over a wide range of operating densities. If, however, the feed consists of appreciable middlings, and much material present is near-density (i.e., very close to the chosen separating density), then only a small variation in this density will seriously affect the yield and ash content of the product.
The amount of near-density material present is sometimes regarded as being the weight of material in the range ±0.1 or ±0.05 of the separating RD. Separations involving feeds with less than about 7% of ±0.1 near-density material are regarded by coal preparation engineers as being fairly easy to control. Such separations are often performed in Baum jigs, as these are cheaper than dense medium plants, which require expensive media-cleaning facilities, and no feed preparation (i.e., removal of the fine particles by screening) is required. However, the density of separation in jigs is not as easy to control to fine limits, as it is in DMS, and for near-density material much above 7%, DMS is preferred.
Heavy liquid tests can be used to evaluate any ore, and combined with Table 11.3 can be used to indicate the type of separator that could effect the separation in practice (Mills, 1980).
Table 11.3
Gravity Separation Process Depends on Amount of Near-Density Material
| Wt % Within ±0.1 RD of separation | Gravity Process Recommended | Type |
| 0–7 | Almost any process | Jigs, tables, spirals |
| 7–10 | Efficient process | Sluices, cones, DMS |
| 10–15 | Efficient process with good operation | |
| 15–25 | Very efficient process with expert operation | DMS |
| >25 | Limited to a few exceptionally efficient processes with expert operation | DMS with close control |
Table 11.3 takes no account of the particle size of the material and experience is therefore required in its application to heavy liquid results, although some idea of the effective particle size range of gravity separators can be gained from Figure 11.14. The throughput of the plant must also be taken into account with respect to the type of separator chosen.

11.7 Efficiency of DMS
Laboratory testing assumes perfect separation and, in such batch tests, conditions are indeed close to the ideal, as sufficient time can be taken to allow complete separation to take place.
In a continuous production process, however, conditions are usually far from ideal and particles can be misplaced to the wrong product for a variety of reasons. The dominant effect is that of the density distribution of the feed. Very dense or very light particles will settle through the medium and report to the appropriate product quickly, but particles of density close to that of the medium will move more slowly and may not reach the right product in the time available for the separation. In the limit, particles of density the same as, or very close to, that of the medium will follow the medium and divide in much the same proportion.
Other factors also play a role in determining the efficiency of separation. Fine particles generally separate less efficiently than coarse particles because of their slower settling rates. The properties of the medium, the design and condition of the separating vessel, and the feed conditions, particularly feed rate, will all influence the separation.
Partition Curve
The efficiency of separation can be represented by the slope of a partition or Tromp curve, first introduced by Tromp (1937). It describes the separating efficiency for the separator whatever the quality of the feed and can be used for estimation of performance and comparison between separators.
The partition curve relates the partition coefficient or partition value, that is, the percentage of the feed material of a particular specific gravity, which reports to either the sinks product (generally used for minerals) or the floats product (generally used for coal), to specific gravity (Figure 11.15). It is exactly analogous to the classification efficiency curve (Chapter 9), in which the partition coefficient is plotted against particle size rather than specific gravity.

The ideal partition curve reflects a perfect separation, in which all particles having a density higher than the separating density report to sinks and those lighter report to floats. There is no misplaced material.
The partition curve for a real separation shows that efficiency is highest for particles of density far from the operating density and decreases for particles approaching the operating density.
The area between the ideal and real curves is called the “error area” and is a measure of the degree of misplacement of particles to the wrong product.
Many partition curves give a reasonable straight-line relationship between the distribution of 25% and 75%, and the slope of the line between these distributions is used to show the efficiency of the process.
The probable error of separation or the Ecart probable (Ep) is defined as half the difference between the density where 75% is recovered to sinks and that at which 25% is recovered to sinks, that is, from Figure 11.15:
(11.3)
The density at which 50% of the particles report to sinks is shown as the effective density of separation, which may not be exactly the same as the medium density, particularly for centrifugal separators, in which the separating density is generally higher than the medium density. This density of separation is referred to as the RD50 or ρ50 where the 50 refers to 50% chance of reporting to sinks (or floats).
The lower the Ep, the nearer to vertical is the line between 25% and 75% and the more efficient is the separation. An ideal separation has a vertical line with an Ep=0, whereas in practice the Ep usually lies in the range 0.01–0.10.
The Ep is not commonly used as a method of assessing the efficiency of separation in units such as tables and spirals due to the many operating variables (wash water, table slope, speed, etc.) which can affect the separation efficiency. It is, however, ideally suited to the relatively simple and reproducible DMS process. However, care should be taken in its application, as it does not reflect performance at the tails of the curve, which can be important.
Construction of Partition Curves
The partition curve for an operating dense medium vessel can be determined by sampling the sink and float products and performing heavy liquid tests to determine the amount of material in each density fraction. The range of liquid densities applied must envelope the working density of the dense medium unit. The results of heavy liquid tests on samples of floats and sinks from a vessel separating coal (floats) from shale (sinks) are shown in Table 11.4. The calculations are easily performed in a spreadsheet.
Table 11.4
Determination of Partition Coefficient for Vessel Separating Coal from Shale
| 1 | 2 | 3 | 4 | 5 | 6 | 7 | |
| Specific Gravity Fraction | Analysis (wt %) | % of feed | Reconstituted Feed (%) | Nominal Specific Gravity | Partition Coefficient | ||
| Floats | Sinks | Floats | Sinks | ||||
| −1.30 | 83.34 | 18.15 | 68.84 | 3.16 | 71.98 | – | 4.39 |
| 1.30–1.40 | 10.50 | 10.82 | 8.67 | 1.88 | 10.56 | 1.35 | 17.84 |
| 1.40–1.50 | 3.35 | 9.64 | 2.77 | 1.68 | 4.45 | 1.45 | 37.74 |
| 1.50–1.60 | 1.79 | 13.33 | 1.48 | 2.32 | 3.80 | 1.55 | 61.07 |
| 1.60–1.70 | 0.30 | 8.37 | 0.25 | 1.46 | 1.71 | 1.65 | 85.46 |
| 1.70–1.80 | 0.16 | 5.85 | 0.13 | 1.02 | 1.15 | 1.75 | 88.51 |
| 1.80–1.90 | 0.07 | 5.05 | 0.06 | 0.88 | 0.94 | 1.85 | 93.83 |
| 1.90–2.00 | 0.07 | 4.34 | 0.06 | 0.76 | 0.81 | 1.95 | 92.89 |
| +2.00 | 0.42 | 24.45 | 0.35 | 4.25 | 4.60 | – | 92.46 |
| Total | 100.00 | 100.00 | 82.60 | 17.40 | 100.00 | ||

Columns 1 and 2 are the results of laboratory tests on the float and sink products, and columns 3 and 4 relate these results to the total distribution of the feed material to floats and sinks, which, in this example, is determined by directly weighing the two products over a period of time. The result of such determinations showed that 82.60% of the feed reported to the floats product (and 17.40% reported to the sinks) (see the Total row). Thus, for example, the first number in column 3 is (83.34/100)×82.60 (=63.84) and in column 4 it is (18.15/100)×17.40 (=3.16). The weight fraction in columns 3 and 4 can be added together to produce the reconstituted feed weight distribution in each density fraction (column 5). Column 6 gives the nominal (average) specific gravity of each density range, for example material in the density range 1.30–1.40 is assumed to have a specific gravity lying midway between these densities, that is, 1.35. Since the −1.30 specific gravity fraction and the +2.00 specific gravity fraction have no bound, no nominal density is given.
The partition coefficient (column 7) is the percentage of feed material of a certain nominal specific gravity which reports to sinks, that is:
The partition curve can then be constructed by plotting the partition coefficient against the nominal specific gravity, from which the separation density and probable error of separation of the vessel can be determined. The plot is shown in Figure 11.16. Reading from the plot, the RD50 is ca. 1.52 and the Ep ca. 0.12 ((1.61−1.37)/2).

The partition curve can also be determined by applying the mass balancing procedure explained in Chapter 3, provided the density distributions of feed, as well as sinks and floats, are available. Often the feed is difficult to sample, and thus resort is made to direct measurement of sinks and floats flowrates. It must be understood, however, that the mass balancing approach is the better way to perform the calculations as redundant data are available to execute data reconciliation. The mass balance/data reconciliation method is illustrated in determination of the partition curve for a hydrocyclone in Chapter 9.
An alternative, rapid, method of determining the partition curve of a separator is to use density tracers. Specially developed color-coded plastic tracers of known density can be fed to the process, the partitioned products being collected and hand sorted by density (color). It is then a simple matter to construct the partition curve directly by noting the proportion of each density of tracer reporting to either the sink or float product. Application of tracer methods has shown that considerable uncertainties can exist in experimentally determined Tromp curves unless an adequate number of tracers is used, and Napier-Munn (1985) presents graphs that facilitate the selection of sample size and the calculation of confidence limits. A system in operation in a US coal preparation plant uses sensitive metal detectors that automatically spot and count the number of different types of tracers passing through a stream (Chironis, 1987).
Partition curves can be used to predict the products that would be obtained if the feed or separation density were changed. The curves are specific to the vessel for which they were established and are not affected by the type of material fed to it, provided:
a. The feed size range is the same—efficiency generally decreases with decrease in size; Figure 11.17 shows typical efficiencies of gravitational separators or baths (drum, cone, etc.) and centrifugal separators (DMC, Dyna Whirlpool, etc.) versus particle size. It can be seen that, in general, below about 10 mm, centrifugal separators are better than gravitational separators.
b. The separating density is in approximately the same range—the higher the effective separating density the greater the probable error, due to the increased medium viscosity. It has been shown that the Ep is directly proportional to the separating density, all other factors being the same (Gottfried, 1978).

The partition curve for a vessel can be used to determine the amount of misplaced material that will report to the products for any particular feed material. For example, the distribution of the products from the tin ore, which was evaluated by heavy liquid tests (Table 11.1), can be determined for treatment in an operating separator. Figure 11.18 shows a partition curve for a separator having an Ep of 0.07.

The curve can be shifted slightly along the abscissa until the effective density of separation corresponds to the laboratory evaluated separating density of 2.75. The distribution of material to sinks and floats can now be evaluated: for example, at a nominal specific gravity of 2.725, 44.0% of the material reports to the sinks and 56.0% to the floats.
The performance is evaluated in Table 11.5. Columns 1, 2, and 3 show the results of the heavy liquid tests, which were tabulated in Table 11.1. Columns 4 and 5 are the partition values to sinks and floats, respectively, obtained from the partition curve. Column 6=column 1×column 4, and column 9=column 1×column 5. The assay of each fraction is assumed to be the same, whether or not the material reports to sinks or floats (columns 2, 7, and 10). Columns 8 and 11 are then calculated as the amount of tin reporting to sinks and floats in each fraction (columns 6×7 and 9×10) as a percentage of the total tin in the feed (sum of columns 1×2, i.e., 1.12).
Table 11.5
Separation of Tin Ore Evaluation
| Specific Gravity Fraction | Nominal S. G. | Feed | Partition Value (%) | Predicted Sinks | Predicted Floats | |||||||
| 1 | 2 | 3 | 4 | 5 | 6 | 7 | 8 | 9 | 10 | 11 | ||
| Wt % | % Sn | % Sn Dist. | Sinks | Floats | Wt % | % Sn | % Sn Dist. | Wt % | % Sn | % Sn Dist. | ||
| −2.55 | – | 1.57 | 0.003 | 0.004 | 0.0 | 100.0 | 0.00 | 0.003 | 0.00 | 1.57 | 0.003 | 0.04 |
| 2.55–2.60 | 2.575 | 9.22 | 0.04 | 0.33 | 6.0 | 94.0 | 0.55 | 0.04 | 0.02 | 8.67 | 0.04 | 0.31 |
| 2.60–2.65 | 2.625 | 26.11 | 0.04 | 0.93 | 13.5 | 86.5 | 3.52 | 0.04 | 0.13 | 22.59 | 0.04 | 0.80 |
| 2.65–2.70 | 2.675 | 19.67 | 0.04 | 0.70 | 27.0 | 73.0 | 5.31 | 0.04 | 0.19 | 14.35 | 0.04 | 0.51 |
| 2.70–2.75 | 2.725 | 11.91 | 0.17 | 1.81 | 44.0 | 56.0 | 5.24 | 0.17 | 0.80 | 6.67 | 0.17 | 1.01 |
| 2.75–2.80 | 2.775 | 10.92 | 0.34 | 3.32 | 63.0 | 37.0 | 6.88 | 0.34 | 2.09 | 4.04 | 0.34 | 1.23 |
| 2.80–2.85 | 2.825 | 7.87 | 0.37 | 2.60 | 79.5 | 20.5 | 6.26 | 0.37 | 2.07 | 1.61 | 0.37 | 0.53 |
| 2.85–2.90 | 2.875 | 2.55 | 1.30 | 2.96 | 90.5 | 9.5 | 2.32 | 1.30 | 2.68 | 0.24 | 1.30 | 0.28 |
| +2.90 | – | 10.18 | 9.60 | 87.34 | 100.00 | 0.00 | 10.18 | 9.60 | 87.31 | 0.00 | 9.60 | 0.00 |
| Total | 100.00 | 1.12 | 100.00 | 40.26 | 2.65 | 95.29 | 59.74 | 0.09 | 4.71 | |||

The total distribution of the feed to sinks is the sum of all the fractions in column 6, that is, 40.26%, while the recovery of tin into the sinks is the sum of the fractions in column 8, that is, 95.29%. This compares with a distribution of 31.52% and a recovery of 96.19% of tin in the ideal separation. In terms of upgrading, the grade of tin in the sinks is now 2.65% (solving Eq. (11.1), i.e., 96.29×1.12/40.26) compared to the ideal of 3.42% Sn.
This method of evaluating the performance of a separator on a particular feed is tedious and is ideal for a spreadsheet, providing that the partition values for each density fraction are known. These can be represented by a suitable mathematical function. There is a large literature on the selection and application of such functions. Some are arbitrary, and others have some theoretical or heuristic justification. The key feature of the partition curve is its S-shaped character. In this it bears a passing resemblance to a number of probability distribution functions, and indeed the curve can be thought of as a statistical description of the DMS process, describing the probability with which a particle of given density reports to the sink product. Tromp himself recognized this in suggesting that the amount of misplaced material relative to a suitably transformed density scale was normally distributed, and Jowett (1986) showed that a partition curve for a process controlled by simple probability factors should have a normal distribution form.
However, many real partition curves do not behave ideally like the one illustrated in Figure 11.15. In particular, they are not asymptotic to 0 and 100%, but exhibit evidence of short-circuit flow to one or both products (e.g., Figure 11.16). Stratford and Napier-Munn (1986) identified four attributes required of a suitable function to represent the partition curve:
1. It should have natural asymptotes, preferably described by separate parameters.
2. It should be capable of exhibiting asymmetry about the separating density; that is, the differentiated form of the function should be capable of describing skewed distributions.
3. It should be mathematically continuous.
4. Its parameters should be capable of estimation by accessible methods.
A two-parameter function asymptotic to 0 and 100% is the Rosin-Rammler function, originally developed to describe size distributions (Tarjan, 1974) (see Chapter 4):
(11.4)
In this form, Pi is the partition number (feed reporting to sinks, %), ρi the mean density of density fraction i, and a and m the parameters of the function; m describes the steepness of the curve (high values of m indicating more efficient separations). Partition curve functions are normally expressed in terms of the normalized density, ρ/ρ50, where ρ50 is the separating density (RD50). The normalized curve is generally independent of cut-point and medium density, but is dependent on particle size. Inserting this normalized density into Eq. (11.4), and noting that P=50 for ρ=ρ50 (ρ/ρ50=1), gives:
(11.5)
One of the advantages of Eq. (11.5) is that it can be linearized so that simple linear regression can be used to estimate m and ρ50 from experimental data:
(11.6)
 (11.6)
(This approach is less important today with any number of curve-fitting routines available (and Excel Solver), the same point also made in Chapter 9 when curve-fitting cyclone partition curves.)
Gottfried (1978) proposed a related function, the Weibull function, with additional parameters to account for the fact that the curves do not always reach the 0 and 100% asymptotes due to short-circuit flow:
(11.7)
 (11.7)
The six parameters of the function (c, f0, ρ50, x0, a, and b) are not independent, so by the argument of Eq. (11.5), x0 can be expressed as:
(11.8)
In this version of the function, representing percentage of feed to sinks, f0 is the proportion of high-density material misplaced to floats, and 1−(c+f0) is the proportion of low-density material misplaced to sinks, so that c+f0≤1. The curve therefore varies from a minimum of 100[1−(c+f0)] to a maximum of 100(1−f0).
The parameters of Eq. (11.8) have to be determined by nonlinear estimation. First approximations of c, f0, and ρ50 can be obtained from the curve itself.
King and Juckes (1988) used Whiten’s classification function (Lynch, 1977) with two additional parameters to describe the short-circuit flows or by-pass:
(11.9)
 (11.9)
Here, for Pi is the proportion to underflow, α the fraction of feed which short-circuits to overflow, and β the fraction of feed which short-circuits to underflow; b is an efficiency parameter, with high values of b indicating high efficiency. Again, the function is nonlinear in the parameters.
The Ep can be predicted from these functions by substitution for ρ75 and ρ25. Scott and Napier-Munn (1992) showed that for efficient separations (low Ep) without short-circuiting, the partition curve could be approximated by:
(11.10)
 (11.10)
Organic Efficiency
This term is often used to express the efficiency of coal preparation plants. It is defined as the ratio (normally expressed as a percentage) between the actual yield of a desired product and the theoretical possible yield at the same ash content.
For instance, if the coal, whose washability data are plotted in Figure 11.13, produced an operating yield of 51% at an ash content of 12%, then, since the theoretical yield at this ash content is 55%, the organic efficiency is equal to 51/55 or 92.7%.
Organic efficiency cannot be used to compare the efficiencies of different plants, as it is a dependent criterion, and is much influenced by the washability of the coal. It is possible, for example, to obtain a high organic efficiency on a coal containing little near-density material, even when the separating efficiency, as measured by partition data, is quite poor.