
Civil Engineering Challenges Associated With Design of Offshore Wind Turbines With Special Reference to China
Subhamoy Bhattacharya1, Lizhong Wang2, Junwei Liu3 and Yi Hong2, 1University of Surrey, Guildford, United Kingdom, 2Zhejiang University, Zhejiang Sheng, China, 3Qingdao University of Technology, Qingdao Shi, China Email: 1[email protected]
Abstract
Offshore wind turbines (OWTs) are new types of structures with no track record of long-term performance. This chapter discusses the challenges in the design of OWTs with a focus on the Chinese waters. The main loads acting on a wind turbine are discussed together with the specific case of Chinese waters where in some location typhoon/cyclone and earthquake governs. The relatively soft and complex multilayering ground conditions in the Chinese water are also discussed. The challenges associated with dynamic soil–structure interaction are also highlighted.
Keywords
China; offshore wind turbines; multilayering soft seabed; typhoon; earthquake
13.1 Offshore Wind Potential in China
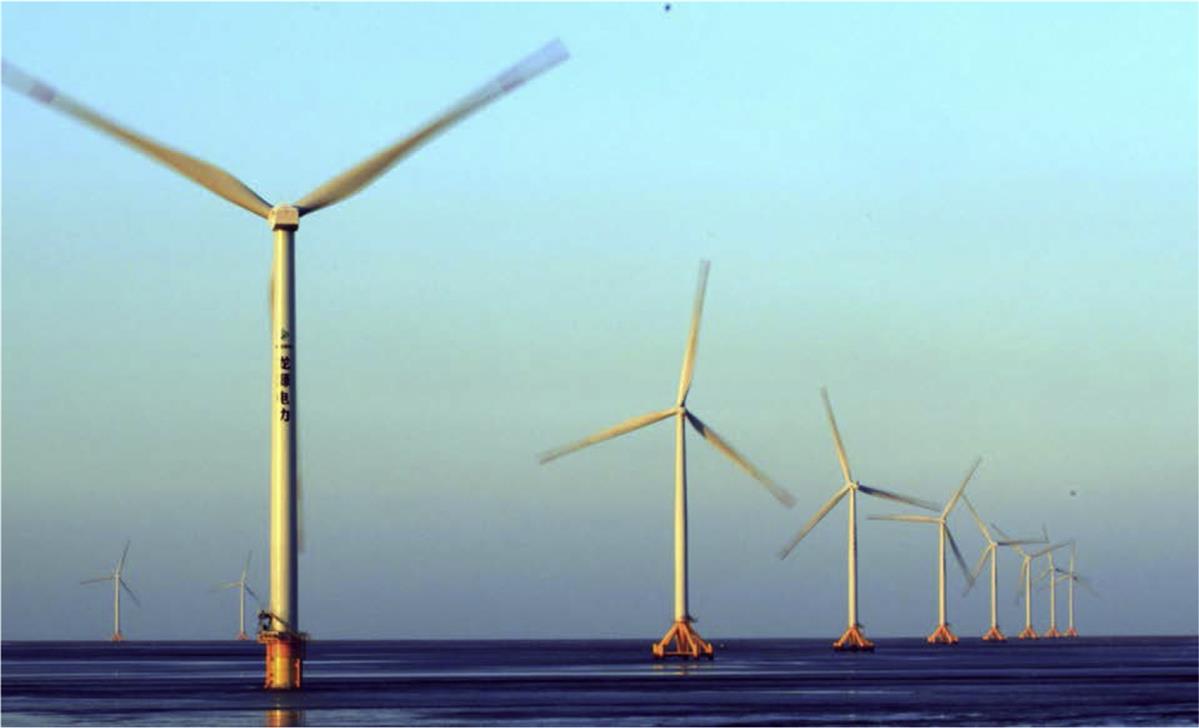
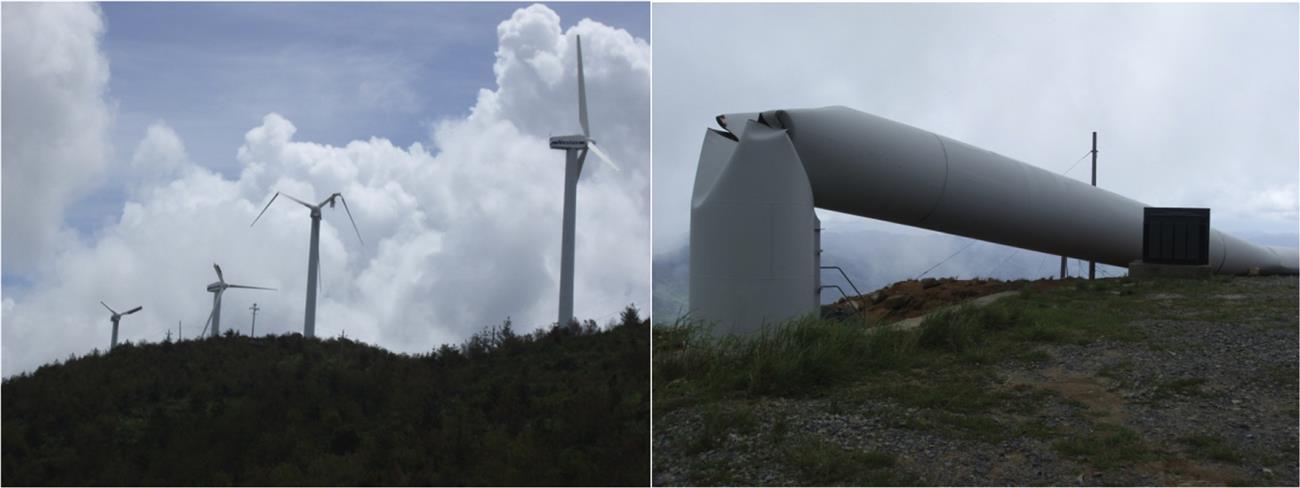
Due to the rapid and consistent economic growth and prosperity, the demand for energy in China has grown enormously. Due to the extensive coastline and to comply with the global climate agreements, offshore wind power sector has been expanding. The wind power industry has been growing steadily since 2006. Up to about 2010, the turbines were mostly built onshore in areas with high wind speed (e.g., Xinjiang Province) and offshore potentials were not investigated. However, the 12th Five Year Plan (2011–15) of the PRC (People Republic of China) Government gave a boost to expand the offshore capability and the target was to develop offshore wind turbine (OWT) farms of 5 GW capacity by 2015 and 30 GW capacity by 2020. Furthermore, there was an announcement of a “National Offshore Wind Power Development and Construction Plan (2014–16)” to develop offshore wind farms in Chinese waters/China Sea. Fig. 13.1 shows the location of the development of the wind farms in Chinese waters.

China completed the first OWT installation (Suizhong 35-1 Oil Field Turbine) in 2007. Subsequently, the first offshore wind farm in Asia was developed in 2010 through the Donghai Bridge 100 MW Offshore Wind Power Demonstration Project. In 2010, a wind farm was also constructed in the intertidal area of Longyuan Rudong. After successful construction and operation of the first three wind farms, a large number of wind farm projects were consented/authorized and construction is under way. Table 13.1 provides the statistics of the work in progress.
Table 13.1
| Development Status | No. of Farms |
| Fully commissioned | 23 |
| Partial generation | 2 |
| Under construction | 11 |
| Preconstruction | 8 |
| Consent authorized | >100 |
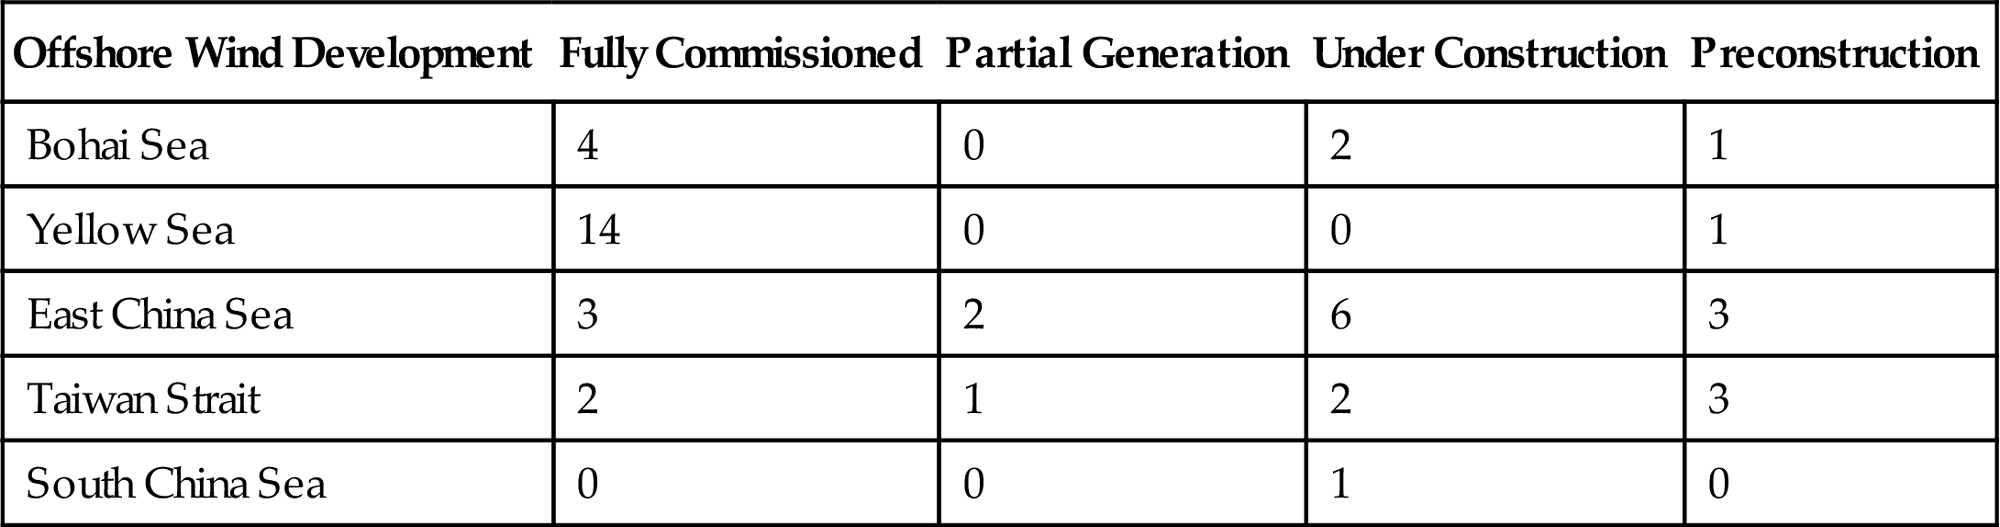
As shown in Fig. 13.1A, there are five main sea areas in China: (1) Bohai Sea (enclosed sea); (2) Yellow Sea; (3) East China Sea; (4) South China Sea, and (5) Taiwan Strait. The locations and capacities of offshore wind farms (in operation or still under construction) in China are illustrated in Fig. 13.1B.
The long stretch of China Sea is becoming attractive for many scientific surveys related to wind energy, as a result of the rapid development of economy in the adjoining areas, leading to energy demand. As the wind speed offshore is much larger and stable than that onshore counterpart, offshore wind power developments in these zones are attracting serious investors. The three main economic zones (Beijing Zone, Yangtze River Delta, and Pearl River Delta) are also very close to the long coastline of China, and is therefore convenient for electricity transport to the regional economic zones. Therefore, these sea regions are suitable for construction and application of offshore wind farms.
The distributions of offshore wind farms in those five sea regions are different on both number and density. It can be seen from Fig. 13.1 that offshore wind farms are densely distributed along Yellow Sea coast and Hangzhou Bay. However, compared with Yangtze River Delta Economic Region (around Shanghai), there are few offshore wind farms in Pearl River Delta Economic Region (Guangzhou–Hong Kong). Table 13.2 provides statistics of the distribution of the projects in China Sea.
13.2 Dynamic Sensitivity of OWT Structures
OWTs, due to their shape and form (i.e., a long slender column with a heavy mass as well as a rotating mass at the top), are dynamically sensitive because the natural frequencies of these slender structures are very close to the excitation frequencies imposed by the environmental and mechanical loads [1]. Fig. 13.2 shows a simple mechanical model of the whole system including the different components and the design variables. In the model, the foundation is replaced by four springs: KL (lateral spring), KR (rocking spring), KV (vertical spring), and KLR (cross-coupling spring). The stability and deformation of the system is very much dependent on these four springs; a few things may be noted regarding these springs:
1. The properties and shape of the springs (load–deformation characteristics) should be such that the whole structure should not collapse under the action of extreme loads and the deformation is acceptable under the working loads.
2. The values of the springs (stiffness of the foundation) are necessary to compute the natural period of the whole structure as this is a linear Eigen value analysis. Further details on the analysis required can be found by Adhikari and Bhattacharya [2] and Adhikari and Bhattacharya [3].
3. The values of the springs will also dictate the overall dynamic stability of the system due to its nonlinear nature. It must be mentioned that these springs are not only frequency dependent but also change with cycles of loading due to dynamic soil–structure interaction. Further details on the dynamic interaction can be found in the work of Bhattacharya et al. [4,5].
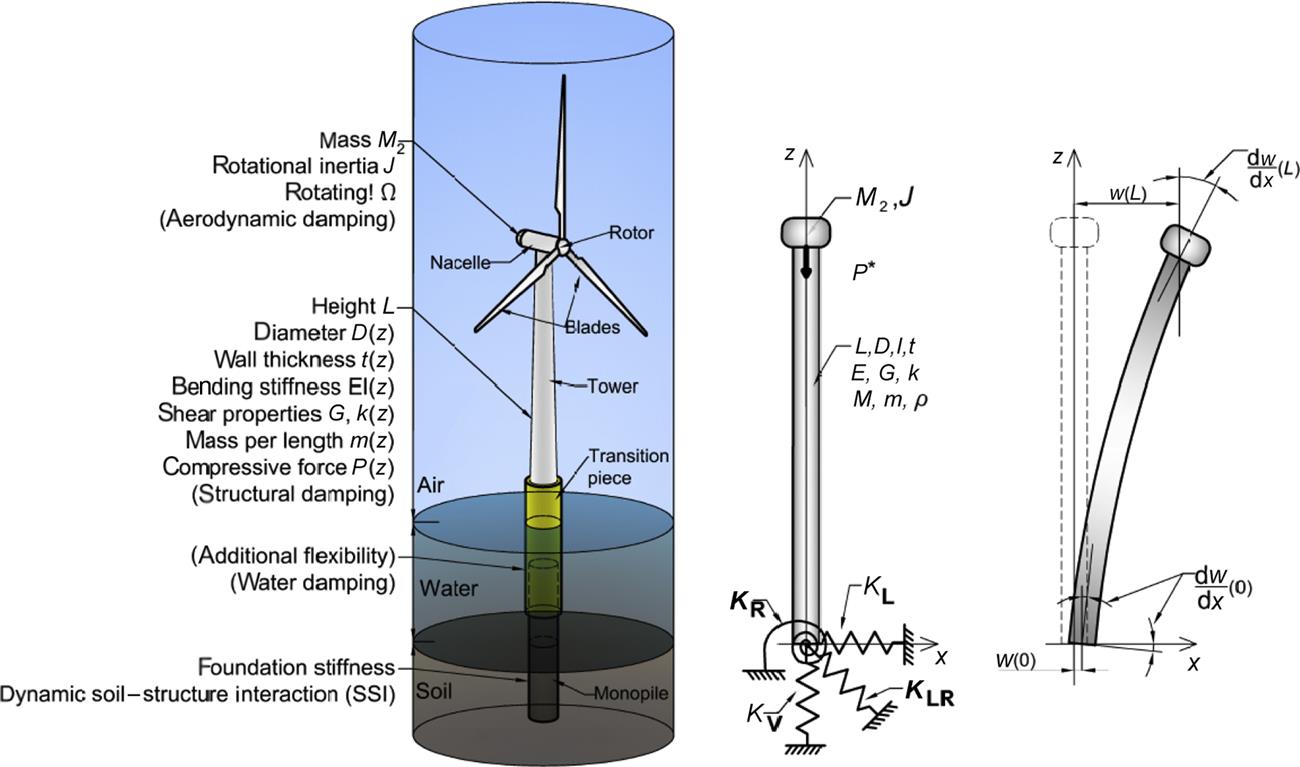
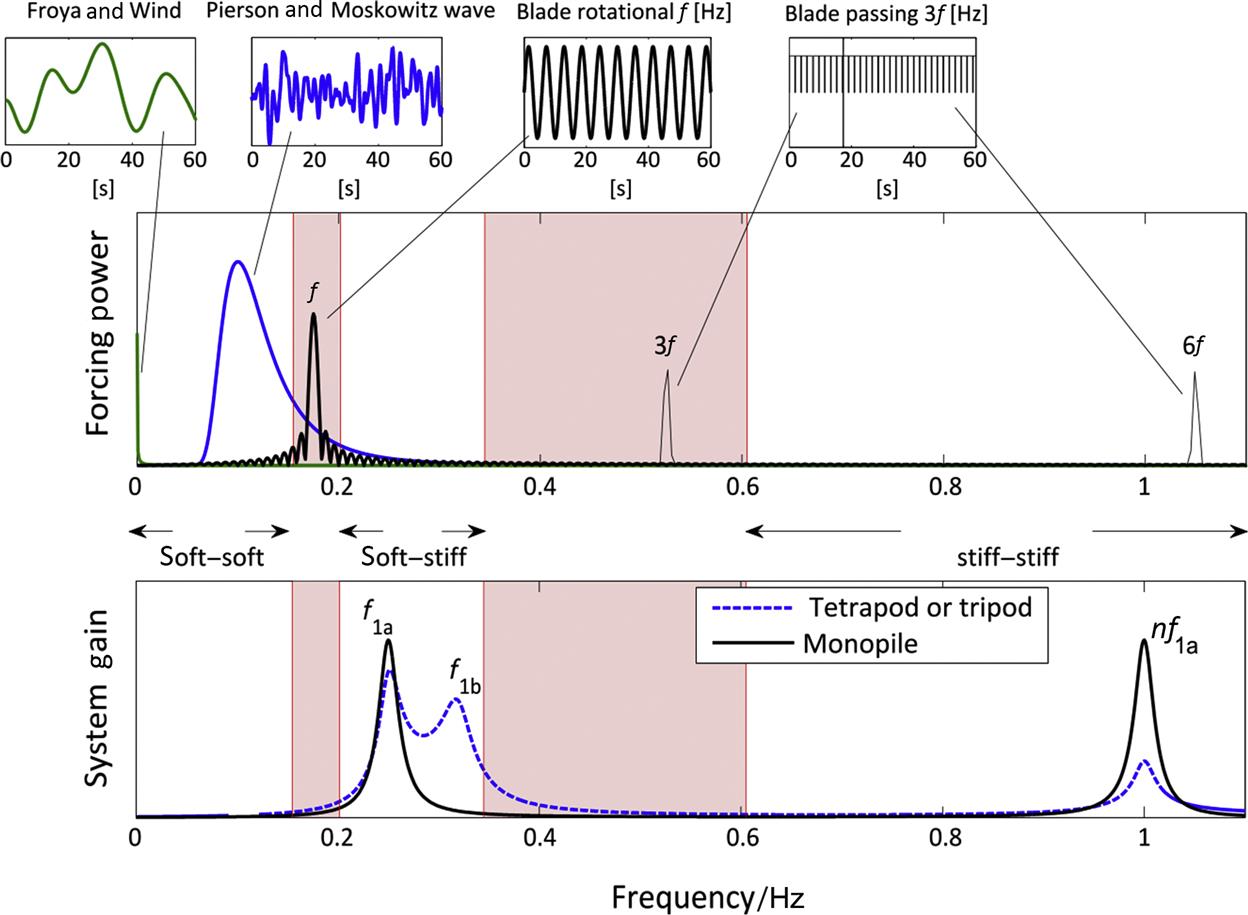
Fig. 13.3 shows typical wind and wave power spectral densities (PSDs) for offshore sites which essentially describe the frequency content of dynamic excitations from wind turbulence and waves. The graph also shows the turbine’s rotational frequency range (1P) and the turbine’s blade passing frequency range (3P) for a range of commercial wind turbines of different capacities (2–8 MW). A simplified way of translating the wind turbulence spectrum and the wave spectrum into mudline bending moment spectra through linear transfer functions has been presented by Arany et al. [6] The peak frequencies of loading have been shown to coincide with the peak frequencies of wind turbulence and waves. However, loads at the 1P and 3P frequencies can also be observed through effects such as aerodynamic and mass imbalance of the rotor and rotational sampling of turbulence by the blades, for 1P and 3P loads, respectively [6,7]. Further details on the estimations of the loads can be found in work by Bhattacharya [6,8]. For the widely used soft–stiff design, the target Eigen frequency (for practical purposes, the first natural frequency) is a frequency in the narrow gap between 1P and 3P. Fig. 13.3 also shows measured natural frequencies of a wide array of OWTs from several different wind farms across Europe (see Table 13.3 for the nomenclature on the wind turbine structure for which the measured natural frequencies are shown). The figure clearly shows the trend that the target natural frequencies of heavier turbines (8 MW) are indeed closer to the excitation frequencies of the wave and wind, making these structures even more sensitive to dynamics. It is of interest to review the codes of practice in this regard. DNV code [9] suggests that first natural frequency should not be within 10% of the 1P and 3P ranges. It is apparent from Fig. 13.4 that for soft–stiff design, the first natural frequency of the wind turbine needs to be fitted in a very narrow band (in some cases the 1P and 3P ranges may even coincide leaving no gap) which is a significant challenge.
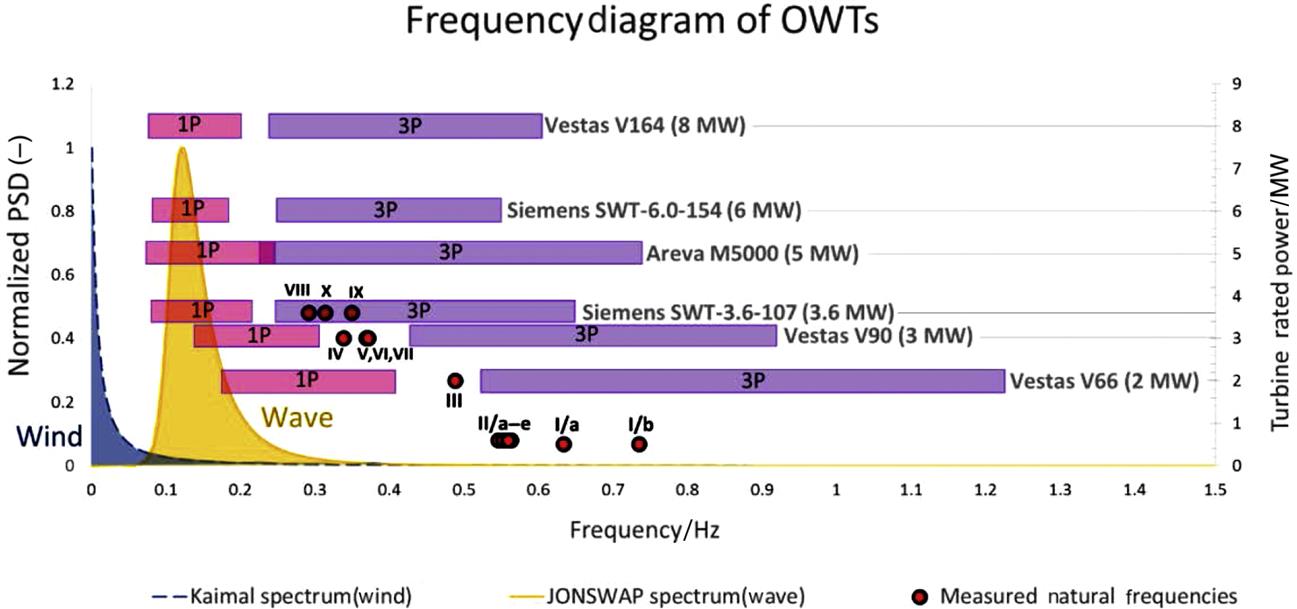
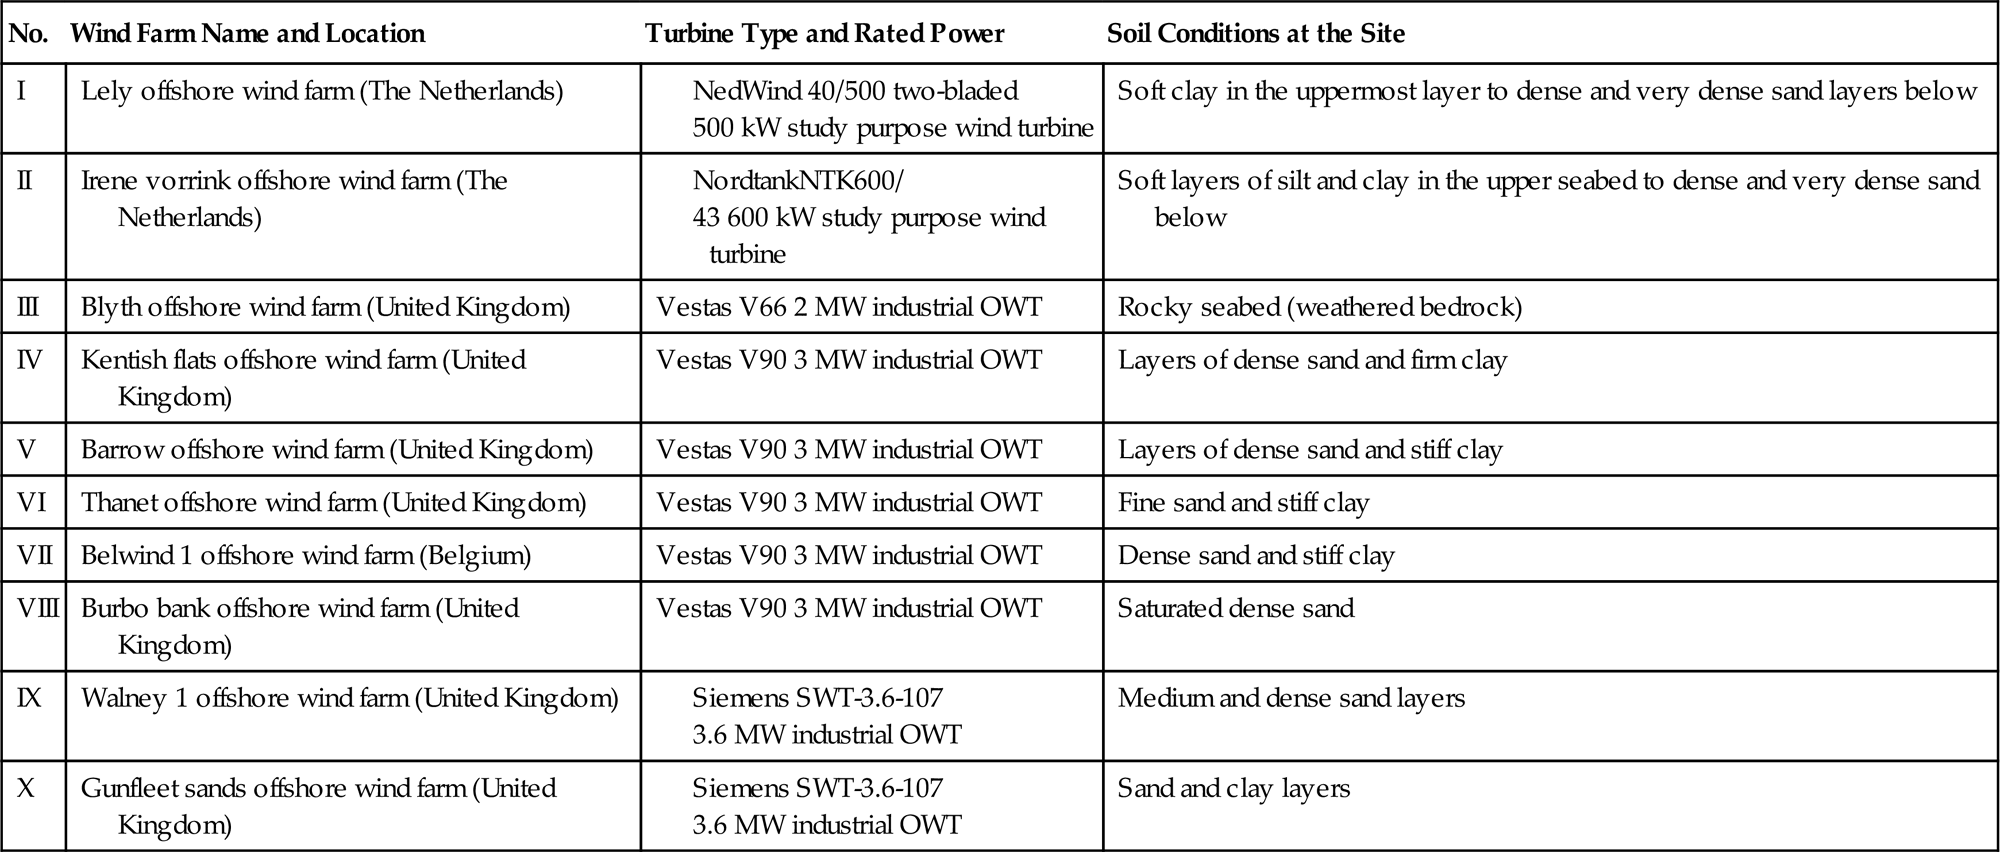
Table 13.3
Analyzed Offshore Wind Farms With the Used Wind Turbines and Soil Conditions at the Sites

13.3 Dynamic Issues in Support Structure Design
The schematic diagram of a wind turbine system model shown in Fig. 13.2 is relevant to the study of the overall system dynamics which is important for many design calculations such as Eigen frequencies and fatigue. In practice, the support structure is the whole structure that supports the heavy turbine, i.e., the components below the rotor nacelle assembly (RNA) which includes the tower, substructure, and foundation. The foundation is defined as the part of the support structure that is embedded in the ground below the mudline. The tower is typically a tubular tapered column. As the natural frequencies of these systems are very close to the forcing frequencies, the dynamics pose multiple design challenges and the scale of the challenges will vary depending on turbine types and site characteristics. These issues are briefly mentioned in the next section.
There are two main categories of modern wind turbines based on the operational range:
1. Variable rotational speed machines have an operational speed range (1P range).
2. Constant rotational speed wind turbines that operate at a single rotational speed (fixed 1P).
Variable speed machines have 1P and 2P/3P frequency bands which must be avoided, as opposed to a single frequency (applicable to constant rotational speed machines). They are more restrictive from the point of view of foundation design as the forcing frequency is a band rather than a unique value. The turbines currently used in practice (under operation) are variable speed machines. Fig. 13.3 shows the 1P and 3P bands for typical OWTs ranging from 2 MW (not in production anymore) turbines to commercially not yet available 8 MW turbines. It may be observed from Fig. 13.3 that for most wind turbines, 1P and 3P excitation cover wide frequency bands. To avoid these ranges, the designer of the support structure has three options from the point of view of the stiffness of the tower and the foundation:
1. Soft–soft structures, whereby the natural frequency lies below the 1P frequency range. This design is typical for floating offshore platforms but are practically impossible to achieve for fixed (grounded) structures. Also, soft–soft fixed structures would likely be subject to high dynamic amplification of wave load response.
2. Soft–stiff structures, whereby the natural frequency lies above the 1P frequency and below 3P frequency range. This is the typical design choice for practical bottom fixed structures, such as monopile founded OWTs. All wind turbines in Fig. 13.3 are designed soft–stiff.
3. Stiff–stiff structures, whereby the natural frequency lies above the 3P range. Such designs are typically considered to have a massive support structure and therefore uneconomic.
It is quite clear from Fig. 13.3 that designing a soft–stiff system which avoids both the 1P and 3P frequency bands is challenging because of the tight tolerance of the target natural frequency. Indeed, some OWTs with a wide rotational speed range, such as the Areva M5000 5 MW in Fig. 13.3 with 0.075–0.25 Hz (4.5–14.8 rpm), do not even have a gap between 1P and 3P and they are overlapping. Modern wind turbines often feature a sophisticated pitch control system designed to leap frog the rotational frequency range that would cause resonance of the structure due to the corresponding 3P frequency. For example, if the rotational speed range is 5–13 rpm, equivalent to 0.083–0.216 Hz, then the 3P frequency band is 0.25–0.65 Hz. If the structural natural frequency is 0.35 Hz, then the pitch control may regulate the rotational speed such that the corresponding 3P frequency avoids ±10% of the structural natural frequency, i.e., the frequency band 0.315–0.385 Hz to comply with the DNV code [9]. This would result in a jump in the rotational speed from 6.3 to 7.7 rpm, avoiding operation between these values. Obviously, this is also not without cost, both in terms of initial cost, maintenance, and power production.
The second issue is the top head mass, i.e., the mass of the RNA (i.e., M2 in Fig. 13.2). With increasing capacity of the turbine, the mass of the RNA increases and the natural frequency will also decrease keeping other factors constant. Furthermore, the hub height is also higher due to longer blades (associated with heavier turbines) which increase the flexibility of the taller towers causing further reduction in the natural frequency. This trend can also be seen in Fig. 13.3, the target natural frequency of wind turbines (in soft–stiff design) with higher power output is typically lower. Fortunately, the large rotor diameter wind turbines also tend to have lower rotational speeds. This is because of the fact that for optimum power production, the tip speed ratios (ratio of the speed of the tip of the blades and the incoming wind speed) are maintained at a favorable value, also to avoid blade damage. Furthermore, the top head mass is dependent on the choice of drive (with or without gearbox). Direct drive wind turbines do not need gearboxes, and thus significant weight reduction can be achieved (theoretically). However, the weight reduction is not obvious because the power of an electric generator is proportional to its rotational speed.
13.3.1 Importance of Foundation Design
Designing foundations for OWTs are challenging as these are dynamically sensitive structures in the sense that natural frequencies of these structures are very close to the forcing frequencies of the wind, wave, and 1P (rotor frequency) and 2P/3P (blade shadowing frequency) loading. Typically, for the widely used soft–stiff design (target frequency of the overall wind turbine is between 1P and 2P/3P), the ratio of forcing frequency, ff, to natural frequency, fn, is very close to 1 and as a result is prone to dynamic amplification of responses such as deflection/rotation which may enhance the fatigue damage, thereby reducing the intended design life. Therefore, a designer apart from accurately predicting the natural frequency of the structure must also ensure that the overall natural frequency due to dynamic soil–structure interaction does not shift toward the forcing frequencies making the value of ![]() even closer to 1. Therefore, foundations are one of critical components of OWTs not only because of the overall stability of the structure but also due to financial viability of the project. Foundation selection plays an important role in the overall concept design for offshore wind farms as there are large financial implications attached to the choices made. The selection of foundation type and the design is a complex task, which strongly depends not only on the site characteristics (wind, wave, ground type), turbine type, but also on the maturity and track record of the design concepts. Fig. 13.4 shows different types of foundations either in use or proposed to be used. One of the main aims of a foundation is to transfer all the loads from the wind turbine structure to the ground safely and within the allowable deformations. Guided by Limit State Design philosophy, the design considerations are to satisfy the following:
even closer to 1. Therefore, foundations are one of critical components of OWTs not only because of the overall stability of the structure but also due to financial viability of the project. Foundation selection plays an important role in the overall concept design for offshore wind farms as there are large financial implications attached to the choices made. The selection of foundation type and the design is a complex task, which strongly depends not only on the site characteristics (wind, wave, ground type), turbine type, but also on the maturity and track record of the design concepts. Fig. 13.4 shows different types of foundations either in use or proposed to be used. One of the main aims of a foundation is to transfer all the loads from the wind turbine structure to the ground safely and within the allowable deformations. Guided by Limit State Design philosophy, the design considerations are to satisfy the following:
1. Ultimate limit state (ULS): The first step in design is to estimate the maximum loads on the foundations (predominantly overturning moment, lateral load, and the vertical load) due to all possible design load cases and compare with the capacity of the chosen foundation. For monopile type of foundations, this would require computation of ultimate moment, lateral and axial load-carrying capacity. Therefore, inevitably, ULS design consideration will provide the minimum dimension (length and diameter) of the monopile and also the wall thickness required. The input required for such calculations are site characteristics (e.g., wind and wave data) and turbine data. At some sites, some other loads (e.g., ice load or earthquake loads) may need to be considered. Particularly, in Chinese waters, the loads from extreme events such as typhoon may govern.
2. Target natural frequency (Eigen frequency) and serviceability limit state (SLS): This requires the prediction of the natural frequency of the whole system (Eigen frequency) and the deformation of the foundation at the mudline level (which can be further extrapolated to the hub level) over the lifetime of the wind turbine. As natural frequency is concerned with very small amplitude vibrations (linear Eigen value analysis will suffice), the deformation of the foundation will be small and prediction of initial foundation stiffness would suffice for this purpose. Therefore, the second major calculation is the determination of stiffness of the foundation. Closed form solution to obtain the foundation stiffness for rigid monopiles as well as flexible monopiles are developed by Shadlou and Bhattacharya [10] and used by Arany et al. [11] for simplified design of monopiles. These foundation stiffness values can be used to estimate the deformation (pile head rotation and displacement) in the linear range and natural frequency of the whole system.
3. Fatigue limit state (FLS) and long-term deformation: This would require predicting the fatigue life of the monopile as well as the effects of long-term cyclic loading on the foundation.
4. Robustness and ease of installation: This step will ascertain that the foundation can be installed and that there is adequate redundancy in the system [12].
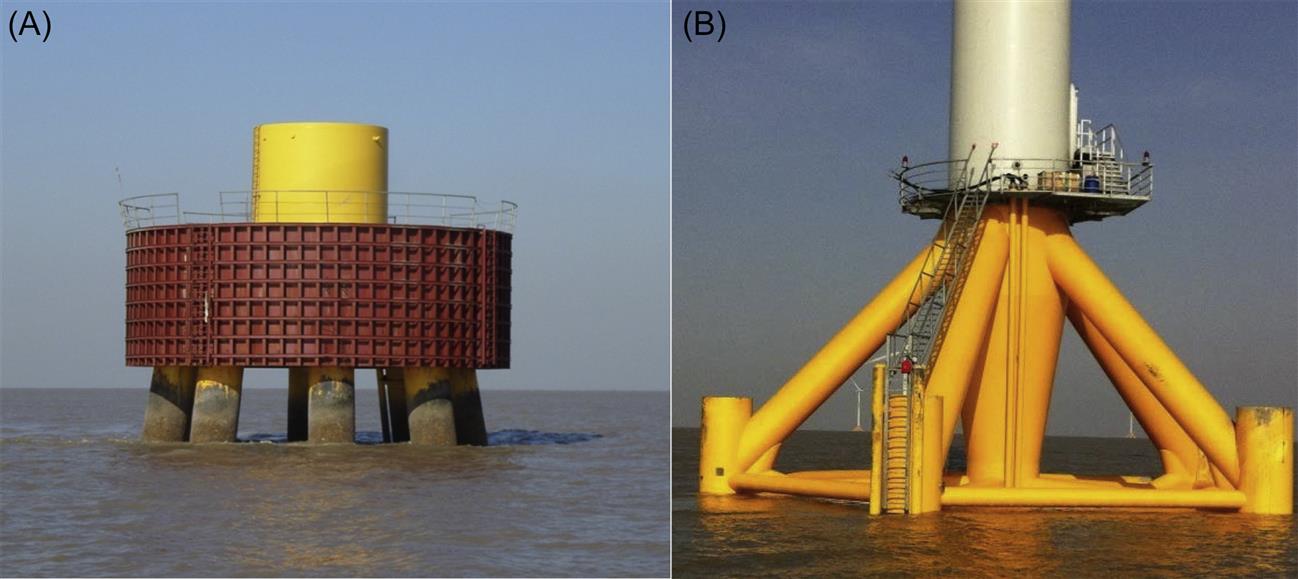
Typically, foundations cost between 25% and 34% of the overall cost. For the North Hoyle project in the United Kingdom, the cost of foundation was 34% [13], and it has been reported that the development of Atlantic Array wind farm did not go ahead and one of the main reasons was the expense of the foundation. Foundations for wind turbines can be classified into two main types: fixed (or grounded to the seabed) and floating. While most of the currently installed or operating turbines are supported on fixed/grounded foundation system, research and development of floating foundations are under way. Fig. 13.4 shows the different types of grounded system (fixed to the seabed foundation system) either in use or proposed and will constitute the main part of this chapter.
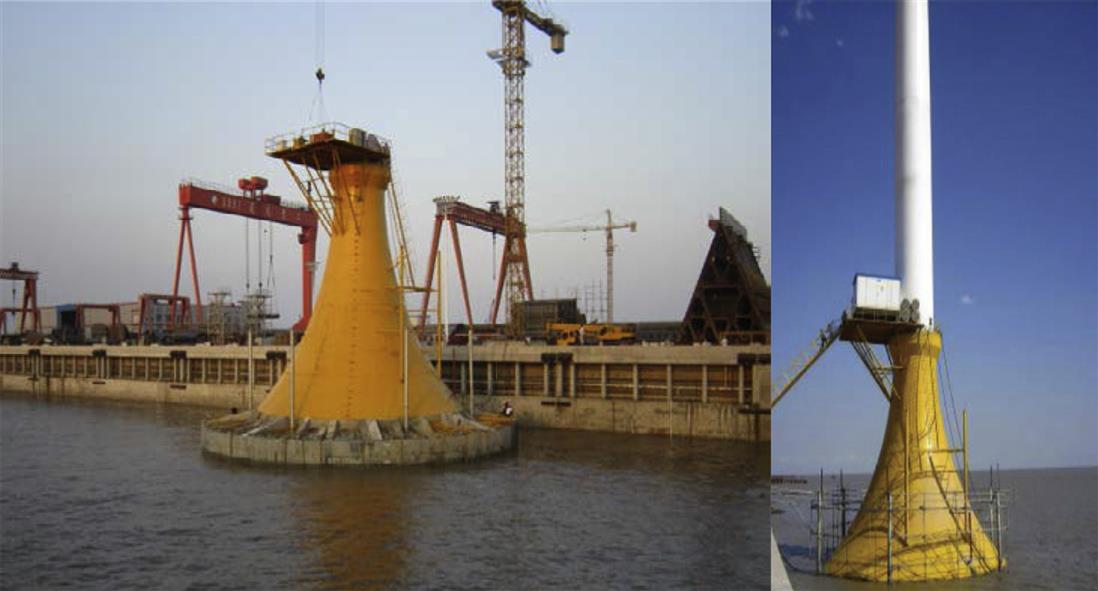
Compared to the design of OWTs in North Sea, additional challenges are posed on wind turbine design in China, due to the presence of the unfavorable yet widely distributed soft clayey seabed in the Chinese waters. It is well recognized that soft clays (frequently encountered in Chinese waters) are much more susceptible to stiffness degradation [14], than stiff clay and dense sand (typically founded in North Sea, see Table 13.3), at a given undrained cyclic loading. In other words, natural frequencies of wind turbine structures in Chinese water is more likely to be altered by the environmental loadings than those of the turbines in North Sea, causing the former to be more sensitive to dynamics. Figs. 13.5–13.7 show fixed foundations used in Chinese waters and Fig. 13.8 shows the method of installation.

13.4 Types and Nature of the Loads Acting on the Foundations
13.4.1 Loads Acting on the Foundations
The loads acting on the wind turbine tower are ultimately transferred to the foundation and can be classified into two types: static or dead load due to the self-weight of the components and the dynamic loads (or in some instances this can be cyclic). However, the challenging part is the dynamic loads acting on the wind turbine and is discussed as follows:
1. The lateral load acting at the hub level (top of the tower) from the rotating blades produced by the turbulence in the wind. The magnitude of dynamic component depends on the turbulent wind speed.
2. The load caused by waves crashing against the substructure very close to the foundation. The magnitude of this load depends on the wave height and wave period;
3. The load caused by the vibration at the hub level due to the mass and aerodynamic imbalances of the rotor. This load has a frequency equal to the rotational frequency of the rotor (referred to as 1P loading, as defined in Section 13.2). Since most of the industrial wind turbines are variable speed machines, 1P is not a single frequency but a frequency band between the frequencies associated with the lowest and the highest rpm (revolutions per minute).
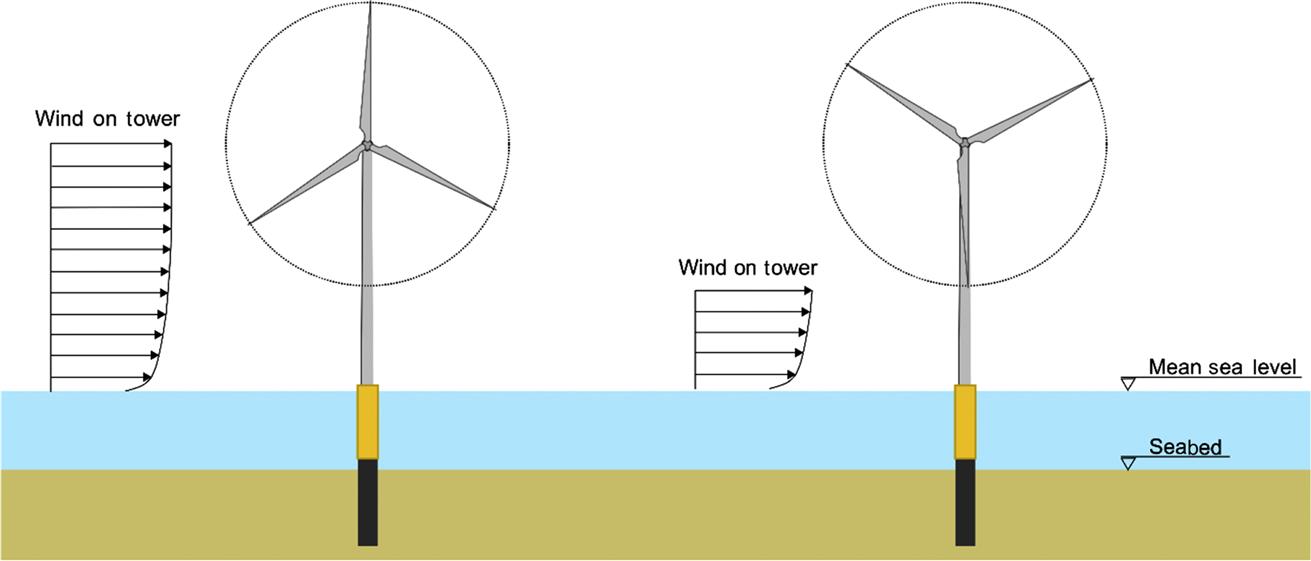
4. Loads in the tower due to the vibrations caused by blade shadowing effects (referred to as 2P/3P, as defined in Section 13.2). The blades of the wind turbine passing in front of the tower cause a shadowing effect and produce a loss of wind load on the tower, as shown in Fig. 13.9. This is a dynamic load having a frequency equal to three times (3P) the rotational frequency of the turbine for three-bladed wind turbines and two times (2P) the rotational frequency of the turbine for a two-bladed turbine. The 2P/3P loading is also a frequency band like 1P and is simply obtained by multiplying the limits of the 1P band by the number of the turbine blades.
The turbulent wind velocity and the wave height on sea are both variables and are best treated statistically using PSD functions. In other words, instead of time domain analysis, the produced loads are more effectively analyzed in the frequency domain whereby the contribution of each frequency to the total power in wind turbulence and in ocean waves is described. Representative wave and wind (turbulence) spectra can be constructed by a discrete Fourier transform from site-specific data. However, in absence of such data, theoretical spectra can be used. The DNV standard specifies the Kaimal spectrum for wind and the JONSWAP (Joint North Sea Wave Project) spectrum for waves in OWT applications.
It is clear from the above discussion that designing soft–stiff wind turbine systems demands the consideration of dynamic amplification and also any potential change in system frequency due to the effects of cyclic/dynamic loading on the system, i.e., dynamic–structure–foundation–soil interaction. Typically, the first modal frequency of the wind turbine system lies in the range of 75%–120% of the excitation frequencies (see Fig. 13.3) and as a result, dynamic amplifications of responses are expected.
Clearly, for soft–stiff design, any change in natural frequency over the design/operation period of the turbine will enhance the dynamic amplifications which will increase the vibration amplitudes and thus the stresses and fatigue damage on the structure. Therefore, fatigue is one of the main design drivers for these structures. Predicting fatigue damage is undoubtedly a formidable task due to complexity associated with the uncertainty in the dynamic amplification (owing to changes in system characteristics over time and number of cycles), randomness of the environmental loading and last but not the least, the impact of climate change.
13.4.2 Extreme Wind and Wave Loading Condition in Chinese Waters
Typhoons, which can lead to failure or even collapse of wind turbines, hit the region of East and South China Sea almost every year, but rarely occur in the North Sea. Typhoons can have a negative effect on wind turbine system ranging from fracture of blades, damage to braking system, and yielding of tower and even excessive rotation foundation. However, the direct effect of a typhoon is loss of power supply and emergently shut down which may damage the weakest part (e.g., blade and nacelle). It is therefore necessary to understand the wind condition in the Chinese waters and this section provides a brief summary.
Bohai Sea: The total area of Bohai Sea in China is approximately 77 284 km2 and is classified into four parts: west, middle, Jinzhou, and Suizhong. Bohai Sea is the only inner sea region of China and is a shallow sea with average water depth of about 18 m. In winter, due to the flow of cold air from Siberia, the average wind speed is about 6–7 m s−1. On the other hand, in summer, due to warm airflow from Western Pacific Ocean, the average wind speed is 4–5 m s−1. In August, the wind speed is quite low. In this sea, wind farms are located in Jinzhou and the predominant wind directions for high wind speeds are southeast and southwest with mean annual wind speed of 7.21 m s−1 (100 m height over sea level). Typhoons and cyclones are not normal in the Bohai Sea and the wind condition is stable throughout the year. The Bohai Sea has a cold climate and in the winter period, the onshore near coastline is almost frozen for 3–4 months.
Yellow sea: The total area of Yellow Sea is 380 000 km2 and comprises Shandong, Jiangsu, and Korean Peninsula. There are many offshore wind farms built along the coastline in Yellow Sea from north to south. In winter, the wind is stable but in summer it varies in both magnitude and direction. Typhoons are very frequent in summer throughout the Shanghai area, which is located in the south of the Yellow Sea. The annual average wind speed in the north of the Yellow Sea is 6.80–6.88 m s−1 but in the south, the value is larger and the average value is 7.45–7.55 m s−1.
East China Sea: The total area of East China Sea is 770 000 km2 and is comprised of the continent coastline of Japan and Taiwan. There are many offshore wind farm projects located in Hangzhou Bay. The annual mean wind speed tested at 100 m in height over sea level is generally around 9.6–9.8 m s−1 at the exit of Hangzhou Bay. However, in terms of frequent typhoon phenomena in summer from May to September each year, wind speed remains unstable and the amplitudes are quite large, even greater than 14 m s−1. The cyclone effect is very important and governs the design of an OWT.
Taiwan Strait: Taiwan Strait is one part of East China Sea, connected with South China Sea in the south of China. In summer, it is common to see strong winds (e.g., typhoons) which damage the cities and structures along the coastline. Usually typhoons in summer time will come from southeast and the wind speed is quite high. The annual wind speed in Taiwan Strait is about 11.5–13 m s−1 and is even higher when a typhoon appears (20 m s−1 or more). Each year, typhoons are responsible for serious damage to the economy and to structure in Taiwan and in particular to Fujian and Zhejiang, located on the two sides of Taiwan Strait.
South China Sea: The total area of South China Sea is about 3 500 000 km2. It is surrounded by the continent of South China mostly, northeast to Taiwan Strait, southwest to Singapore Strait. Most of the wind projects are newly built or under construction. It is also common to see strong wind (e.g., typhoon) and high rainwater during each summer. The annual mean wind speed in South China Sea is 9–11 m s−1. When typhoon comes, the wind speed is usually over 17 m s−1 (at 100 m in height). Table 13.4 summarizes the wind condition in the Chinese waters.
Table 13.4
Wind Condition Summary in China Seas
| Sea Name | Wind Speed Range/m s−1 | Mean Wind Speed/m s−1 |
| Bohai Sea | 6.4–8.2 | 7.45 |
| Yellow Sea (north) | 6.8–7.5 | 6.86 |
| Yellow Sea (south) | 7.0–8.2 | 7.48 |
| East China Sea | 7–11 | 9.68 |
| Taiwan Strait | 11.5–13 | 12.04 |
| South China Sea | 8.8–9.8 | 9.18 |
13.4.2.1 Case Study: Typhoon Related Damage to Wind Turbines in China
Zhejiang Province, located on the west of East China Sea, experienced 23 typhoons since 1997 (the starting year of wind farming projects), causing hundreds of millions of dollars of economic loss. It is of interest to discuss the effects of August 10, 2006, Typhoon “Saomai” which had wind speeds of 68 m s−1 that devastated many wind farms. This is the most powerful typhoon to hit China over the past 50 years; it killed 104 people and left at least 190 missing. Furthermore, it blacked out cities and destroyed over 50 000 houses in the southeast part of the country. Fig. 13.10 show the Hedingshan wind farm in Zhejiang province (before the cyclone) along with the aerial photograph of the typhoon. The typhoon destroyed 28 wind turbine structures and blades which included five collapsed towers (600 kW turbines) with a total loss of about 70 million RMB (Figs. 13.11–13.13).


13.4.2.1.1 Wave Condition
Bohai Sea, Yellow Sea, East and South China Sea are connected to each other, in a bow shape from north to south along the China coastline. Tropical and subtropical monsoon climate also influences the wave height in China Sea. Thus, in Chinese offshore wind farm projects, sea waves are a major influence in the design. The wave height distribution in South China Sea is variable owing to the large sea area. High wave height occur in the northeast of South China Sea and in the southeast of the Indo–China Peninsula, with wave heights of 2.4–2.6 m. The maximum significant wave height is however larger than 2.8 m in the west of the Luzon Strait. Comparatively, the significant wave height in the north is less than 2 m. Wave period ranges from 6 to 10 seconds. Table 13.5 provides the distribution of wave height and period for the Chinese waters.
Table 13.5
Wave Height and Period in the Chinese Waters
| China Sea | Region | Wave Height/m | Wave Period/s |
| Bohai Sea | Bohai Strait | 1.2 | 4.8 |
| Others | <1 | <4.5 | |
| Yellow Sea | North | 1.2 | 5 |
| Center | 1.4 | 5 | |
| South | 1.6 | 6 | |
| East China Sea | Shanghai coastline | 1.6 | 6 |
| Zhejiang coastline | 1.8 | 7 | |
| Taiwan Strait | 2.4 | 9 | |
| South China Sea | Luzon Strait | 2.8 | 10 |
| Indo–China Peninsula | 2.6 | 8 | |
| Others | <2 | 6 |

13.5 Ground Conditions in Chinese Waters
Ground condition is fundamental in designing wind turbine foundations. There are many elements that should be considered: The depth of seawater, salinity content in ocean, and ground stiffness variation with depth. Generally, the ground condition in China Seas is not as stiff as that in North Europe. A summary of the ground conditions is given in the following sections.
13.5.1 Bohai Sea
Bohai Sea is a low-lying land settled by North China Plain, where the soil consists of sediments brought from mountains and Yellow River and is soft silty clay or clayey silt. The drilling of a borehole is the usual method used for underground geology surveys. There are many records of boreholes in Bohai Sea and a typical profile (from top to bottom) is as follows:
1. Soft clay silt (Layer 1): The depth of this layer varies and typically 0–7.4 m in the Western Bohai.
2. Mucky clay to silty clay (Layer 2): In this layer, the clay is changing from soft to stiff, with materials of mucky clay, silt, and loose sand. The depth of clay layer varies (thickness 2.5–9.0 m in Western Bohai), center Bohai (thickness 4.0–10.0 m), Jinzhou (thickness 2.7–14.8 m), and Suizhong (thickness 0.8–5.8 m).
3. Combination of silty clay, clay, and loose sand (Layer 3): Again the thickness of this layer varies: 2.5–7.0 m in Western Bohai.
4. Fine sand and silt: In this layer, the main material is fine sand, combined with silty sand and clay. The stiffness is that of medium dense sand. The thickness in the western Bohai Sea is 4.0–15.0 m, in the center of Bohai it is 4.0–13.0 m, in Jinzhou it is 3.0–15.0 m and in Suizhong it is 0–14.2 m.
5. Clay: In this layer, the clay is quite stiff and hard, combined with some silty clay. The thickness in western Bohai is 2.0–18.0 m, in the center of Bohai it is 3.0–15.0 m, in Jinzhou it is 3.0–17.0 m, and in Suizhong it is 0–15.0 m.
6. Fine sand and silt: In this layer, the main material is fine sand, combined with silty clay where the layer is thin. The stiffness is quite dense. The thickness in western Bohai is 5.0–11.0 m, in the center of Bohai it is 6.0–15.0 m, in Jinzhou it is 7.0–15.0 m, and in Suizhong it is 12.0–18.0 m.
A typical ground profile for Bohai Sea is shown in Fig. 13.14 and it is clear that the ground is variable. On the other hand, Figs. 13.15 and 13.16 show ground profiles for Yellow Sea and Fujian Sea, respectively. It is evident that the ground profiles are variable which calls for detailed site investigation to minimize risks during construction. Multilayering soft marine sediments are also widely formed in the regions in and adjacent to East China Sea [15,16]. A typical ground profile in East China Sea is illustrated in Fig. 13.17.
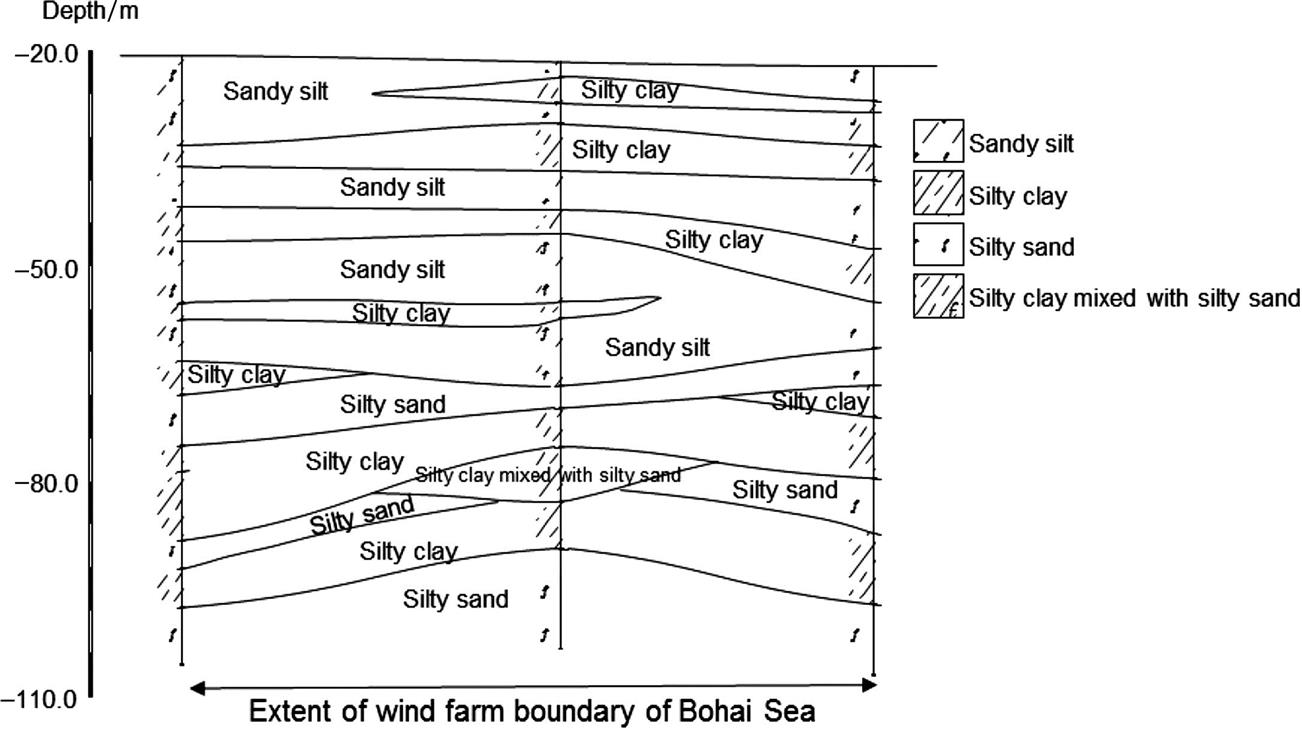


Table 13.6 provides the multilayered ground profile in South China Sea. A general observation can be made that the ground profile in Chinese waters is variable and it shows the importance of a comprehensive site investigation.
Table 13.6
A Typical Ground Profile in South China Sea
| Position No. | Depth/m | Soil |
| 1 | 0–4.2 | Silty clay |
| 4.2–19.4 | Laminated soil | |
| 19.4–40.0 | Silty clay | |
| 2 | 0–3.0 | Sandy soil |
| 3.0–7.4 | Silty clay | |
| 7.4–27.0 | Laminated soil | |
| 27.0–35.3 | Silty clay | |
| 3 | 0–1.9 | Silty clay |
| 1.9–2.6 | Silty sand | |
| 2.6–5.5 | Silty clay | |
| 5.5–9.0 | Sandy soil | |
| 9.0–15.0 | Laminated soil | |
| 15.0–39.8 | Silty clay | |
| 4 | 0–1.5 | Sandy soil |
| 1.5–4.9 | Silty clay | |
| 4.9–7.0 | Silty sand | |
| 7.0–13.7 | Laminated soil | |
| 13.7–25.4 | Silty clay | |
| 25.4–40.6 | Sandy soil |
13.5.2 Seismic Effects
Fig. 13.18 shows the map of China, which includes three major earthquake locations. It is of interest to note that the location of the earthquakes of February 4, 1965, Haicheng and July 28, 1976, Tangshan were close to the Bohai Sea. The effect of an earthquake on a wind turbine structure can be summarized as follows:
1. Loose to medium dense sandy soil around the foundation may liquefy which will affect the behavior of the foundation. In the case of monopile foundation not having sufficient embedment in nonliquefiable soil beneath the liquefiable soil, there may be settlement which may cause tilting or in extreme situation a bearing failure. The time period of the wind turbine structure will increase owing to liquefaction and the structure will shift away from the predominant frequency of the earthquake causing higher displacement at the nacelle level.
2. Clay soils may soften depending on the layering/ground profile and the earthquake type. It may either attenuate or amplify the motion experienced by the structure.
3. Behavior of intermediate soils, i.e., sandy silt or silty sand, or silty clay under seismic loading is difficult to predict and advanced element tests and characterization are required. Cyclic triaxial tests can be carried out to assess the liquefaction potential of the soils.

13.6 A Note on SLS Design Criteria
Serviceability criteria will be defined based on the tolerance requirements for the operation of the wind turbine and is often described as “turbine manufacturer requirements.” Ideally, these should be turbine specific, i.e., size and the hub height, gear boxed, or direct drive. Typically, these tolerances are specified in some codes of practice (e.g., DNV) or a design specification supplied by the client which may be dictated by the turbine manufacturer. Some of the specific requirements are:
1. Maximum allowable rotation at pile head after installation. DNV code specifies 0.25 degree limit on “tilt” at the nacelle level.
2. Maximum accumulated permanent rotation resulting from cyclic and dynamic loading over the design life.
An example of a method to predict the required foundation stiffness.
For a wind farm, it has been estimated that the maximum moment at the mudline level is 125 MN m and if the allowable tilt is 0.25 degree at the foundation level, one can therefore estimate the rotational foundation stiffness required as given in Eq. (13.1):
(13.1)
This is a very large number and would require a large diameter monopile or equally alternative multiple pod foundations. In this context it may be mentioned that SLS criteria impact the foundation design and thereby costs. It has been reported that floating wind turbines are allowed to tilt by up to ±5 degrees in the worst sea states. Therefore, it is necessary to understand the stringent criteria of 0.25 degrees for grounded wind turbine system. A value of 0.25 degree represents a horizontal deflection of 349 mm for a typical 80 m tower. Clearly, a less stringent tilt criterion will save on the foundation costs and installation time and make wind energy cheaper.
13.7 Challenges in Analysis of Dynamic Soil–Structure Interaction
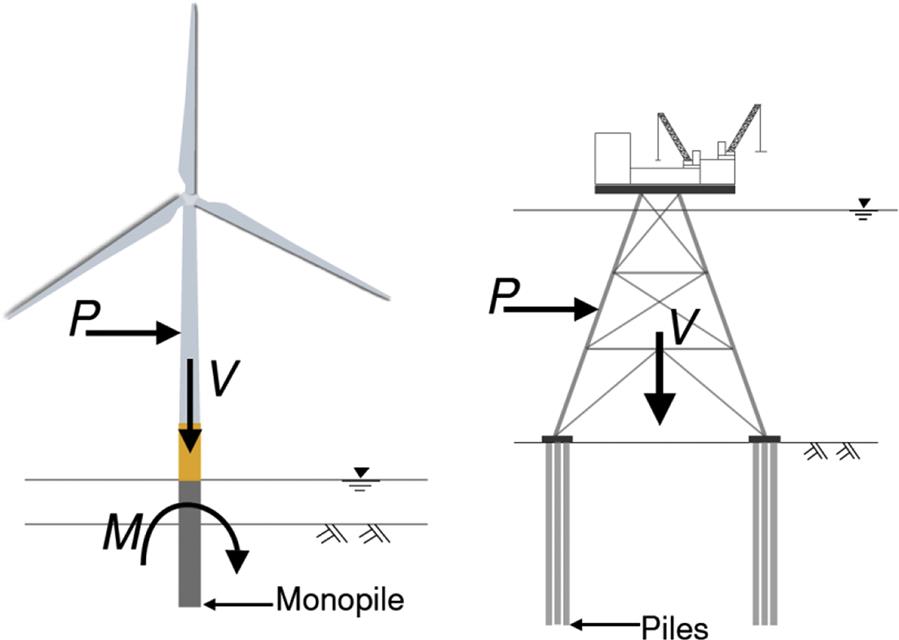
OWT are new types of offshore structures and are unique in their features. The most important difference with respect to oil and gas installation structures is that they are dynamically sensitive (as explained in Section 13.2) and moment resisting. Fig. 13.19 shows a typical monopile supported wind turbine and a pile supported fixed offshore jacket structure. There are, however, obvious differences between those two types of foundations. Piles for offshore structures (such as oil and gas platform) are typically 60–110 m long and 1.8–2.7 m in diameter and monopiles for OWTs are commonly 30–40 m long and 3.5–6 m in diameter. Degradation in the upper soil layers resulting from cyclic loading is less severe for offshore oil and gas platform piles which are significantly restrained from pile head rotation, whereas monopiles are free-headed. The commonly used design method using a beam on nonlinear Winkler springs (“p–y” method in API code or DNV code) may be used to obtain pile head deflection under cyclic loading, but its use is limited for wind turbines because of the following:
1. The widely used API model is calibrated against response to a small number of cycles (maximum 200 cycles) of flexible piles for offshore fixed platform applications. In contrast, for a real OWT 107–108 cycles of loading are expected for the rigid piles over a lifetime of 20–25 years.
2. Under cyclic loading, the API or DNV model always predicts degradation of foundation stiffness in sandy soil. However, recent work by Bhattacharya and Adhikari [17], Cuéllar et al. [18], and Leblanc [19] suggested that the foundation stiffness for a monopile in sandy soil will actually increase as a result of densification of the soil next to the pile.
3. The ratio of horizontal load (P) to vertical load (V) is very high in OWTs when compared with fixed jacket structures.
While OWT structures are designed for an intended life of 25–30 years, little is known about their long-term dynamic behavior under millions of cycles of loading. While it is possible to monitor existing OWT installations at a reasonable cost, full-scale testing is very expensive. An alternative method is to carry out a carefully planned scaled dynamic testing to understand the scaling/similitude relationships which can be later used for interpretation of the experimental data and also for scaling up the results to real prototypes. There are mainly two approaches to scale up the model test results to prototype consequences: first is to use standard tables for scaling and multiply the model observations by the scale factor to predict the prototype response and the alternative is to study the underlying mechanics/physics of the problem based on the model tests recognizing that not all the interaction can be scaled accurately in a particular test. Once the mechanics/physics of the problem is understood, the prototype response can be predicted through analytical and/or numerical modeling in which the physics/mechanics discovered will be implemented in a suitable way. The second approach is particularly useful to study the dynamics of OWTs as it involves complex dynamic wind–wave–foundation–structure interaction and none of the physical modeling techniques can simultaneously satisfy all the interactions to the appropriate scale. Ideally, a wind tunnel combined with a wave tank on a geotechnical centrifuge would serve the purpose but this is unfortunately not feasible. It is recognized that not all physical mechanisms can be modeled adequately and therefore those need special consideration while interpreting the test results. As dynamic soil–structure interactions of wind turbines are being studied, stiffness of the system is a top priority. Bhattacharya et al. [4,5,20] carried out experimental testing of a 1:100 scaled wind turbine to characterize the free dynamics of the system and to study the long-term behavior under the action of the dynamic loading.
The following conclusions could be reached from the study:
1. The change in natural frequencies of the wind turbine system may be affected by the choice of foundation system, i.e., deep foundation or multiple pods (symmetric or asymmetric) on shallow foundations. Deep foundations such as monopiles will exhibit sway-bending mode, i.e., the first two vibration modes are widely spaced—typical ratio is 4.5. However, multiple pod foundations supported on shallow foundations (such as tetrapod or tripod on suction caisson) will exhibit rocking modes in two principle planes (which are of course orthogonal). Fig. 13.20 shows the dynamic response of monopile supported wind turbine and tetrapod foundation plotted in the loading spectrum diagram.
2. The natural frequencies of wind turbine systems change with repeated cyclic/dynamic loading. In the case of strain-hardening site (such as loose to medium dense sandy site), the natural frequency is expected to increase and for strain-softening site (such as normally consolidated clay [21–23]) the natural frequency will decrease.
3. The results showed that the multipod foundations (symmetric or asymmetric) exhibit two closely spaced natural frequencies corresponding to the rocking modes of vibration in two principle axes. Furthermore, the corresponding two spectral peaks change with repeated cycles of loading and they converge for symmetric tetrapods but not for asymmetric tripods. From the fatigue design point of view, the two spectral peaks for multipod foundations broaden the range of frequencies that can be excited by the broadband nature of the environmental loading (wind and wave) thereby impacting the extent of motions. Thus the system life span (number of cycles to failure) may effectively increase for symmetric foundations as the two peaks will tend to converge. However, for asymmetric foundations, the system life may continue to be affected adversely as the two peaks will not converge. In this sense, designers should prefer symmetric foundations to asymmetric foundations.
13.8 Foundation Design
While design guidelines are available for offshore oil and gas installation foundations, its direct extrapolation/interpolation to OWT foundation design is not always possible, the reasons of which is explored in the earlier section. There are two reasons: (1) The foundations of these structures are moment resisting, i.e., large overturning moments at the foundation which are disproportionately higher than the vertical load. (2) The structure is dynamically sensitive and therefore fatigue is a design driver. This section therefore explores a simplified foundation design methodology which may be used during option engineering or preliminary design for foundations supporting OWTs.
1. Compute the maximum mudline bending moment considering the different load combinations. The overturning moments due to 1P (misalignment) and 3P (blade shadowing) may be neglected in this step.
2. Based on the allowable tilt criteria for the particular project, determine the foundation stiffness required as discussed in Section 13.6. This is the minimum stiffness that is required to satisfy the SLS.
3. It is then required to check the ULS criteria, i.e., the foundation capacity. If the foundation is not adequate, the size must be increased.
4. The soil surrounding the foundations will be subjected to tens of millions of cycles of cyclic and dynamic loading of varying strain as well as varying frequency. It must be ensured that the soil remains in the linear elastic range so as not to alter the dynamic stiffness of the foundation. For detailed design, resonant column testing is recommended to find the threshold strains of the ground. Further details on the use of the threshold strain concept in monopile design can be found in the work by Lombardi et al. [24].
5. Beam on nonlinear Winkler model or finite element analysis can be carried out and it must be ensured that the p–y curves in soil are within the linear elastic section at all depths. However, 3D finite element analyses are recommended to understand the strains around the foundation.
6. It is now required to obtain stiffness of the foundation to calculate natural frequency of the whole system to check where the overall system is placed: soft–soft, soft–stiff, or stiff–stiff (see Fig. 13.3). If the natural frequency is not acceptable, the design parameters such as foundation stiffness, tower stiffness, and mass may be altered so that the desired frequency is obtained. This is an iterative process.
7. The foundation stiffness may change over the lifetime of the wind turbine due to soil–structure interaction which will have an impact on the natural frequency of the system and tilt. If the ground is sandy site, the natural frequency to be expected to increase and if it is a clay site, the natural frequency may decrease. If the site is layered (as often encountered in Chinese waters, see Figs. 13.14–13.17), the change in natural frequency cannot be ascertained a priory and depends on various factors including the geometry of layering. Engineers need to carry out calculations to predict the change in frequency which is also necessary to compute the fatigue loading.
13.8.1 Challenges in Monopile Foundation Design and Installation
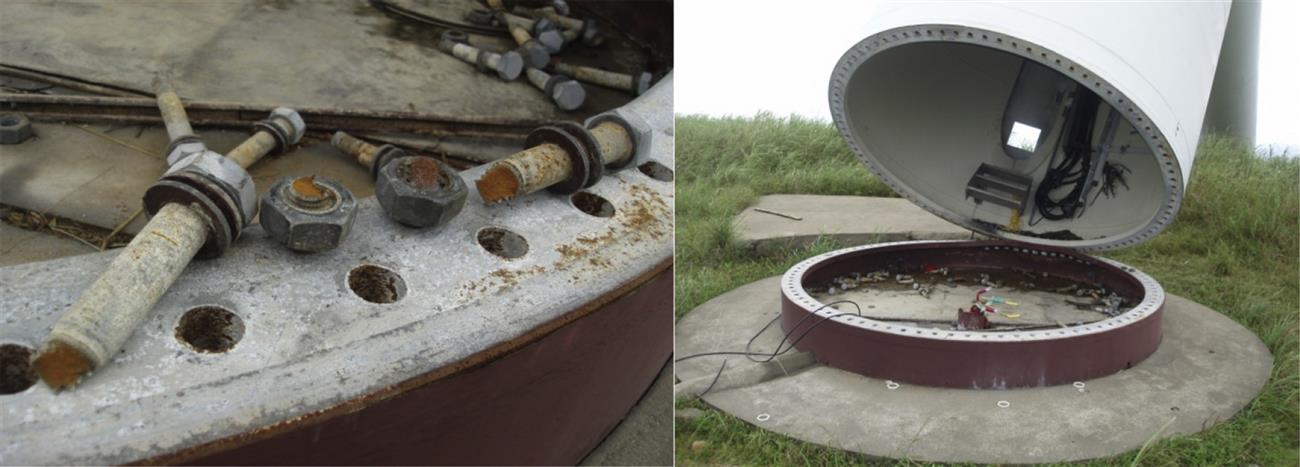
Monopiles have been predominantly used to support wind turbine generators (WTGs) in water depths up to 30 m. However, there are discussions with regard to the use of monopiles in deeper water depths termed as “XL” monopile. Preliminary calculations suggest that 10 m diameter monopiles weighing 1200 t (where t refers to metric tonnes) may be suitable for 45 m water depth and of course dependent on ground conditions. However, the use is uncertain due to the following: (1) no codified cyclic design to predict long-term tilt; (2) lack of redundancy in foundation system and therefore chance of single-point failure; (3) installation costs and lack of adequate specialized vessels; (4) connection between foundation, transition piece, and the tower. Some of these aspects are described in further detail as follows:
1. Lack of redundancy: Monopiles are “overturning moment” resisting structures and there are two main components: (1) overturning moment arising from the thrust acting at the hub level; (2) overturning moment due to the wave loading. Also these two moments can act in two different planes and will vary constantly depending on the time of the day and time of the year. Monopiles are rigid piles and the foundation collapse can occur if the soil around the pile fails, i.e., there would be rigid body movement. If the foundation starts to tilt, it is very expensive to rectify.
2. Cyclic (rather dynamic) design of monopile: The response of monopile under cyclic/dynamic load is not well understood and there is lack of guidance in codes of practice. If cyclic design is incorrect, monopile can tilt in the long term. If the tilt is more than the allowable limit, the turbine may need a shutdown. Monopile design is usually (also wrongly) carried out using API design procedure calibrated for flexible pile design where the pile is expected to fail by plastic hinge [25].
3. Issues related to installation of monopiles: Large monopile installation requires suitable vessel availability as well as specialized heavy lifting equipment. Other issues are noise refusals, buckling of the pile tip, drilling out, grouted connections. If the site contains weak rock (siltstone/sandstone/mudstone) and where the local geology shows bedrock or hard glacial soils at shallow depths, drive–drill–drive techniques may be required, with subsequent increases in cost and schedule. It must be mentioned here that driving reduces the fatigue life.
13.8.2 Jacket on Flexible Piles
There has been a considerable interest in jacket-type structures for deeper water applications but is perceived to being expensive due to the amount of steel required. However, jackets supported on piles can be considered as a safe solution due to excellent track record of good performance in offshore oil and gas industry. Offshore oil and gas industries have been using long flexible piles (diameters up to 2.4 m) which are easy to drive and the necessary vessels are available (relatively as opposed to vessels to install monopiles). This aspect will drive down the TIC (time in construction) costs regarding piling and also large vessels are not required for pile installation. However, there are costs associated with jacket installation. One of the requirements is the optimization of the jacket so as to consume minimum steel. There are two types of jacket—normal jacket and twisted jacket. The advantage of twisted jacket over normal jacket is fewer numbers of joints and therefore less fatigue issues.
13.9 Concluding Remarks
OWTs are new types of offshore structure characterized by low stiffness (as a result flexible and having low natural frequency) and therefore sensitive to the dynamic loadings. Additional challenges are imposed on OWTs in China over and above those in North Sea, as the turbines in China are subjected to much harsher environmental loadings (particular typhoon and earthquake) and are founded on softer and more complex multilayering seabed. This chapter discusses the complexity involved in designing the foundation of these structures. It has been shown that design guidelines available for offshore oil and gas installation foundations cannot be direct extrapolated/interpolated to OWT foundation design. It is also highlighted that any extrapolation from the design experiences for wind turbine foundations in North Sea to those in China should be treated with great caution.