
Life Cycle Assessment
Meta-analysis of Cumulative Energy Demand for Wind Energy Technologies
Michael Carbajales-Dale, Clemson University, Anderson, SC, United States Email: [email protected]
Abstract
Global installed capacity of renewable energy technologies and especially wind energy is growing rapidly. The ability of these technologies to enable a rapid transition to a low-carbon energy system is highly dependent on the energy that must be used over their life cycle; materials extraction and processing, component manufacture and installation, operation, and end-of-life. This chapter presents the results of a meta-analyses of life-cycle assessments (LCA) of energy use by wind turbines. The chapter presents these findings as energetic analogies with financial cost parameters for assessing energy technologies.
Keywords
Life-cycle assessment; net energy analysis; cumulative energy demand; energy payback time; energy return on investment
21.1 Introduction
Technology assessment of energy production technologies is often computed in terms of financial cost. The US Department of Energy (DOE) and the National Renewable Energy Laboratory have been aggregating data on cost estimates for electricity generation in an online application: the Transparent Cost Database [1]. Two main metrics exist to assess the cost of, especially electricity generating, infrastructure investment: (1) Overnight capital cost—Combines all the capital cost data per unit of (peak) nameplate capacity without interest, as if built overnight [2], computed in $ (Wp)−1 (Units of nameplate capacity are presented with a subscript p to denote peak power.); (2) Levelized cost of electricity (LCOE)—Total costs (including annualized capital and yearly operating) divided by total energy service production [1], computed as $ (kW he)−1 (Electrical energy is denoted with subscript e, primary energy is denoted with a subscript p.).
This chapter will advance the benefits of computation of analogous metrics for energetic “costs” associated with electricity production by renewable energy technologies, such as cumulative energy demand (CED). The chapter then presents the results of a meta-analysis of CED during the various life-cycle stages of wind electricity production, in terms of capital energy cost (CEC)—equivalent to overnight capital cost (in Section 21.5.1), life-cycle energy cost (LCEC)—equivalent to LCOE (in Section 21.5.2). The CED is also assessed by major component of the wind energy system (in Section 21.5.4) and trends in the parameters are assessed (in Section 21.5.5) to determine if there are systematic reductions (e.g., due to learning) occurring within the wind industry. This information is then brought together in Section 21.5.6 where the net energy trajectory of the global wind industry is presented.
21.2 Wind Energy Technologies
Growth in installed capacity of wind has been rapid in the last decade with sustained growth rates of 20% during the period 2000–10. Global installed capacity of wind turbines, as depicted in Fig. 21.1, increased over 25-fold from 16 GW in 2000 to over 400 GW in 2015. Around 97% of wind deployment is currently on land, though deployment is increasingly occurring offshore, in increasingly deeper waters, to make use of stronger and more steady winds.
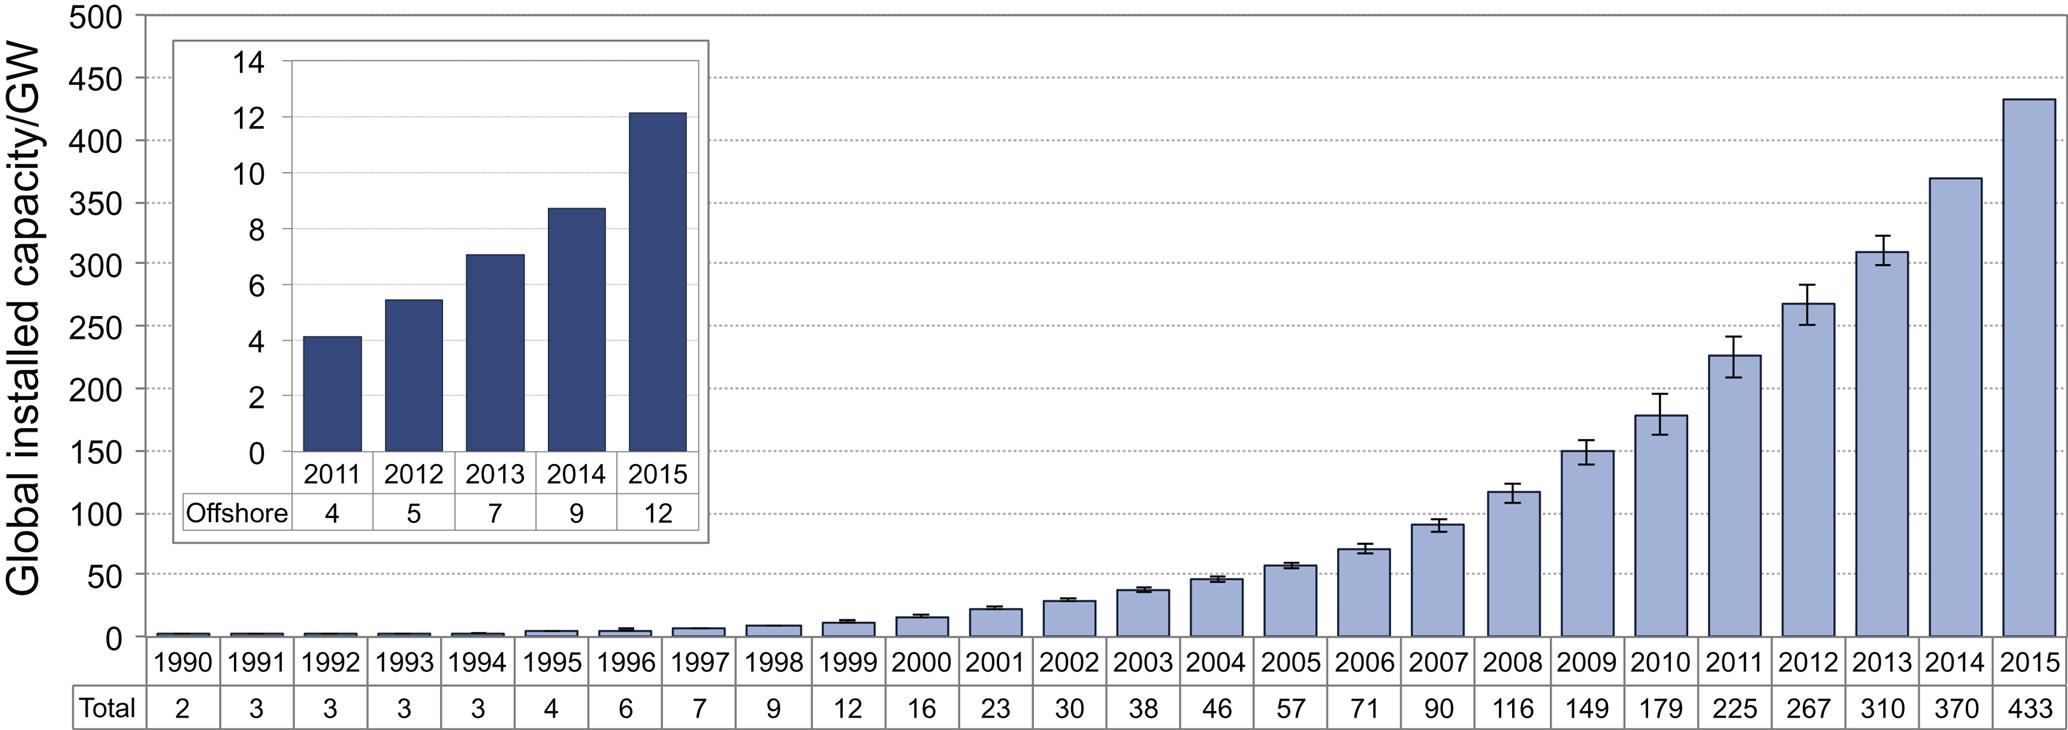
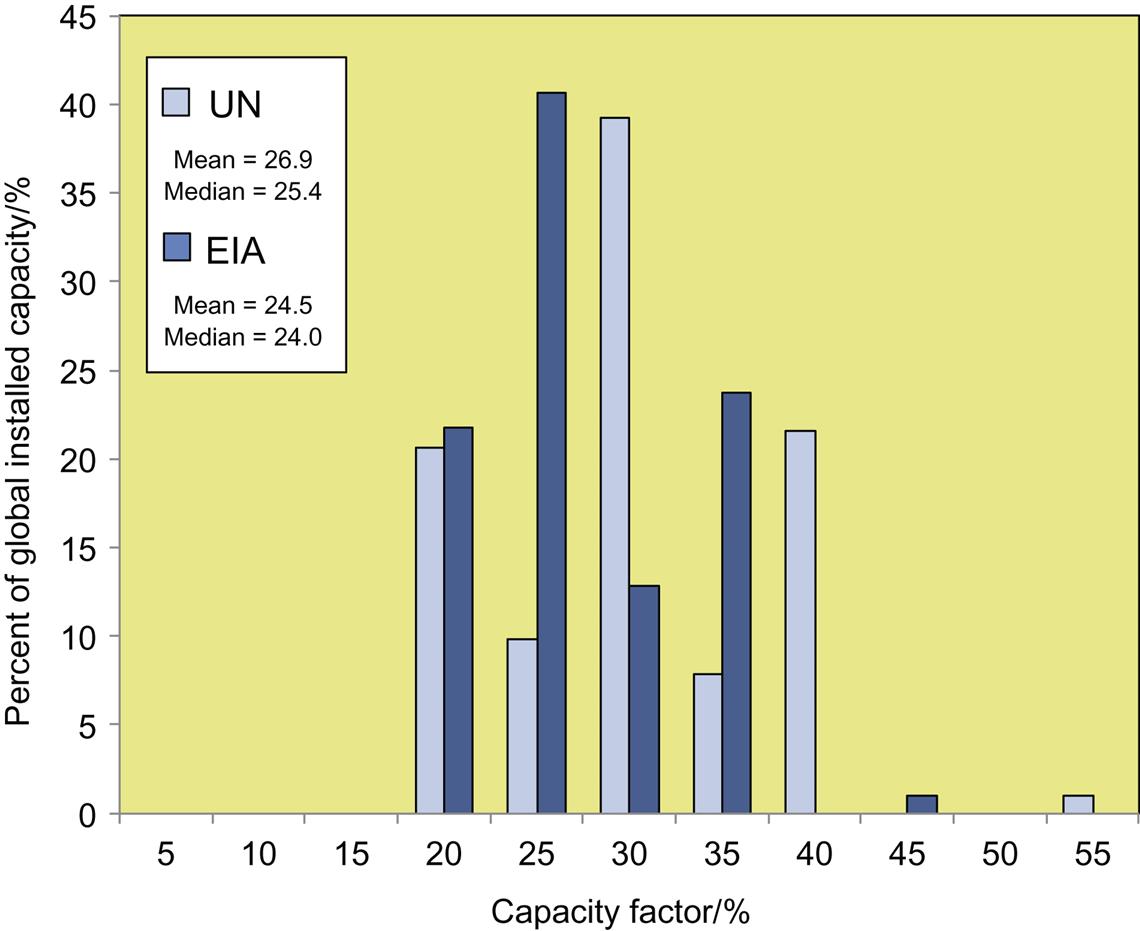
The ratio of average power output to nameplate capacity ![]() is termed the capacity factor. Fig. 21.2 uses data from [5,6] to display the distribution in capacity factor for global installed capacity of wind. The peak in capacity factor occurs around 25%, meaning that a 1 MWp wind turbine will have an annual electricity production of 2.2 GW he (year)−1 (Generally speaking, offshore installments will have a higher capacity factor often greater than 35%.).
is termed the capacity factor. Fig. 21.2 uses data from [5,6] to display the distribution in capacity factor for global installed capacity of wind. The peak in capacity factor occurs around 25%, meaning that a 1 MWp wind turbine will have an annual electricity production of 2.2 GW he (year)−1 (Generally speaking, offshore installments will have a higher capacity factor often greater than 35%.).
The main technology for generating electricity from wind is the horizontal axis wind turbine, wherein airfoil-shaped blades spin around a central hub, which sits at the top of a central tower (Vertical axis wind turbines (VAWT) also exist, though generally not for the large, utility-scale turbines, ones as large as 6 MW have been built. Small-scale VAWTs (100–10 000 W) are favored in locations where wind direction changes rapidly and often, e.g., urban settings.). The size of wind turbines have increased from a hub height of less than 30 m in the early 1990s to a hub height of over 100 m today [7,8]. Blade length has similarly increased. Power capacity is proportional to the area swept by the blades. The power that can be extracted from the wind is also proportional to the cube of the wind speed. As such there is benefit to increasing the size of wind turbines, both to increase the capture area, but also to take advantage of the more frequent, higher wind speed at greater height. Power capacity of wind turbines has increased by two orders of magnitude from around 100 kW during the 1990s to 10 MW today. The main components of the wind system are rotor, nacelle housing the gearing and generator, tower, foundation, and the balance of system. These are described briefly further.
21.2.1 Rotor
The rotor is made up of the hub and blades.
21.2.1.1 Hub
The hub connects to the generator shaft by a bearing and also connects to the blades by bearing to allow control of the pitch of the blades. The hub is typically made primarily out of cast iron with a glass fiber reinforced polyester (or similar material) casing called the spinner [9].
21.2.1.2 Blades
The blades of modern turbines are aerofoils, which can reach over 50 m in length, comprising a main spar glued between two shell sections. Primary materials used in blades are carbon fibers and woven glass fibers infused with epoxy resins and polyurethane glue used to assemble the blade shell.
21.2.2 Nacelle
The nacelle houses the electricity generating equipment including gearbox (if geared), generator, foundation, cover, yaw system (a bearing system that allows the wind turbine to change direction to face the wind), and controls.
21.2.2.1 Gearing and Generator
The gearbox converts the low-speed rotation delivered by the blades to a high-speed (1500 rpm) rotation for electricity generation. Typical materials for the gearbox are iron and steel. The generator also consists mainly of iron and steel. Some manufacturers use lighter permanent magnets made from rare earth metals (e.g., neodymium or dysprosium) while others use heavier induction generators [9]. Although most wind turbines have gears, nongeared turbines are being built but must rely on heavier, low-speed generators.
21.2.2.2 Foundation and Cover
The nacelle foundation provides the floor of the nacelle and is often made from cast iron. The cover to the nacelle is typically made from a fiberglass, consisting of woven glass fibers, polyethylene, and styrene.
21.2.3 Tower
The hub height of turbines has increased significantly in recent decades with the tallest turbines reaching over 150 m. As such the turbine tower makes up a large proportion of the mass of the turbine. Typical materials are structural steel, which is rolled and welded into tower sections, or concrete.
21.2.4 Foundation
The foundation of wind turbines can change significantly, depending on the installation location. Onshore foundation designs include: tensionless pier, a cast-in-place concrete ring around 3–5 m in diameter and up to 10 m deep; anchor deep, a 2 m thick concrete ring supported by up to 20 steel anchors up to 15 m deep; and gravity spread, a broad steel-reinforced concrete disk up to 20 m in diameter [10]. Offshore designs include: gravity-based, using mass to prevent the turbine from tipping over; monopile, consisting of a single, hollow steel pile driven into the sea bed; tripod, consisting of a braced Y-frame and three, smaller piles into the sea bed; and floating, consisting of a floating ballast submerged and moored to the sea bed [11].
21.2.5 Balance of Systems
The balance of system comprises all of the other components and installations to allow the wind system to operate. This includes inverters (if the turbine puts out DC electricity), electrical control systems, operational buildings and roads, spare equipment (e.g., replacement blades) grid interconnection, and energy storage (if required).
21.3 Life-Cycle Assessment
Life-cycle assessment (LCA) is a system of methodologies and tools to evaluate the physical flows and environmental impacts associated with the production of goods and provision of services over the full life cycle from extraction and processing of raw materials through manufacture, operation, and finally to disposal [12]. The LCA is divided into four main phases (1) goal and scope—Including the definition of the functional unit, which quantifies the service delivered by the product system, definition of system boundaries, clarification of assumptions and limitations, allocation methods (e.g., between coproducts), and impact categories; (2) Life-cycle inventory (LCI)—Tracking material and energy flows from and to the environment, often involving either the creation of a “bottom-up” model of the production process, the use of input–output tables, or some hybrid of the two; (3) Life-cycle impact assessment (LCIA)—Evaluating the environmental impacts of flows associated with the LCI including selecting appropriate impact categories, indicators and environmental impact models, classification, and measurement of impacts using a common metric to place different categories on an equivalent basis and; (4) Interpretation—Including identification of significant issues arising from the LCI and LCIA stages, evaluation of completeness, sensitivity and consistency, and conclusions, limitations and recommendations.
21.3.1 Cumulative Energy Demand
CED is an impact metric that “represents the direct and indirect energy use, including the energy consumed during the extraction, manufacturing and disposal of the raw and auxiliary materials.” [13, p. 2189] Certain environmental energy flows are not accounted, as such the wind flowing through the turbine is not included in the CED for wind-generated electricity.
We may define CED on the basis of either nameplate capacity (to give CEC) or lifetime electricity generation (to give LCEC). Mathematically, we may say
(21.1)
where K is the nameplate capacity of the device and
(21.2)
where E is the energy delivered by the device over its lifetime.
21.3.2 Energy Payback Time
Energy payback time (EPBT) is the amount of time that an energy technology takes to deliver the amount of energy required over its life cycle [14]. Mathematically, we may define this as
(21.3)
where ![]() is the energy delivered by the device annually.
is the energy delivered by the device annually.
21.3.3 Fractional Reinvestment
The fractional reinvestment, f, defines the amount of electricity that an industry composed of devises with a certain EPBT must invest in deploying new devices to maintain a certain growth rate [15,16] (It should be noted that here EPBT is defined using a quality correction factor to directly compare electricity production with the energy investments, which we denote with a subscript e, where ![]() .). Mathematically we can define this as
.). Mathematically we can define this as
(21.4)
where r is the industry growth rate in percent per year.
If ![]() , the industry is running in deficit, if
, the industry is running in deficit, if ![]() , the industry can provide surplus electricity to society. Currently the global photovoltaic industry has a fractional reinvestment,
, the industry can provide surplus electricity to society. Currently the global photovoltaic industry has a fractional reinvestment, ![]() meaning that only 10% of electricity production by the PV industry is available for other uses within society.
meaning that only 10% of electricity production by the PV industry is available for other uses within society.
21.4 Meta-analysis
The areas of interest for this analysis are: energy requirements for production of capital infrastructure, capital energy cost (CEC), an analog to overnight capital cost, measured on a per unit of nameplate capacity bases; and total life-cycle energy requirements for the system, life-cycle energy cost (LCEC), an analog to LCOE, measure on a per unit of electricity production basis.
A recent meta-analysis and harmonization project was carried out by researchers at the National Renewable Energy Laboratory (NREL) and a number of other institutions to determine the distribution in greenhouse gas (GHG) emissions from a variety of electricity production technologies over their entire life cycle. Methodological details are provided in Heath and Mann [17]. The results have been published in a special issue of the Journal of Industrial Ecology. This analysis uses the NREL methodology to build upon previous meta-analyses, which have been done for the energy inputs to wind electricity production [7,8,15].
21.4.1 Literature Search
Searches were made of a number of publication types including peer-reviewed journals, industry reports, reports by national agencies, e.g., the US Department of Energy (DOE) and other work, e.g., conference papers and doctoral theses. The search terms included the “wind,” with the following phrases: “embodied energy”; “cumulative energy demand”; “life cycle inventory”; “life cycle assessment”; “energy payback time”; “net energy ratio” (NER); “energy yield ratio” (EYR); “energy return on investment”; and “EROI.”
The initial search produced 120 items published since 2012. These were then passed to the screening process.
21.4.2 Literature Screening
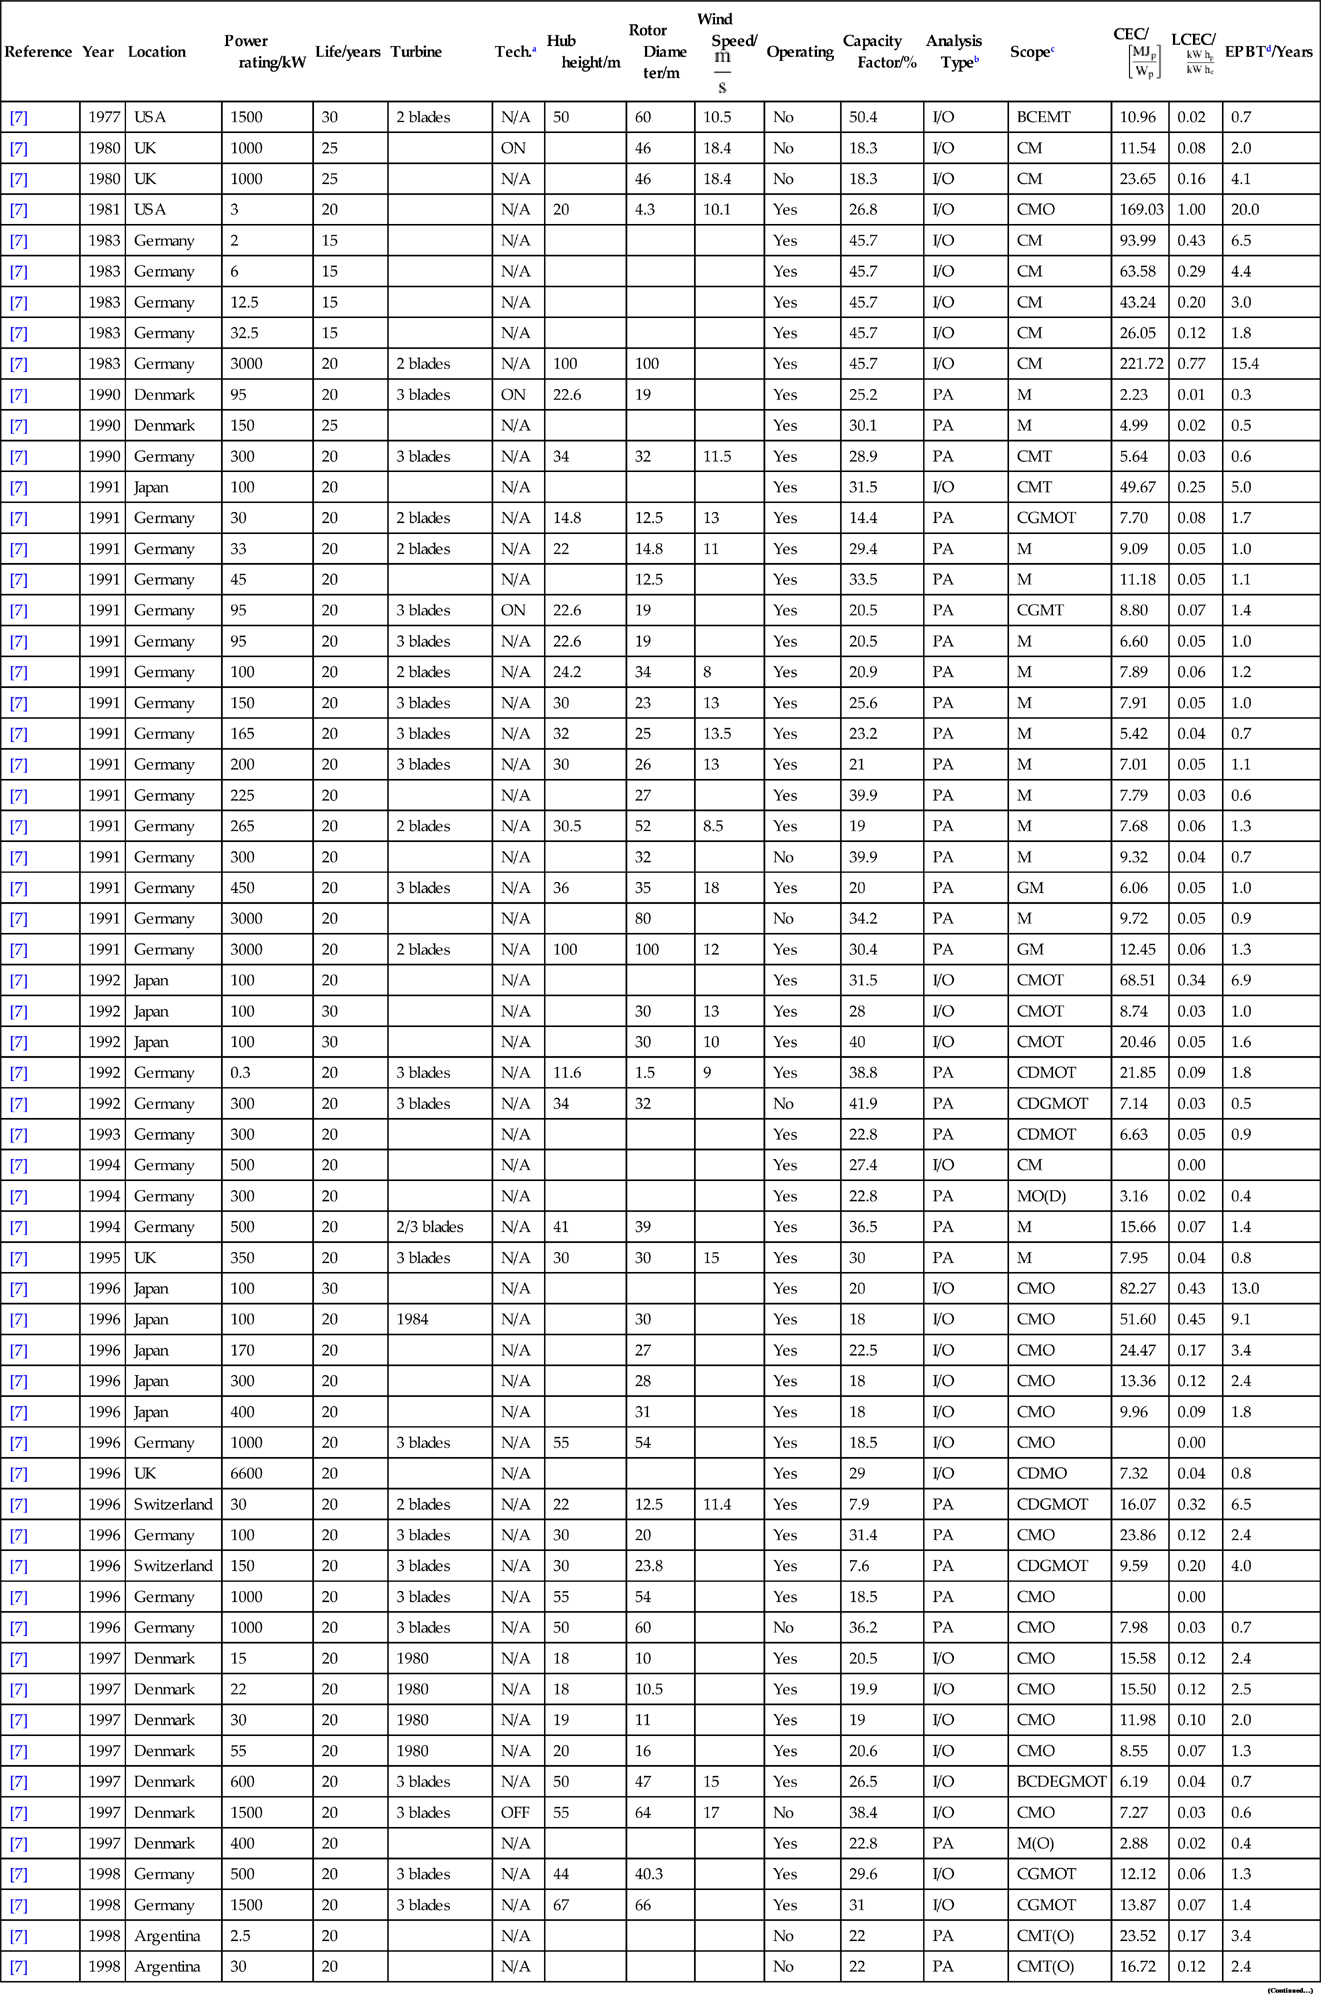
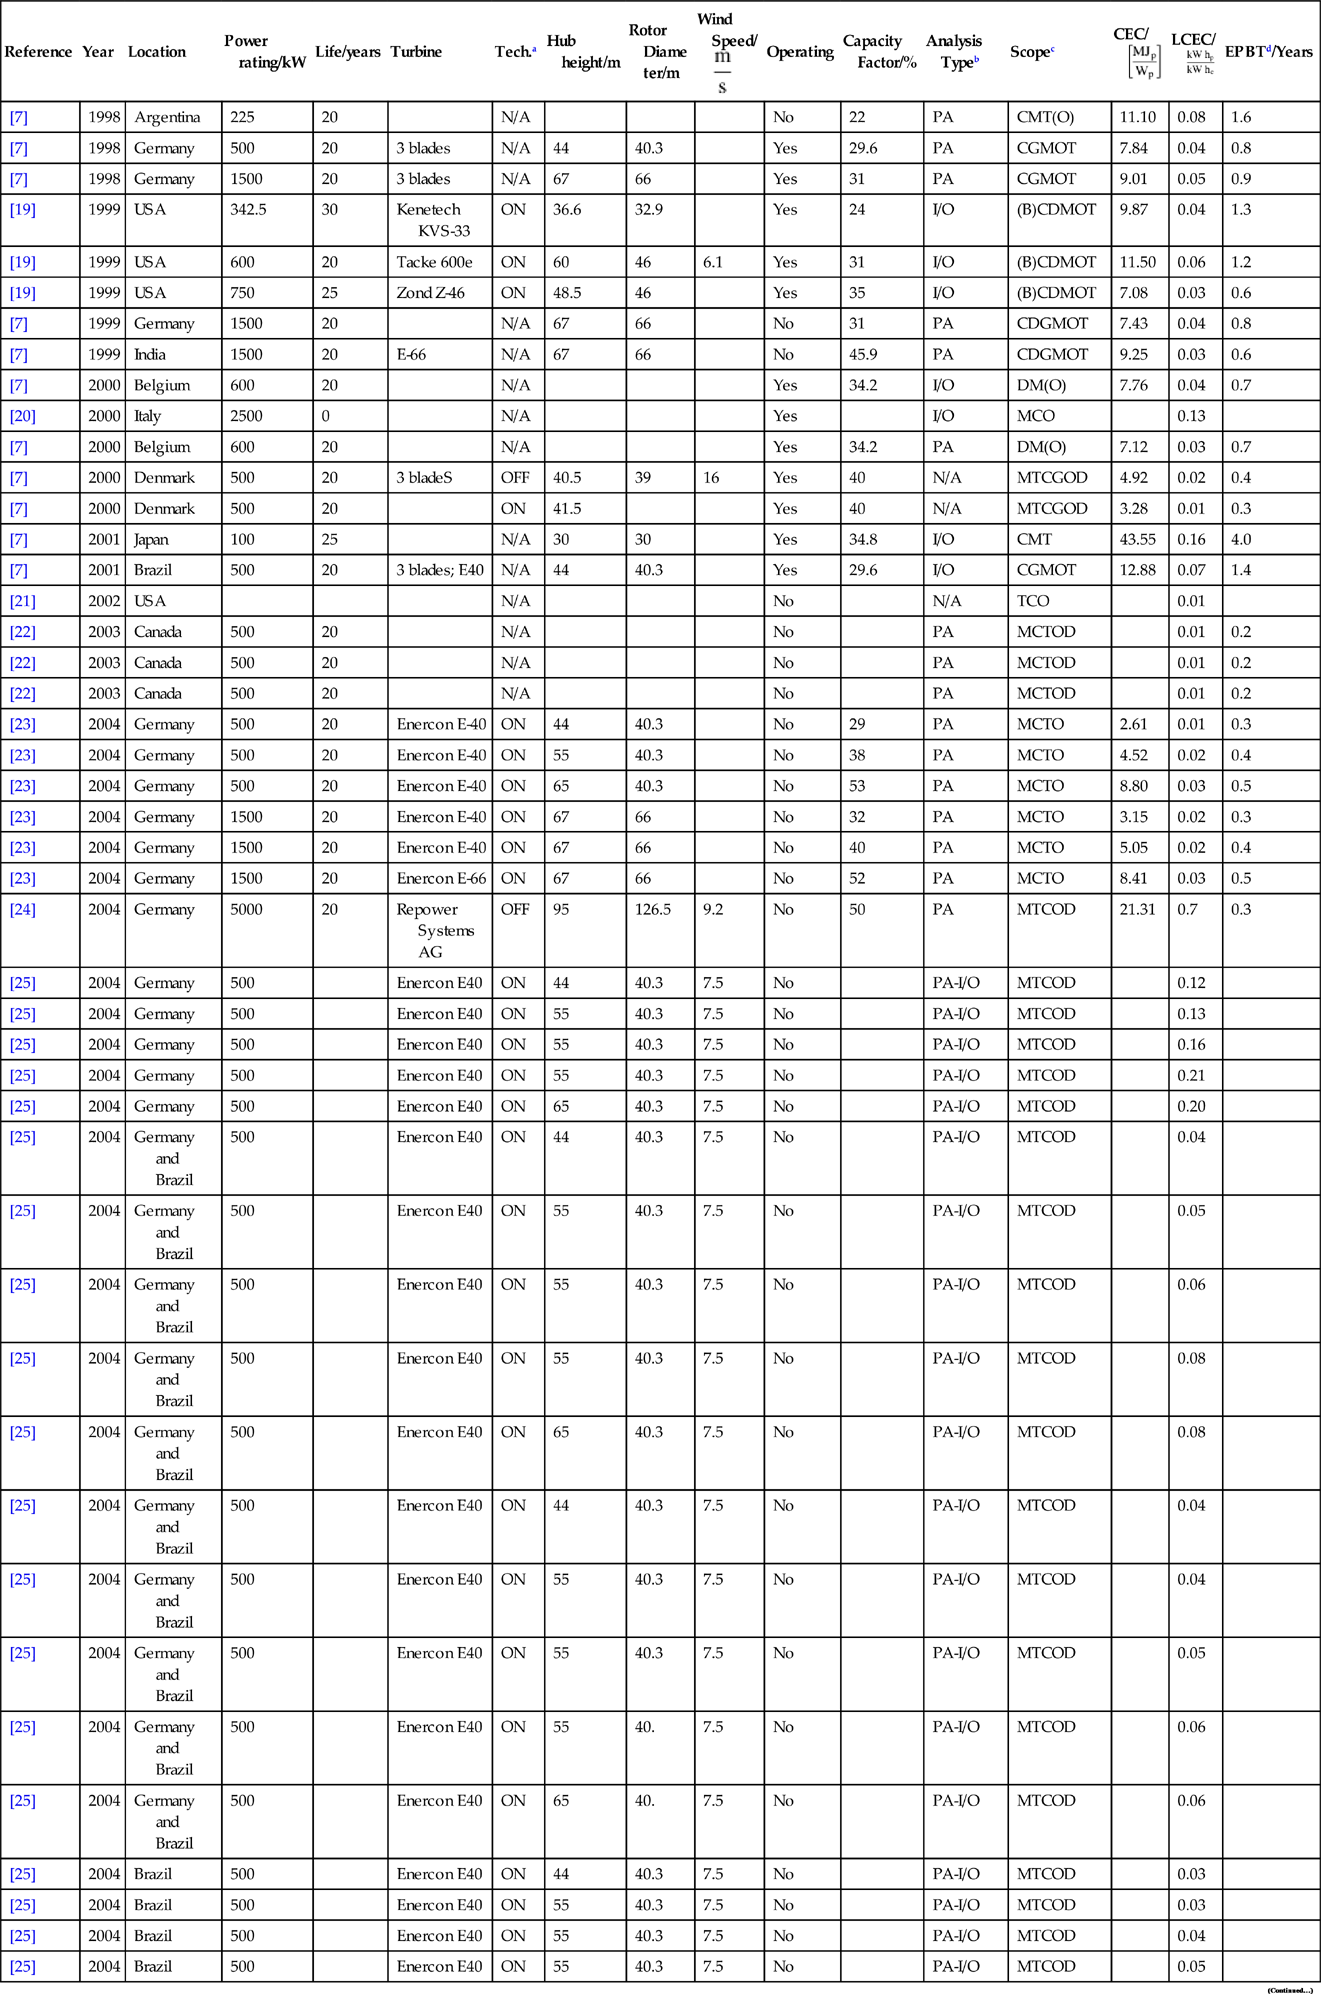
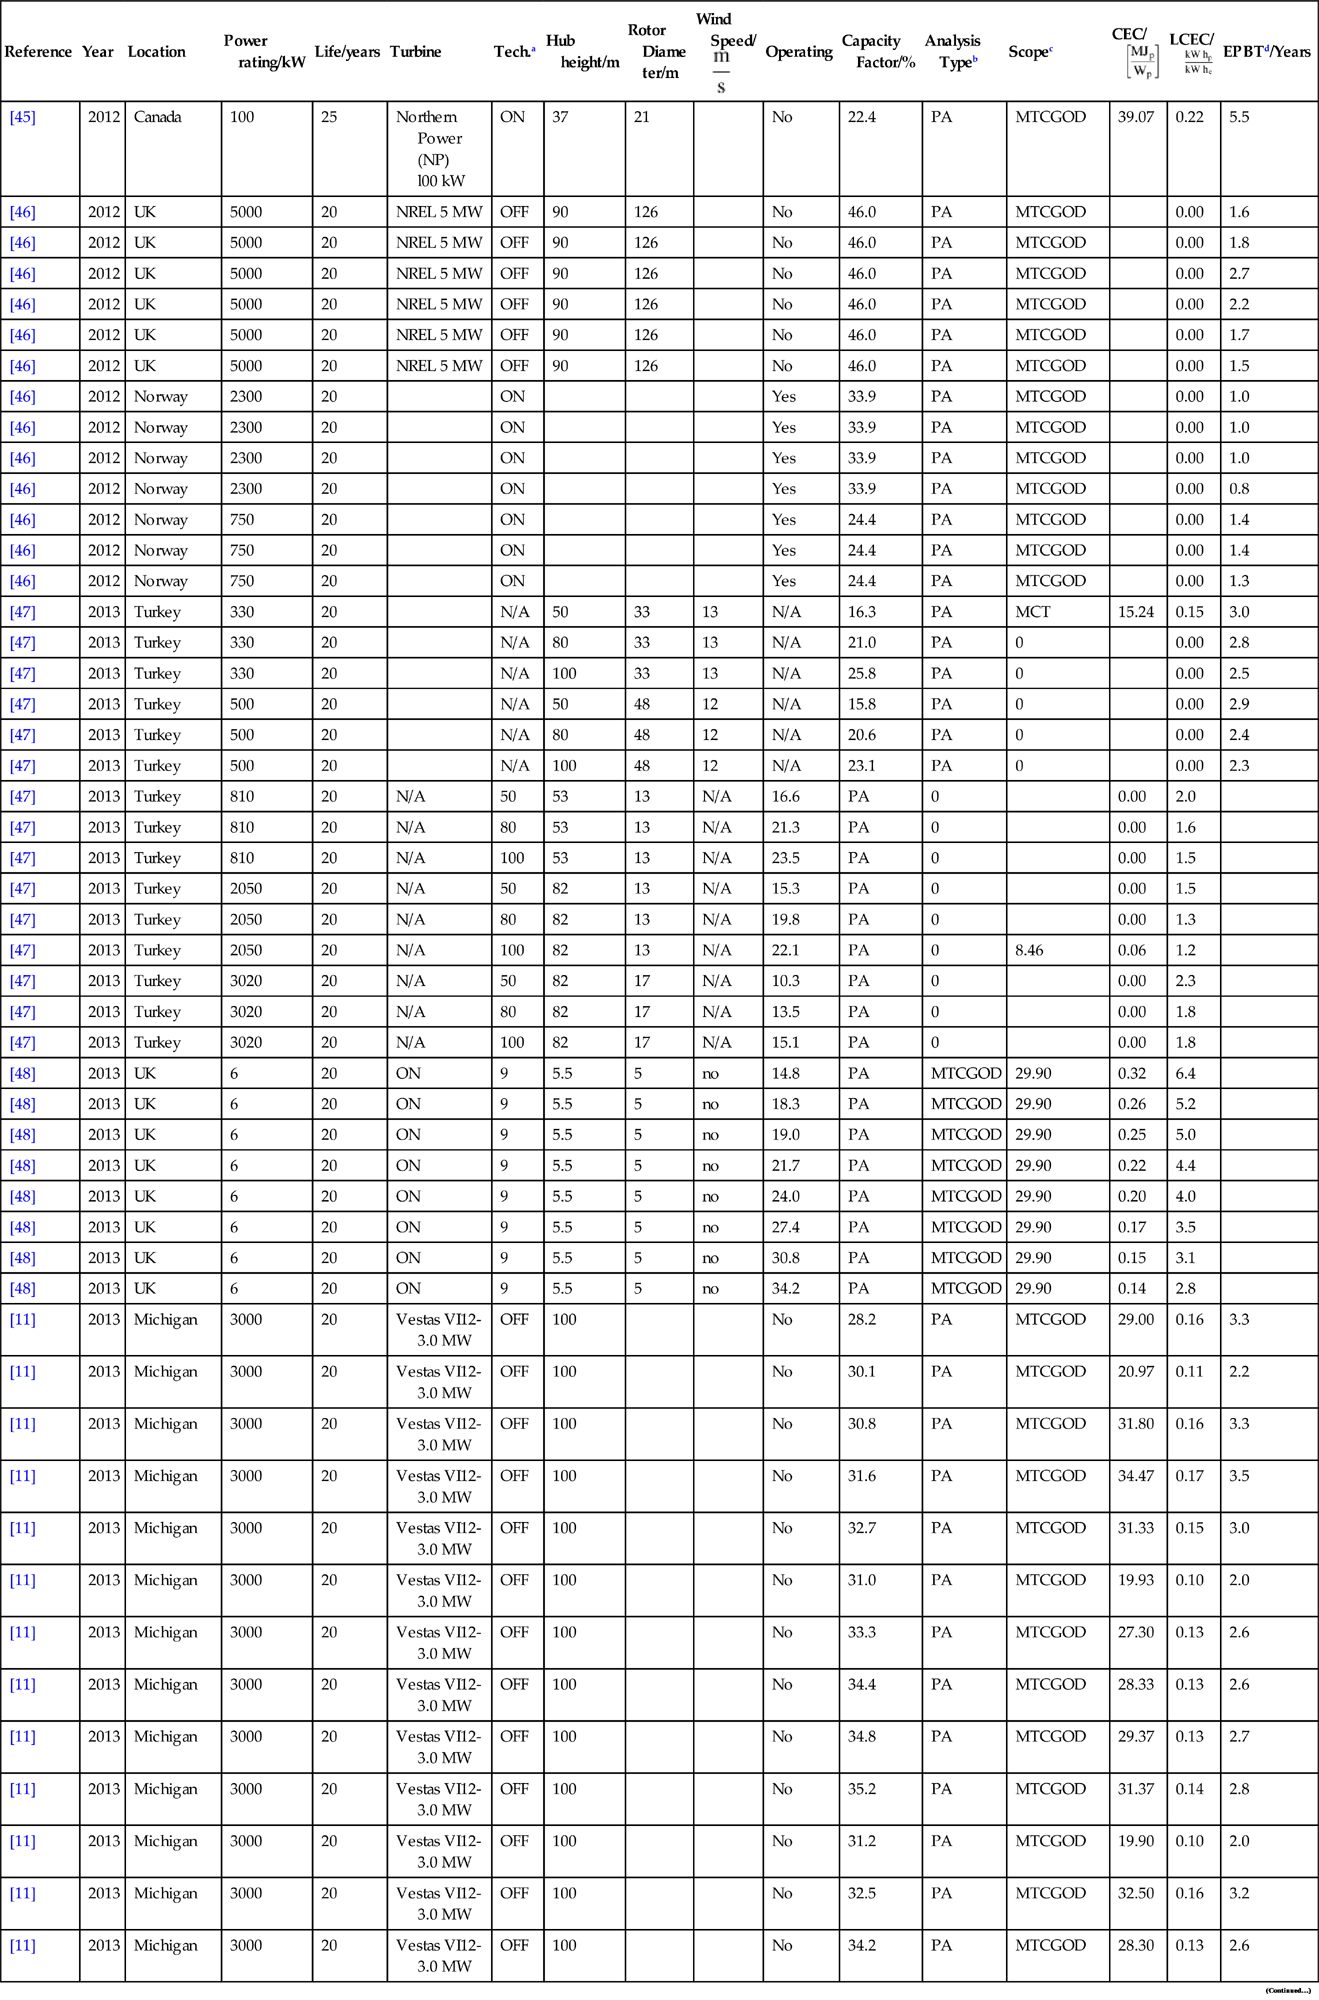
A number of criteria were used to screen the initial results (1) the study should be in English; (2) the study should be original research or should reference data used; (3) the study should give data on wind turbine technologies; (4) the study should give numeric data on net energy metrics, e.g., CED, or net energy ratio (NER); and (5) the study should give sufficient information on assumptions and system boundaries to allow for harmonization. Cross-referenced estimates were also eliminated. The studies remaining after screening are presented in Table 21.1 along with data from previous meta-analyses [7,8,15].
21.4.3 Harmonization of Study Boundaries and Data
A number of methods were used to allow comparison of results: Data given in terms of primary energy was changed to electricity equivalents using conversion factors given in the study. If no conversion factor was given, a standard conversion factor of 30% was used. If data was given in terms of an energy intensity, i.e., energy inputs per unit of electricity produced, e.g. [MJ (kW he)−1], this was converted to per unit capacity inputs by either: using the capacity factor, i.e., the ratio of the average power output to nameplate capacity of the system; or using the total lifetime electricity production of the system; or using the annual electricity production of the system and the lifetime of the system, if no lifetime was given, the system was assumed to have a nominal lifetime of 25 years.
21.5 Results and Discussion
The raw data from the studies was used to calculate three metrics: CEC; LCEC; and EPBT, presented in Table 21.1. Further data was collected from the studies to determine the proportion of CED that each of the major components comprised.
21.5.1 Capital Energetic Costs (CEC)
Capital costs include the energy requirements to extract and process all raw materials, manufacture, and install the capital equipment including any site preparation and grid interconnection. Units of measurement for CEC are primary energy inputs per unit of nameplate capacity [MJp (Wp)−1].
Fig. 21.3 shows the distribution in estimates of CEC for the various wind technologies and analysis methods. This presentation does not account for changes in these values over time but instead shows the distribution across all studies over the more than 40 year period. The boxes represent 25-50-75 percentiles and whiskers plot minimum and maximum values. Generally there is a large min–max range in the data, with much smaller interquartile range. Onshore wind tends to have a lower CEC than offshore wind (due to the added costs of offshore deployment). Input–output analysis tends to produce higher estimates with a larger range, whereas hybrid analyses produced the lowest range and median value.

21.5.2 Life-Cycle Energy Costs (LCEC)
LCEC includes all of the energy inputs over the full life cycle of the system, including end-of-life, normalized by the total lifetime electricity output from the system. The unit of measurement is primary energy per unit of electricity production [kW hp (kW he)−1]. Unlike the financial metric LCOE, no discounting of inputs and outputs has been made.
Fig. 21.4 shows the life-cycle energy requirements for onshore and offshore technologies and all of the different analysis methods. Similarly to CEC we find a wide range in the data. Again onshore has a lower median value than offshore and process analysis methods produce a lower variation in value.

21.5.3 Harmonization
During the harmonization procedure, parameter inputs that impact the calculation of performance metrics are substituted for standard values. We will harmonize the capacity factor and turbine lifetime to analyze the effect on LCEC. In Fig. 21.5A we see the unharmonized values of LCEC computed using the data in the studies and ranked from smallest to largest. The corresponding distribution is shown in Fig. 21.6. We first replace the value for capacity factor used in the study, with a standard value of 25% (representing the global median value, as shown in Fig. 21.2) and recalculate LCEC, as shown ranked in Fig. 21.5B. As can be seen in the new distribution in Fig. 21.6 this step actually increased the min–max and interquartile range, and slightly increased the median value. We then replaced the turbine lifetime used in the study, with a nominal value of 25 years. The recalculated values for LCEC can be seen in Fig. 21.5C with the corresponding distribution again shown in Fig. 21.6. The min–max range has now decreased (though still not below the unharmonized range), however, the interquartile range has decreased below unharmonized.


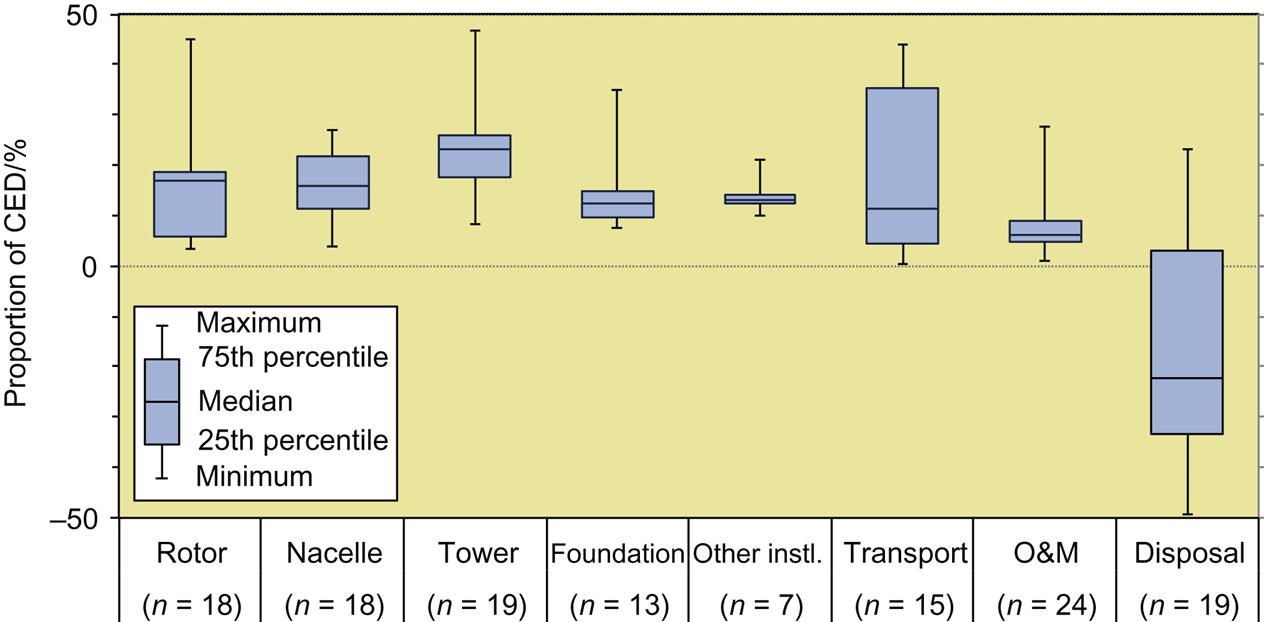
21.5.4 Components
Many of the studies provide a breakdown of CED by different components. This data is presented in Table 21.2 with distributions presented in Fig. 21.7. Again there is a large distribution to the values. The tower contributes the highest median value to the overall CED (23%). Transport has the highest range in values, which is greatly influenced by both distance and the size of the system. Disposal presents an interesting case. Many studies give energy credits for recycling of turbine materials (primarily steel), leading to a negative value, as much as 50% of the overall value.
21.5.5 Trends in Parameters
The distributions presented in Figs. 21.3–21.7, did not account for all physical attributes of the turbines or studies. For instance we might expect that larger turbines might have a lower CEC or that a turbine built today would have a lower CED than the equivalent turbine built 10 years ago.
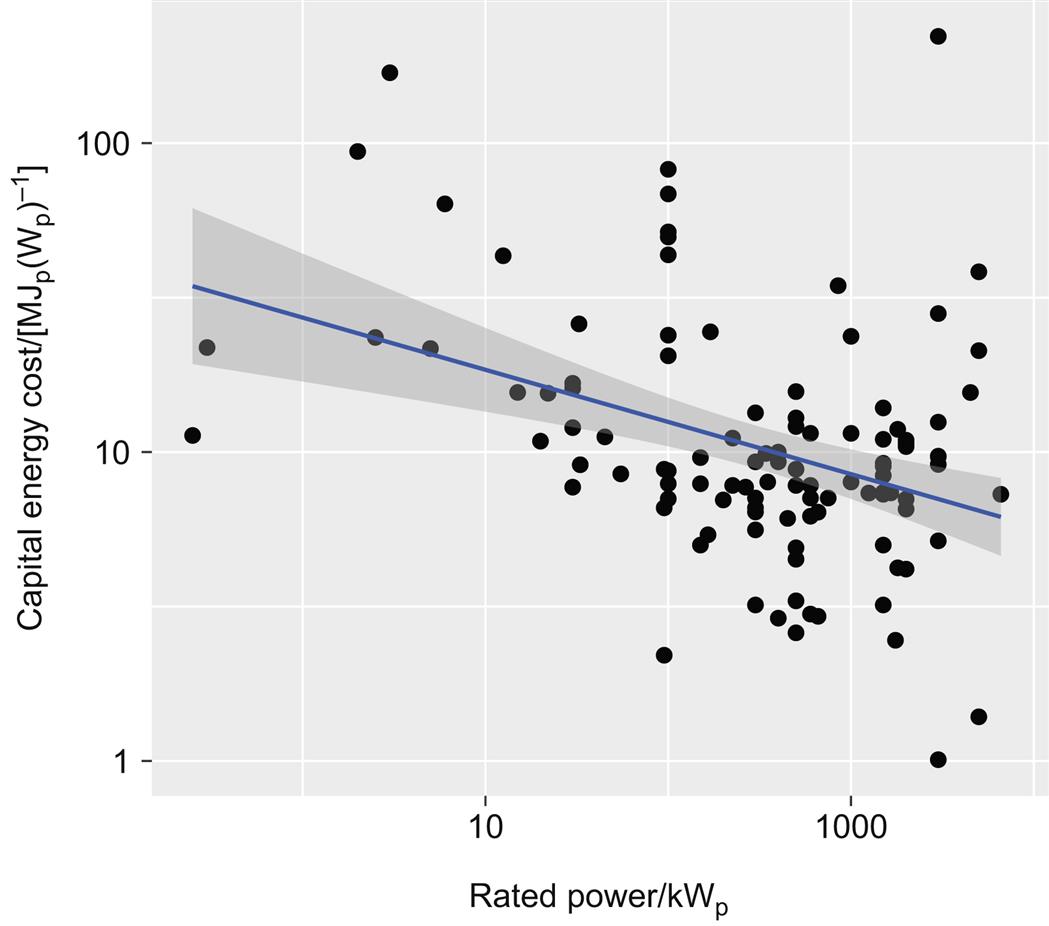
To assess the relationship between CEC and turbine power rating, we present Fig. 21.8. CEC decreases as turbine rating increases.
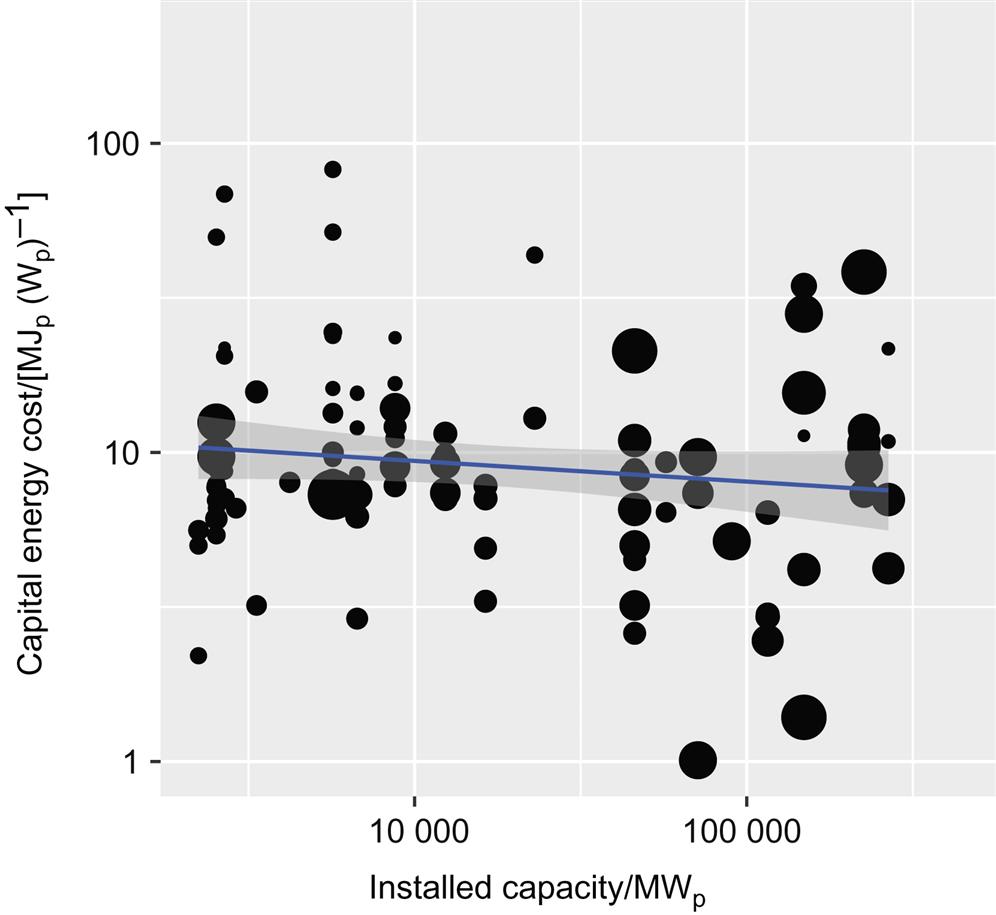
We also expect that as installed capacity increases the industry decreases the cost of producing wind power systems. The energy learning curve for wind is depicted in Fig. 21.9 with a power curve fitted to the data. The learning rate is defined as the percent reduction in cost per doubling of installed capacity. The learning rate for the wind industry is approximately 5%.
21.5.6 Net Energy Trajectory of the Global Wind Industry
Combining data on CED and EPBT (including learning effects, see Section 21.5.5), as well as global wind industry capacity factors 21.2 and growth rate of installed capacity (see Fig. 21.1), we can determine the fractional reinvestment in each year. Combining these annual values we can develop the net energy trajectory for the global wind industry, as shown in Fig. 21.10 (It is worth noting that these values are based on a capacity factor of 25%. In reality offshore wind farms tend to have higher capacity factors (more like 35%–40%), so are likely to have shorter EPBT and correspondingly lower fractional reinvestment.).

As can be seen both the onshore and offshore wind industries are operating with low fractional reinvestment. The onshore industry currently has a growth rate of around 16% year−1 and wind turbines have an EPBTe of just over 0.3 years, giving ![]() . The offshore wind industry is currently growing more rapidly at a rate of around 40% year−1 and has a higher EPBT (since less offshore capacity has been installed) giving a higher fractional reinvestment,
. The offshore wind industry is currently growing more rapidly at a rate of around 40% year−1 and has a higher EPBT (since less offshore capacity has been installed) giving a higher fractional reinvestment, ![]() .
.
21.6 Conclusions
The results of meta-analysis of energy requirements (CED) for wind electricity production technologies has been presented. To facilitate the utility of this information, the metrics presented, CEC and LCEC, are direct analogies of financial metrics commonly used to characterize electricity production technologies, overnight capital cost and LCOE, respectively. The meta-analysis also determined another commonly used metric for assessing wind turbines, EPBT.
The results showed a large variation in both CEC and LCEC. The results were then harmonized for both capacity factor (to the global median value of 25%) and lifetime (to a value of 25 years). Results showed an increase in the interquartile range after harmonization for capacity factor, which was decreased after subsequent harmonization of lifetime. We also presented a breakdown of CED by major component/life-cycle phase, which also showed a large range between studies. Disposal had the highest variation comprising between 22% and negative 50% if recycling credits were included.
Analyzing trends in the data showed that CEC decreases as a function of turbine power rating [Wp] and also as a function of global installed capacity with a learning rate of around 5%. This compares with a learning rate in the PV industry of over 20% [18,16].
All of this information was combined to calculate the net energy trajectory of the global wind industry. The industry is clearly a net electricity provider, both in terms of onshore as well as offshore installations, with both having fractional reinvestment rates of below 20%. In fact the industry could be growing at over 10 times its current rate and still be providing net electricity to society, over and above providing sufficient energy to meet its own needs.
Acknowledgments
The author would like to acknowledge financial support from the Environmental Engineering & Earth Sciences department at Clemson University.
Appendix A
Table 21.1
Results From Meta-analysis With Capital Energy Cost (CEC) [MJp (Wp)−1], Life-Cycle Energy Cost (LCEC) (kW hp (kW he)−1) and Energy Payback Time (EPBT) (years)
| Reference | Year | Location | Power rating/kW | Life/years | Turbine | Tech.a | Hub height/m | Rotor Diame ter/m | Wind Speed/ |
Operating | Capacity Factor/% | Analysis Typeb | Scopec | CEC/ |
LCEC/ |
EPBTd/Years |
| [7] | 1977 | USA | 1500 | 30 | 2 blades | N/A | 50 | 60 | 10.5 | No | 50.4 | I/O | BCEMT | 10.96 | 0.02 | 0.7 |
| [7] | 1980 | UK | 1000 | 25 | ON | 46 | 18.4 | No | 18.3 | I/O | CM | 11.54 | 0.08 | 2.0 | ||
| [7] | 1980 | UK | 1000 | 25 | N/A | 46 | 18.4 | No | 18.3 | I/O | CM | 23.65 | 0.16 | 4.1 | ||
| [7] | 1981 | USA | 3 | 20 | N/A | 20 | 4.3 | 10.1 | Yes | 26.8 | I/O | CMO | 169.03 | 1.00 | 20.0 | |
| [7] | 1983 | Germany | 2 | 15 | N/A | Yes | 45.7 | I/O | CM | 93.99 | 0.43 | 6.5 | ||||
| [7] | 1983 | Germany | 6 | 15 | N/A | Yes | 45.7 | I/O | CM | 63.58 | 0.29 | 4.4 | ||||
| [7] | 1983 | Germany | 12.5 | 15 | N/A | Yes | 45.7 | I/O | CM | 43.24 | 0.20 | 3.0 | ||||
| [7] | 1983 | Germany | 32.5 | 15 | N/A | Yes | 45.7 | I/O | CM | 26.05 | 0.12 | 1.8 | ||||
| [7] | 1983 | Germany | 3000 | 20 | 2 blades | N/A | 100 | 100 | Yes | 45.7 | I/O | CM | 221.72 | 0.77 | 15.4 | |
| [7] | 1990 | Denmark | 95 | 20 | 3 blades | ON | 22.6 | 19 | Yes | 25.2 | PA | M | 2.23 | 0.01 | 0.3 | |
| [7] | 1990 | Denmark | 150 | 25 | N/A | Yes | 30.1 | PA | M | 4.99 | 0.02 | 0.5 | ||||
| [7] | 1990 | Germany | 300 | 20 | 3 blades | N/A | 34 | 32 | 11.5 | Yes | 28.9 | PA | CMT | 5.64 | 0.03 | 0.6 |
| [7] | 1991 | Japan | 100 | 20 | N/A | Yes | 31.5 | I/O | CMT | 49.67 | 0.25 | 5.0 | ||||
| [7] | 1991 | Germany | 30 | 20 | 2 blades | N/A | 14.8 | 12.5 | 13 | Yes | 14.4 | PA | CGMOT | 7.70 | 0.08 | 1.7 |
| [7] | 1991 | Germany | 33 | 20 | 2 blades | N/A | 22 | 14.8 | 11 | Yes | 29.4 | PA | M | 9.09 | 0.05 | 1.0 |
| [7] | 1991 | Germany | 45 | 20 | N/A | 12.5 | Yes | 33.5 | PA | M | 11.18 | 0.05 | 1.1 | |||
| [7] | 1991 | Germany | 95 | 20 | 3 blades | ON | 22.6 | 19 | Yes | 20.5 | PA | CGMT | 8.80 | 0.07 | 1.4 | |
| [7] | 1991 | Germany | 95 | 20 | 3 blades | N/A | 22.6 | 19 | Yes | 20.5 | PA | M | 6.60 | 0.05 | 1.0 | |
| [7] | 1991 | Germany | 100 | 20 | 2 blades | N/A | 24.2 | 34 | 8 | Yes | 20.9 | PA | M | 7.89 | 0.06 | 1.2 |
| [7] | 1991 | Germany | 150 | 20 | 3 blades | N/A | 30 | 23 | 13 | Yes | 25.6 | PA | M | 7.91 | 0.05 | 1.0 |
| [7] | 1991 | Germany | 165 | 20 | 3 blades | N/A | 32 | 25 | 13.5 | Yes | 23.2 | PA | M | 5.42 | 0.04 | 0.7 |
| [7] | 1991 | Germany | 200 | 20 | 3 blades | N/A | 30 | 26 | 13 | Yes | 21 | PA | M | 7.01 | 0.05 | 1.1 |
| [7] | 1991 | Germany | 225 | 20 | N/A | 27 | Yes | 39.9 | PA | M | 7.79 | 0.03 | 0.6 | |||
| [7] | 1991 | Germany | 265 | 20 | 2 blades | N/A | 30.5 | 52 | 8.5 | Yes | 19 | PA | M | 7.68 | 0.06 | 1.3 |
| [7] | 1991 | Germany | 300 | 20 | N/A | 32 | No | 39.9 | PA | M | 9.32 | 0.04 | 0.7 | |||
| [7] | 1991 | Germany | 450 | 20 | 3 blades | N/A | 36 | 35 | 18 | Yes | 20 | PA | GM | 6.06 | 0.05 | 1.0 |
| [7] | 1991 | Germany | 3000 | 20 | N/A | 80 | No | 34.2 | PA | M | 9.72 | 0.05 | 0.9 | |||
| [7] | 1991 | Germany | 3000 | 20 | 2 blades | N/A | 100 | 100 | 12 | Yes | 30.4 | PA | GM | 12.45 | 0.06 | 1.3 |
| [7] | 1992 | Japan | 100 | 20 | N/A | Yes | 31.5 | I/O | CMOT | 68.51 | 0.34 | 6.9 | ||||
| [7] | 1992 | Japan | 100 | 30 | N/A | 30 | 13 | Yes | 28 | I/O | CMOT | 8.74 | 0.03 | 1.0 | ||
| [7] | 1992 | Japan | 100 | 30 | N/A | 30 | 10 | Yes | 40 | I/O | CMOT | 20.46 | 0.05 | 1.6 | ||
| [7] | 1992 | Germany | 0.3 | 20 | 3 blades | N/A | 11.6 | 1.5 | 9 | Yes | 38.8 | PA | CDMOT | 21.85 | 0.09 | 1.8 |
| [7] | 1992 | Germany | 300 | 20 | 3 blades | N/A | 34 | 32 | No | 41.9 | PA | CDGMOT | 7.14 | 0.03 | 0.5 | |
| [7] | 1993 | Germany | 300 | 20 | N/A | Yes | 22.8 | PA | CDMOT | 6.63 | 0.05 | 0.9 | ||||
| [7] | 1994 | Germany | 500 | 20 | N/A | Yes | 27.4 | I/O | CM | 0.00 | ||||||
| [7] | 1994 | Germany | 300 | 20 | N/A | Yes | 22.8 | PA | MO(D) | 3.16 | 0.02 | 0.4 | ||||
| [7] | 1994 | Germany | 500 | 20 | 2/3 blades | N/A | 41 | 39 | Yes | 36.5 | PA | M | 15.66 | 0.07 | 1.4 | |
| [7] | 1995 | UK | 350 | 20 | 3 blades | N/A | 30 | 30 | 15 | Yes | 30 | PA | M | 7.95 | 0.04 | 0.8 |
| [7] | 1996 | Japan | 100 | 30 | N/A | Yes | 20 | I/O | CMO | 82.27 | 0.43 | 13.0 | ||||
| [7] | 1996 | Japan | 100 | 20 | 1984 | N/A | 30 | Yes | 18 | I/O | CMO | 51.60 | 0.45 | 9.1 | ||
| [7] | 1996 | Japan | 170 | 20 | N/A | 27 | Yes | 22.5 | I/O | CMO | 24.47 | 0.17 | 3.4 | |||
| [7] | 1996 | Japan | 300 | 20 | N/A | 28 | Yes | 18 | I/O | CMO | 13.36 | 0.12 | 2.4 | |||
| [7] | 1996 | Japan | 400 | 20 | N/A | 31 | Yes | 18 | I/O | CMO | 9.96 | 0.09 | 1.8 | |||
| [7] | 1996 | Germany | 1000 | 20 | 3 blades | N/A | 55 | 54 | Yes | 18.5 | I/O | CMO | 0.00 | |||
| [7] | 1996 | UK | 6600 | 20 | N/A | Yes | 29 | I/O | CDMO | 7.32 | 0.04 | 0.8 | ||||
| [7] | 1996 | Switzerland | 30 | 20 | 2 blades | N/A | 22 | 12.5 | 11.4 | Yes | 7.9 | PA | CDGMOT | 16.07 | 0.32 | 6.5 |
| [7] | 1996 | Germany | 100 | 20 | 3 blades | N/A | 30 | 20 | Yes | 31.4 | PA | CMO | 23.86 | 0.12 | 2.4 | |
| [7] | 1996 | Switzerland | 150 | 20 | 3 blades | N/A | 30 | 23.8 | Yes | 7.6 | PA | CDGMOT | 9.59 | 0.20 | 4.0 | |
| [7] | 1996 | Germany | 1000 | 20 | 3 blades | N/A | 55 | 54 | Yes | 18.5 | PA | CMO | 0.00 | |||
| [7] | 1996 | Germany | 1000 | 20 | 3 blades | N/A | 50 | 60 | No | 36.2 | PA | CMO | 7.98 | 0.03 | 0.7 | |
| [7] | 1997 | Denmark | 15 | 20 | 1980 | N/A | 18 | 10 | Yes | 20.5 | I/O | CMO | 15.58 | 0.12 | 2.4 | |
| [7] | 1997 | Denmark | 22 | 20 | 1980 | N/A | 18 | 10.5 | Yes | 19.9 | I/O | CMO | 15.50 | 0.12 | 2.5 | |
| [7] | 1997 | Denmark | 30 | 20 | 1980 | N/A | 19 | 11 | Yes | 19 | I/O | CMO | 11.98 | 0.10 | 2.0 | |
| [7] | 1997 | Denmark | 55 | 20 | 1980 | N/A | 20 | 16 | Yes | 20.6 | I/O | CMO | 8.55 | 0.07 | 1.3 | |
| [7] | 1997 | Denmark | 600 | 20 | 3 blades | N/A | 50 | 47 | 15 | Yes | 26.5 | I/O | BCDEGMOT | 6.19 | 0.04 | 0.7 |
| [7] | 1997 | Denmark | 1500 | 20 | 3 blades | OFF | 55 | 64 | 17 | No | 38.4 | I/O | CMO | 7.27 | 0.03 | 0.6 |
| [7] | 1997 | Denmark | 400 | 20 | N/A | Yes | 22.8 | PA | M(O) | 2.88 | 0.02 | 0.4 | ||||
| [7] | 1998 | Germany | 500 | 20 | 3 blades | N/A | 44 | 40.3 | Yes | 29.6 | I/O | CGMOT | 12.12 | 0.06 | 1.3 | |
| [7] | 1998 | Germany | 1500 | 20 | 3 blades | N/A | 67 | 66 | Yes | 31 | I/O | CGMOT | 13.87 | 0.07 | 1.4 | |
| [7] | 1998 | Argentina | 2.5 | 20 | N/A | No | 22 | PA | CMT(O) | 23.52 | 0.17 | 3.4 | ||||
| [7] | 1998 | Argentina | 30 | 20 | N/A | No | 22 | PA | CMT(O) | 16.72 | 0.12 | 2.4 | ||||
| [7] | 1998 | Argentina | 225 | 20 | N/A | No | 22 | PA | CMT(O) | 11.10 | 0.08 | 1.6 | ||||
| [7] | 1998 | Germany | 500 | 20 | 3 blades | N/A | 44 | 40.3 | Yes | 29.6 | PA | CGMOT | 7.84 | 0.04 | 0.8 | |
| [7] | 1998 | Germany | 1500 | 20 | 3 blades | N/A | 67 | 66 | Yes | 31 | PA | CGMOT | 9.01 | 0.05 | 0.9 | |
| [19] | 1999 | USA | 342.5 | 30 | Kenetech KVS-33 | ON | 36.6 | 32.9 | Yes | 24 | I/O | (B)CDMOT | 9.87 | 0.04 | 1.3 | |
| [19] | 1999 | USA | 600 | 20 | Tacke 600e | ON | 60 | 46 | 6.1 | Yes | 31 | I/O | (B)CDMOT | 11.50 | 0.06 | 1.2 |
| [19] | 1999 | USA | 750 | 25 | Zond Z-46 | ON | 48.5 | 46 | Yes | 35 | I/O | (B)CDMOT | 7.08 | 0.03 | 0.6 | |
| [7] | 1999 | Germany | 1500 | 20 | N/A | 67 | 66 | No | 31 | PA | CDGMOT | 7.43 | 0.04 | 0.8 | ||
| [7] | 1999 | India | 1500 | 20 | E-66 | N/A | 67 | 66 | No | 45.9 | PA | CDGMOT | 9.25 | 0.03 | 0.6 | |
| [7] | 2000 | Belgium | 600 | 20 | N/A | Yes | 34.2 | I/O | DM(O) | 7.76 | 0.04 | 0.7 | ||||
| [20] | 2000 | Italy | 2500 | 0 | N/A | Yes | I/O | MCO | 0.13 | |||||||
| [7] | 2000 | Belgium | 600 | 20 | N/A | Yes | 34.2 | PA | DM(O) | 7.12 | 0.03 | 0.7 | ||||
| [7] | 2000 | Denmark | 500 | 20 | 3 bladeS | OFF | 40.5 | 39 | 16 | Yes | 40 | N/A | MTCGOD | 4.92 | 0.02 | 0.4 |
| [7] | 2000 | Denmark | 500 | 20 | ON | 41.5 | Yes | 40 | N/A | MTCGOD | 3.28 | 0.01 | 0.3 | |||
| [7] | 2001 | Japan | 100 | 25 | N/A | 30 | 30 | Yes | 34.8 | I/O | CMT | 43.55 | 0.16 | 4.0 | ||
| [7] | 2001 | Brazil | 500 | 20 | 3 blades; E40 | N/A | 44 | 40.3 | Yes | 29.6 | I/O | CGMOT | 12.88 | 0.07 | 1.4 | |
| [21] | 2002 | USA | N/A | No | N/A | TCO | 0.01 | |||||||||
| [22] | 2003 | Canada | 500 | 20 | N/A | No | PA | MCTOD | 0.01 | 0.2 | ||||||
| [22] | 2003 | Canada | 500 | 20 | N/A | No | PA | MCTOD | 0.01 | 0.2 | ||||||
| [22] | 2003 | Canada | 500 | 20 | N/A | No | PA | MCTOD | 0.01 | 0.2 | ||||||
| [23] | 2004 | Germany | 500 | 20 | Enercon E-40 | ON | 44 | 40.3 | No | 29 | PA | MCTO | 2.61 | 0.01 | 0.3 | |
| [23] | 2004 | Germany | 500 | 20 | Enercon E-40 | ON | 55 | 40.3 | No | 38 | PA | MCTO | 4.52 | 0.02 | 0.4 | |
| [23] | 2004 | Germany | 500 | 20 | Enercon E-40 | ON | 65 | 40.3 | No | 53 | PA | MCTO | 8.80 | 0.03 | 0.5 | |
| [23] | 2004 | Germany | 1500 | 20 | Enercon E-40 | ON | 67 | 66 | No | 32 | PA | MCTO | 3.15 | 0.02 | 0.3 | |
| [23] | 2004 | Germany | 1500 | 20 | Enercon E-40 | ON | 67 | 66 | No | 40 | PA | MCTO | 5.05 | 0.02 | 0.4 | |
| [23] | 2004 | Germany | 1500 | 20 | Enercon E-66 | ON | 67 | 66 | No | 52 | PA | MCTO | 8.41 | 0.03 | 0.5 | |
| [24] | 2004 | Germany | 5000 | 20 | Repower Systems AG | OFF | 95 | 126.5 | 9.2 | No | 50 | PA | MTCOD | 21.31 | 0.7 | 0.3 |
| [25] | 2004 | Germany | 500 | Enercon E40 | ON | 44 | 40.3 | 7.5 | No | PA-I/O | MTCOD | 0.12 | ||||
| [25] | 2004 | Germany | 500 | Enercon E40 | ON | 55 | 40.3 | 7.5 | No | PA-I/O | MTCOD | 0.13 | ||||
| [25] | 2004 | Germany | 500 | Enercon E40 | ON | 55 | 40.3 | 7.5 | No | PA-I/O | MTCOD | 0.16 | ||||
| [25] | 2004 | Germany | 500 | Enercon E40 | ON | 55 | 40.3 | 7.5 | No | PA-I/O | MTCOD | 0.21 | ||||
| [25] | 2004 | Germany | 500 | Enercon E40 | ON | 65 | 40.3 | 7.5 | No | PA-I/O | MTCOD | 0.20 | ||||
| [25] | 2004 | Germany and Brazil | 500 | Enercon E40 | ON | 44 | 40.3 | 7.5 | No | PA-I/O | MTCOD | 0.04 | ||||
| [25] | 2004 | Germany and Brazil | 500 | Enercon E40 | ON | 55 | 40.3 | 7.5 | No | PA-I/O | MTCOD | 0.05 | ||||
| [25] | 2004 | Germany and Brazil | 500 | Enercon E40 | ON | 55 | 40.3 | 7.5 | No | PA-I/O | MTCOD | 0.06 | ||||
| [25] | 2004 | Germany and Brazil | 500 | Enercon E40 | ON | 55 | 40.3 | 7.5 | No | PA-I/O | MTCOD | 0.08 | ||||
| [25] | 2004 | Germany and Brazil | 500 | Enercon E40 | ON | 65 | 40.3 | 7.5 | No | PA-I/O | MTCOD | 0.08 | ||||
| [25] | 2004 | Germany and Brazil | 500 | Enercon E40 | ON | 44 | 40.3 | 7.5 | No | PA-I/O | MTCOD | 0.04 | ||||
| [25] | 2004 | Germany and Brazil | 500 | Enercon E40 | ON | 55 | 40.3 | 7.5 | No | PA-I/O | MTCOD | 0.04 | ||||
| [25] | 2004 | Germany and Brazil | 500 | Enercon E40 | ON | 55 | 40.3 | 7.5 | No | PA-I/O | MTCOD | 0.05 | ||||
| [25] | 2004 | Germany and Brazil | 500 | Enercon E40 | ON | 55 | 40. | 7.5 | No | PA-I/O | MTCOD | 0.06 | ||||
| [25] | 2004 | Germany and Brazil | 500 | Enercon E40 | ON | 65 | 40. | 7.5 | No | PA-I/O | MTCOD | 0.06 | ||||
| [25] | 2004 | Brazil | 500 | Enercon E40 | ON | 44 | 40.3 | 7.5 | No | PA-I/O | MTCOD | 0.03 | ||||
| [25] | 2004 | Brazil | 500 | Enercon E40 | ON | 55 | 40.3 | 7.5 | No | PA-I/O | MTCOD | 0.03 | ||||
| [25] | 2004 | Brazil | 500 | Enercon E40 | ON | 55 | 40.3 | 7.5 | No | PA-I/O | MTCOD | 0.04 | ||||
| [25] | 2004 | Brazil | 500 | Enercon E40 | ON | 55 | 40.3 | 7.5 | No | PA-I/O | MTCOD | 0.05 | ||||
| [25] | 2004 | Brazil | 500 | Enercon E40 | ON | 65 | 40.3 | 7.5 | No | PA-I/O | MTCOD | 0.05 | ||||
| [25] | 2004 | Brazil | 500 | Enercon E40 | ON | 44 | 40.3 | 7.5 | No | PA-I/O | MTCOD | 0.03 | ||||
| [25] | 2004 | Brazil | 500 | Enercon E40 | ON | 55 | 40.3 | 7.5 | No | PA-I/O | MTCOD | 0.03 | ||||
| [25] | 2004 | Brazil | 500 | Enercon E40 | ON | 55 | 40.3 | 7.5 | No | PA-I/O | MTCOD | 0.03 | ||||
| [25] | 2004 | Brazil | 500 | Enercon E-40 | ON | 55 | 40.3 | 7.5 | No | PA-I/O | MTCOD | 0.04 | ||||
| [25] | 2004 | Brazil | 500 | Enercon E-40 | ON | 65 | 40.3 | 7.5 | No | PA-I/O | MTCOD | 0.04 | ||||
| [26] | 2004 | Denmark | 2000 | 20 | ON | 78 | Yes | 32.2 | PA | 6.54 | 0.03 | 0.6 | ||||
| [26] | 2004 | Denmark | 2000 | 20 | OFF | 60 | Yes | 46.2 | PA | 10.93 | 0.04 | 0.8 | ||||
| [27] | 2005 | Japan | 300 | 30 | N/A | No | 20 | PA-I/O | CMO | 6.41 | 0.03 | 1.0 | ||||
| [27] | 2005 | Japan | 400 | 30 | N/A | No | 20 | PA-I/O | CMO | 9.32 | 0.05 | 1.5 | ||||
| [22] | 2005 | Canada | 20 | N/A | No | N/A | 0.03 | 0.2 | ||||||||
| [22] | 2005 | Canada | 20 | N/A | No | N/A | 0.03 | 0.2 | ||||||||
| [22] | 2005 | Canada | 20 | N/A | No | N/A | 0.03 | 0.2 | ||||||||
| [28] | 2006 | Italy | 7260 | 20 | ON | 55 | 50 | Yes | I/O | MTCOD | 0.05 | 1.0 | ||||
| [29] | 2006 | Germany | 1500 | N/A | No | N/A | MTCOD | 0.03 | ||||||||
| [29] | 2006 | Germany | 1500 | ON | No | N/A | MCOTD | 0.03 | ||||||||
| [29] | 2006 | Germany | 2500 | N/A | No | N/A | MTCOD | 0.03 | ||||||||
| [29] | 2006 | Germany | 2500 | OFF | No | N/A | MCOTD | 0.03 | ||||||||
| [30] | 2006 | 3000 | 20 | N/A | No | 30.0 | N/A | 1.01 | 0.01 | 0.1 | ||||||
| [31] | 2006 | Denmark | 1650 | 20 | ON | No | 39.0 | PA | 7.38 | 0.03 | 0.6 | |||||
| [31] | 2006 | Denmark | 3000 | 20 | OFF | 80 | Yes | 54.2 | PA | 9.66 | 0.03 | 0.6 | ||||
| [32] | 2008 | Taiwan | 1750 | 20 | N/A | 60 | 60 | Yes | 42.6 | N/A | 2.46 | 0.01 | 0.2 | |||
| [32] | 2008 | Taiwan | 660 | 20 | N/A | 45 | 47 | Yes | 18.9 | N/A | 2.94 | 0.02 | 0.5 | |||
| [32] | 2008 | Taiwan | 600 | 20 | N/A | 46 | 43.7 | Yes | 30.9 | N/A | 2.99 | 0.02 | 0.3 | |||
| [28] | 2008 | Italy | 660 | 20 | ON | 55 | 50 | Yes | 19.0 | N/A | 6.39 | 0.06 | 1.1 | |||
| [33] | 2009 | Spain | 2000 | 20 | N/A | No | 22.8 | N/A | 4.18 | 0.03 | 0.6 | |||||
| [34] | 2009 | 5000 | 20 | OFF | 100 | 116 | No | 53.0 | PA | 1.39 | 0.05 | 1.1 | ||||
| [35] | 2009 | France | 0.25 | 20 | N/A | No | 5.5 | N/A | 11.32 | 0.33 | 6.6 | |||||
| [35] | 2009 | France | 4500 | 20 | N/A | 124 | 113 | No | 30.0 | N/A | 15.59 | 0.08 | 1.6 | |||
| [36] | 2009 | 3000 | 20 | N/A | 80 | 90 | No | 33.0 | PA-I/O | 28.08 | 0.13 | 2.7 | ||||
| [36] | 2009 | 850 | 20 | N/A | 60 | 52 | No | 34.0 | PA-I/O | 34.57 | 0.16 | 3.2 | ||||
| [37] | 2009 | Canada | 0.4 | 20 | Air-X micro turbine | ON | 30 | 1.17 | No | 16.1 | PA | MTCBaO | 101.64 | 1.00 | 20.0 | |
| [38] | 2009 | New Zealand | 1.5 | 20 | 1.5 kW Swift turbine | ON | 2 | 5.5–6.3 | No | 4.0 | PA | MTCOD | 13.81 | 0.55 | 10.9 | |
| [38] | 2009 | New Zealand | 1.5 | 20 | 1.5 kW Swift turbine | ON | 2 | 5.5–6.3 | No | 6.4 | PA | MTCOD | 13.81 | 0.34 | 6.8 | |
| [39] | 2011 | China | 1250 | 20 | ON | 68 | 64 | 6.3 | Yes | 25.0 | N/A | 7.37 | 0.05 | 0.9 | ||
| [40] | 2011 | China | 1250 | 20 | ON | 68 | 64 | Yes | 24.9 | PA-I/O | 7.37 | 0.05 | 0.9 | |||
| [41] | 2011 | Denmark | 3000 | 20 | VI12 | ON | 84 | No | 43.4 | PA | 9.12 | 0.03 | 0.7 | |||
| [41] | 2011 | Denmark | 2000 | 20 | V-80 | ON | 80 | No | 47.2 | PA | 10.42 | 0.04 | 0.7 | |||
| [41] | 2011 | Denmark | 2000 | 20 | V-90 | ON | 80 | No | 35.7 | PA | 10.70 | 0.05 | 1.0 | |||
| [41] | 2011 | Denmark | 1800 | 20 | V100 | N/A | No | 42.5 | PA | 11.85 | 0.04 | 0.9 | ||||
| [42] | 2011 | Germany | 5000 | 20 | 6 RePower 5M and 6 | OFF | Yes | 44.5 | N/A | 38.33 | 0.14 | 2.7 | ||||
| [43] | 2011 | Europe | 2300 | 20 | Multibrid M5000 Enercon E-82 E2 | ON | 97 | No | 25.3 | PA | MCTGOD | 4.51 | 0.03 | 0.6 | ||
| [43] | 2011 | Europe | 2300 | 20 | Enercon E-82 E2 | ON | No | 29.2 | PA | MCTGOD | 4.51 | 0.02 | 0.5 | |||
| [43] | 2011 | Europe | 2300 | 20 | Enercon E-82 E2 | ON | No | 36.5 | PA | MCTGOD | 4.51 | 0.02 | 0.4 | |||
| [44] | 2012 | 1800 | 20 | N/A | Yes | 28.0 | N/A | 4.22 | 0.02 | 0.4 | ||||||
| [44] | 2012 | 2000 | 20 | N/A | No | 34.0 | N/A | 7.04 | 0.03 | 0.7 | ||||||
| [45] | 2012 | Canada | 100 | 25 | N/A | 37 | 21 | Yes | 24.0 | N/A | 7.06 | 0.04 | 0.9 | |||
| [45] | 2012 | Canada | 20 | 25 | N/A | 36.7 | 9.45 | Yes | 22.0 | N/A | 10.85 | 0.06 | 1.5 | |||
| [45] | 2012 | Canada | 5 | 25 | N/A | 36.6 | 5.5 | Yes | 23.0 | N/A | 21.64 | 0.12 | 2.9 | |||
| [44] | 2012 | 1800 | 20 | 1.8 MW gearless | ON | 105 | 90 | 7.4 | Yes | 20.7 | PA | MTCGOD | 7.82 | 0.06 | 1.2 | |
| [44] | 2012 | 2000 | 20 | 2.0 MW geared | ON | 65 | 70 | 6 | No | 34.1 | PA | MTCGOD | 3.80 | 0.02 | 0.4 | |
| [45] | 2012 | Canada | 5 | 25 | Endurance (EN) 5 kW | ON | 36.6 | 5.5 | No | 23.3 | PA | MTCGOD | 77.90 | 0.42 | 10.6 | |
| [45] | 2012 | Canada | 100 | 25 | Northern Power (NP) l00 kW | ON | 37 | 21 | No | 22.4 | PA | MTCGOD | 39.07 | 0.22 | 5.5 | |
| [46] | 2012 | UK | 5000 | 20 | NREL 5 MW | OFF | 90 | 126 | No | 46.0 | PA | MTCGOD | 0.00 | 1.6 | ||
| [46] | 2012 | UK | 5000 | 20 | NREL 5 MW | OFF | 90 | 126 | No | 46.0 | PA | MTCGOD | 0.00 | 1.8 | ||
| [46] | 2012 | UK | 5000 | 20 | NREL 5 MW | OFF | 90 | 126 | No | 46.0 | PA | MTCGOD | 0.00 | 2.7 | ||
| [46] | 2012 | UK | 5000 | 20 | NREL 5 MW | OFF | 90 | 126 | No | 46.0 | PA | MTCGOD | 0.00 | 2.2 | ||
| [46] | 2012 | UK | 5000 | 20 | NREL 5 MW | OFF | 90 | 126 | No | 46.0 | PA | MTCGOD | 0.00 | 1.7 | ||
| [46] | 2012 | UK | 5000 | 20 | NREL 5 MW | OFF | 90 | 126 | No | 46.0 | PA | MTCGOD | 0.00 | 1.5 | ||
| [46] | 2012 | Norway | 2300 | 20 | ON | Yes | 33.9 | PA | MTCGOD | 0.00 | 1.0 | |||||
| [46] | 2012 | Norway | 2300 | 20 | ON | Yes | 33.9 | PA | MTCGOD | 0.00 | 1.0 | |||||
| [46] | 2012 | Norway | 2300 | 20 | ON | Yes | 33.9 | PA | MTCGOD | 0.00 | 1.0 | |||||
| [46] | 2012 | Norway | 2300 | 20 | ON | Yes | 33.9 | PA | MTCGOD | 0.00 | 0.8 | |||||
| [46] | 2012 | Norway | 750 | 20 | ON | Yes | 24.4 | PA | MTCGOD | 0.00 | 1.4 | |||||
| [46] | 2012 | Norway | 750 | 20 | ON | Yes | 24.4 | PA | MTCGOD | 0.00 | 1.4 | |||||
| [46] | 2012 | Norway | 750 | 20 | ON | Yes | 24.4 | PA | MTCGOD | 0.00 | 1.3 | |||||
| [47] | 2013 | Turkey | 330 | 20 | N/A | 50 | 33 | 13 | N/A | 16.3 | PA | MCT | 15.24 | 0.15 | 3.0 | |
| [47] | 2013 | Turkey | 330 | 20 | N/A | 80 | 33 | 13 | N/A | 21.0 | PA | 0 | 0.00 | 2.8 | ||
| [47] | 2013 | Turkey | 330 | 20 | N/A | 100 | 33 | 13 | N/A | 25.8 | PA | 0 | 0.00 | 2.5 | ||
| [47] | 2013 | Turkey | 500 | 20 | N/A | 50 | 48 | 12 | N/A | 15.8 | PA | 0 | 0.00 | 2.9 | ||
| [47] | 2013 | Turkey | 500 | 20 | N/A | 80 | 48 | 12 | N/A | 20.6 | PA | 0 | 0.00 | 2.4 | ||
| [47] | 2013 | Turkey | 500 | 20 | N/A | 100 | 48 | 12 | N/A | 23.1 | PA | 0 | 0.00 | 2.3 | ||
| [47] | 2013 | Turkey | 810 | 20 | N/A | 50 | 53 | 13 | N/A | 16.6 | PA | 0 | 0.00 | 2.0 | ||
| [47] | 2013 | Turkey | 810 | 20 | N/A | 80 | 53 | 13 | N/A | 21.3 | PA | 0 | 0.00 | 1.6 | ||
| [47] | 2013 | Turkey | 810 | 20 | N/A | 100 | 53 | 13 | N/A | 23.5 | PA | 0 | 0.00 | 1.5 | ||
| [47] | 2013 | Turkey | 2050 | 20 | N/A | 50 | 82 | 13 | N/A | 15.3 | PA | 0 | 0.00 | 1.5 | ||
| [47] | 2013 | Turkey | 2050 | 20 | N/A | 80 | 82 | 13 | N/A | 19.8 | PA | 0 | 0.00 | 1.3 | ||
| [47] | 2013 | Turkey | 2050 | 20 | N/A | 100 | 82 | 13 | N/A | 22.1 | PA | 0 | 8.46 | 0.06 | 1.2 | |
| [47] | 2013 | Turkey | 3020 | 20 | N/A | 50 | 82 | 17 | N/A | 10.3 | PA | 0 | 0.00 | 2.3 | ||
| [47] | 2013 | Turkey | 3020 | 20 | N/A | 80 | 82 | 17 | N/A | 13.5 | PA | 0 | 0.00 | 1.8 | ||
| [47] | 2013 | Turkey | 3020 | 20 | N/A | 100 | 82 | 17 | N/A | 15.1 | PA | 0 | 0.00 | 1.8 | ||
| [48] | 2013 | UK | 6 | 20 | ON | 9 | 5.5 | 5 | no | 14.8 | PA | MTCGOD | 29.90 | 0.32 | 6.4 | |
| [48] | 2013 | UK | 6 | 20 | ON | 9 | 5.5 | 5 | no | 18.3 | PA | MTCGOD | 29.90 | 0.26 | 5.2 | |
| [48] | 2013 | UK | 6 | 20 | ON | 9 | 5.5 | 5 | no | 19.0 | PA | MTCGOD | 29.90 | 0.25 | 5.0 | |
| [48] | 2013 | UK | 6 | 20 | ON | 9 | 5.5 | 5 | no | 21.7 | PA | MTCGOD | 29.90 | 0.22 | 4.4 | |
| [48] | 2013 | UK | 6 | 20 | ON | 9 | 5.5 | 5 | no | 24.0 | PA | MTCGOD | 29.90 | 0.20 | 4.0 | |
| [48] | 2013 | UK | 6 | 20 | ON | 9 | 5.5 | 5 | no | 27.4 | PA | MTCGOD | 29.90 | 0.17 | 3.5 | |
| [48] | 2013 | UK | 6 | 20 | ON | 9 | 5.5 | 5 | no | 30.8 | PA | MTCGOD | 29.90 | 0.15 | 3.1 | |
| [48] | 2013 | UK | 6 | 20 | ON | 9 | 5.5 | 5 | no | 34.2 | PA | MTCGOD | 29.90 | 0.14 | 2.8 | |
| [11] | 2013 | Michigan | 3000 | 20 | Vestas VI12-3.0 MW | OFF | 100 | No | 28.2 | PA | MTCGOD | 29.00 | 0.16 | 3.3 | ||
| [11] | 2013 | Michigan | 3000 | 20 | Vestas VI12-3.0 MW | OFF | 100 | No | 30.1 | PA | MTCGOD | 20.97 | 0.11 | 2.2 | ||
| [11] | 2013 | Michigan | 3000 | 20 | Vestas VI12-3.0 MW | OFF | 100 | No | 30.8 | PA | MTCGOD | 31.80 | 0.16 | 3.3 | ||
| [11] | 2013 | Michigan | 3000 | 20 | Vestas VI12-3.0 MW | OFF | 100 | No | 31.6 | PA | MTCGOD | 34.47 | 0.17 | 3.5 | ||
| [11] | 2013 | Michigan | 3000 | 20 | Vestas VI12-3.0 MW | OFF | 100 | No | 32.7 | PA | MTCGOD | 31.33 | 0.15 | 3.0 | ||
| [11] | 2013 | Michigan | 3000 | 20 | Vestas VI12-3.0 MW | OFF | 100 | No | 31.0 | PA | MTCGOD | 19.93 | 0.10 | 2.0 | ||
| [11] | 2013 | Michigan | 3000 | 20 | Vestas VI12-3.0 MW | OFF | 100 | No | 33.3 | PA | MTCGOD | 27.30 | 0.13 | 2.6 | ||
| [11] | 2013 | Michigan | 3000 | 20 | Vestas VI12-3.0 MW | OFF | 100 | No | 34.4 | PA | MTCGOD | 28.33 | 0.13 | 2.6 | ||
| [11] | 2013 | Michigan | 3000 | 20 | Vestas VI12-3.0 MW | OFF | 100 | No | 34.8 | PA | MTCGOD | 29.37 | 0.13 | 2.7 | ||
| [11] | 2013 | Michigan | 3000 | 20 | Vestas VI12-3.0 MW | OFF | 100 | No | 35.2 | PA | MTCGOD | 31.37 | 0.14 | 2.8 | ||
| [11] | 2013 | Michigan | 3000 | 20 | Vestas VI12-3.0 MW | OFF | 100 | No | 31.2 | PA | MTCGOD | 19.90 | 0.10 | 2.0 | ||
| [11] | 2013 | Michigan | 3000 | 20 | Vestas VI12-3.0 MW | OFF | 100 | No | 32.5 | PA | MTCGOD | 32.50 | 0.16 | 3.2 | ||
| [11] | 2013 | Michigan | 3000 | 20 | Vestas VI12-3.0 MW | OFF | 100 | No | 34.2 | PA | MTCGOD | 28.30 | 0.13 | 2.6 | ||
| [11] | 2013 | Michigan | 3000 | 20 | Vestas VI12-3.0 MW | OFF | 100 | No | 34.6 | PA | MTCGOD | 29.33 | 0.13 | 2.7 | ||
| [11] | 2013 | Michigan | 3000 | 20 | Vestas VI12-3.0 MW | OFF | 100 | No | 35.2 | PA | MTCGOD | 31.37 | 0.14 | 2.8 | ||
| [11] | 2013 | Michigan | 3000 | 20 | Vestas VI12-3.0 MW | OFF | 100 | No | 29.3 | PA | MTCGOD | 29.07 | 0.16 | 3.1 | ||
| [11] | 2013 | Michigan | 3000 | 20 | Vestas VI12-3.0 MW | OFF | 100 | No | 30.3 | PA | MTCGOD | 20.93 | 0.11 | 2.2 | ||
| [11] | 2013 | Michigan | 3000 | 20 | Vestas VI12-3.0 MW | OFF | 100 | No | 30.4 | PA | MTCGOD | 31.10 | 0.16 | 3.2 | ||
| [11] | 2013 | Michigan | 3000 | 20 | Vestas VI12-3.0 MW | OFF | 100 | No | 30.8 | PA | MTCGOD | 32.10 | 0.17 | 3.3 | ||
| [11] | 2013 | Michigan | 3000 | 20 | Vestas VI12-3.0 MW | OFF | 100 | No | 31.2 | PA | MTCGOD | 36.57 | 0.19 | 3.7 | ||
| [49] | 2013 | India | 1650 | 20 | ON | 75 | Yes | 21.0 | PA-I/O | MTCGOD | 7.40 | 0.06 | 1.1 | |||
| [50] | 2013 | USA | 1800 | 26 | Vestas V90 turbine | ON | 6.5–7 | Yes | 24.5 | PA | MCTGO | 0.00 | 1.0 | |||
| [9] | 2013 | Europe | 3000 | 20 | Vestas V90-3.0 MW | ON | 80 | 100 | 9.25 | No | 41.3 | PA | MCTGOD | 5.79 | 0.02 | 0.4 |
| [51] | 2013 | Europe | 2600 | 20 | Vestas V100-2.6 MW | ON | 80 | 90 | 8 | No | 38.4 | PA | MCTGOD | 6.73 | 0.03 | 0.6 |
| [52] | 2013 | Germany | 5000 | 20 | Repower 5M and Multibrid M5000 | OFF | Yes | 46.2 | PA | MCOD | 38.33 | 0.13 | 2.2 | |||
| [53] | 2013 | China | 1500 | 20 | N/A | No | 25.8 | PA | MCTGOD | 5.49 | 0.03 | 0.7 | ||||
| [54] | 2014 | Thailand | 0.3 | 20 | 300 W vertical axis | ON | 36 | 0.25 | 12 | No | 4.3 | PA | MTCOD | 1.77 | 0.07 | 1.3 |
| [54] | 2014 | Thailand | 0.3 | 20 | 300 W vertical axis | ON | 30 | 0.25 | No | 5.3 | PA | MTCOD | 1.77 | 0.05 | 1.1 | |
| [54] | 2014 | Thailand | 0.3 | 20 | 300 W vertical axis | ON | 30 | 0.25 | No | 20.5 | PA | MTCOD | 1.77 | 0.01 | 0.3 | |
| [54] | 2014 | Thailand | 0.5 | 20 | 500 W horizontal axis | ON | 36 | 1.7 | 12 | No | 5.8 | PA | MTCOD | 1.18 | 0.03 | 0.6 |
| [54] | 2014 | Thailand | 0.5 | 20 | 500 W horizontal axis | ON | 30 | 1.7 | No | 7.2 | PA | MTCOD | 1.18 | 0.03 | 0.5 | |
| [54] | 2014 | Thailand | 0.5 | 20 | 500 W horizontal axis | ON | 30 | 1.7 | No | 40.7 | PA | MTCOD | 1.18 | 0.00 | 0.1 | |
| [55] | 2014 | Europe | 3300 | 20 | Vestas V2105-3.3 MW | ON | 72.5 | 105 | 9.25 | No | 47.0 | PA | MCTGOD | 6.58 | 0.02 | 0.4 |
| [56] | 2014 | Europe | 3300 | 20 | Vesta s V117-3.3 MW | ON | 91.5 | 117 | 8 | No | 42.4 | PA | MCTGOD | 6.69 | 0.03 | 0.5 |
| [57] | 2014 | Europe | 3300 | 20 | Vestas V126-3.3 MW | ON | 117 | 126 | 7 | No | 37.2 | PA | MCTGOD | 7.81 | 0.03 | 0.7 |
| [58] | 2015 | Libya | 1650 | 20 | M. TORESS (TWT 1.65/82), 3-bl | ON | 71 | 82 | Yes | 42.4 | PA | MTCGOD | 6.36 | 0.02 | 0.5 | |
| [59] | 2015 | 2100 | 0 | N/A | 70 | 80 | 12 | No | PA | M | 1.56 | 0.00 | 0.0 | |||
| [59] | 2015 | 1600 | 0 | N/A | 65 | 70 | 12 | No | PA | M | 1.77 | 0.00 | 0.0 | |||
| [59] | 2015 | 2700 | 0 | N/A | 80 | 90 | 12 | No | PA | M | 1.57 | 0.00 | 0.0 | |||
| [60] | 2015 | 2000 | 20 | G8X Gamesa onshore wind | ON | 70 | 80 | No | 22.8 | PA | MCGOD | 0.00 | 0.0 | |||
| [61] | 2015 | Russia | 4 | 10 | WPI-5-4 24 blade turbine | ON | 8.22 | 5 | 2 | No | 8.3 | PA | MTCOD | 24.66 | 0.95 | 9.5 |
| [61] | 2015 | Russia | 4 | 10 | WPI-5-4 24 blade turbine | ON | 8.22 | 5 | 3.6 | No | 24.5 | PA | MTCOD | 24.66 | 0.32 | 3.2 |
| [61] | 2015 | Russia | 4 | 10 | WPI-5-4 24 blade turbine | ON | 8.22 | 5 | 5.2 | No | 40.3 | PA | MTCOD | 24.66 | 0.19 | 1.9 |
| [61] | 2015 | Russia | 4 | 10 | WPI-5-4 24 blade turbine | ON | 8.22 | 5 | 6.5 | No | 49.3 | PA | MTCOD | 24.66 | 0.16 | 1.6 |
| [61] | 2015 | Russia | 4 | 10 | WPI-5-4 24 blade turbine - | ON | 8.22 | 5 | 7.8 | No | 56.0 | PA | MTCOD | 24.66 | 0.14 | 1.4 |
| [61] | 2015 | Russia | 4 | 10 | WPI-5-4 24 blade turbine | ON | 8.22 | 5 | 10.3 | No | 73.8 | PA | MTCOD | 24.66 | 0.11 | 1.1 |
| [62] | 2015 | Japan | 1650 | 20 | Vesta V82-1.65 MW | ON | No | 20.0 | PA-I/O | MCGO | 9.98 | 0.08 | 1.6 | |||
| [63] | 2015 | US | 2000 | 20 | Vesta V80-2.0 MW | ON | 78 | No | 32.2 | PA-I/O | MTCO | 14.13 | 0.07 | 1.4 | ||
| [63] | 2015 | US | 2000 | 20 | Vesta V80-2.0 MW | OFF | 60 | No | 46.2 | PA-I/O | MTCO | 10.53 | 0.04 | 0.7 | ||
| [63] | 2015 | US | 3000 | 20 | Vesta V90-3.0 MW | ON | 105 | No | 30.1 | PA-I/O | MTCO | 12.11 | 0.06 | 1.3 | ||
| [63] | 2015 | US | 3000 | 20 | Vesta V90-30 MW | OFF | 80 | No | 53.3 | PA-I/O | MTCO | 9.15 | 0.03 | 0.5 | ||
| [64] | 2015 | Mexico | 2000 | 20 | ON | 80 | No | PA | MCD | 0.67 | 0.00 | 0.0 | ||||
| [64] | 2015 | Mexico | 2000 | 20 | ON | 80 | No | PA | MCD | 0.93 | 0.00 | 0.0 | ||||
| [65] | 2015 | Europe | 2000 | 20 | Vestas V100-2.0 MW | ON | 80 | 100 | 8 | No | 47.9 | PA | MCTGOD | 7.56 | 0.03 | 0.5 |
| [66] | 2015 | Europe | 3300 | 20 | Vestas V112-3.3 MW | ON | 84 | 112 | 8 | No | 40.9 | PA | MCTGOD | 5.74 | 0.02 | 0.4 |
| [67] | 2016 | Denmark | 2000 | 20 | ON | Yes | 32.2 | PA | MTCGOD | 6.55 | 0.03 | 0.6 | ||||
| [67] | 2016 | Denmark | 2000 | 20 | OFF | Yes | 46.2 | PA | MCTGOD | 10.94 | 0.04 | 0.8 |


aTechnology: ON, onshore; OFF, offshore.
bProcess-based analysis (PA), input—output (I/O), or hybrid (PA-I/O).
cAs stated in study: business management (B), manufacture (M), transport (T), construction (C), grid connection (G), operation & maintenance (O), and decommissioning (D).
dNo quality correction between primary and electrical energy.
Appendix B
Table 21.2
Proportion of Cumulative Energy Demand (CED) Made Up by Different Components/percentage
| Component | Unit | [33] | [37] | [39] | [43] | [44] | [44] | [45] | [45] | [45] | [47] | [11] | [11] | [11] | [11] | [9] | [51] | [53] | [55] | [56] | [57] | [63] | [63] | [63] | [63] | [65] | [66] |
| Rotor | [%] | 44.9 | 18.2 | 18.5 | 7.2 | 5.1 | 15.0 | 3.6 | 5.2 | 3.3 | 3.3 | 16.0 | 18.0 | 7.8 | 22.0 | 21.0 | 18.5 | 18.0 | 23.0 | ||||||||
| Nacelle | [%] | 12.8 | 15.9 | 24.6 | 11.0 | 23.6 | 53.7 | 60.4 | 45.0 | 27.0 | 4.3 | 6.2 | 4.0 | 3.9 | 16.0 | 15.0 | 23.5 | 20.0 | 19.0 | 16.5 | 16.0 | 22.5 | |||||
| Tower | [%] | 23.2 | 10.4 | 22.7 | 22.3 | 46.8 | 46.0 | 25.0 | 9.0 | 13.1 | 10.7 | 8.3 | 25.0 | 24.0 | 31.2 | 23.0 | 27.0 | 33.5 | 24.0 | 22.0 | |||||||
| Foundation | [%] | 12.3 | 34.9 | 13.0 | 19.8 | 9.7 | 29.0 | 15.0 | 15.0 | 10.0 | 9.0 | 10.5 | 9.0 | 7.5 | |||||||||||||
| Substation | [%] | 0.4 | 1.0 | 0.2 | |||||||||||||||||||||||
| Energy storage | [%] | 74.3 | 42.7 | 13.6 | 39.9 | 14.0 | 13.0 | 13.0 | 12.0 | 10.0 | 21.0 | 14.0 | |||||||||||||||
| Other buildings | [%] | 1.2 | |||||||||||||||||||||||||
| Transport | [%] | 13.4 | 0.7 | 2.0 | 7.0 | 7.0 | 1.0 | 38.2 | 11.5 | 11.3 | 13.7 | 0.4 | 32.5 | 38.0 | 39.0 | 44.0 | |||||||||||
| O&M | [%] | 6.9 | 6.0 | 7.0 | 5.5 | 5.5 | 3.7 | 26.0 | 15.1 | 1.0 | 15.1 | 26.2 | 19.6 | 27.5 | 7.0 | 7.0 | 5.0 | 4.0 | 4.0 | 6.5 | 5.5 | 3.0 | 3.0 | 6.0 | 5.0 | ||
| Disposal | [%] | 28.7 | 1.0 | 3.1 | 3.1 | 49.4 | 44.5 | 35.8 | 23.1 | 8.7 | 8.7 | 10.3 | 20.0 | 20.0 | 46.7 | 22.2 | 33.3 | 33.3 | 33.3 | 25.0 |
