
Reliability of Wind Turbines
Shuangwen Sheng1, Ryan O’Connor2, 1National Renewable Energy Laboratory, Golden, CO, United States, 2eDF Renewable Energy, Denver, CO, United States Email: 1[email protected]
Abstract
The global wind industry has witnessed exciting developments in recent years. The future will be even brighter with further reductions in capital and operation and maintenance costs, which can be accomplished with improved turbine reliability, especially when turbines are installed offshore. One opportunity for the industry to improve wind turbine reliability is through the exploration of reliability engineering life data analysis based on readily available data or maintenance records collected at typical wind plants. If adopted and conducted appropriately, these analyses can quickly save operation and maintenance costs in a potentially impactful manner. This chapter discusses wind turbine reliability by highlighting the methodology of reliability engineering life data analysis. It first briefly discusses fundamentals for wind turbine reliability and the current industry status. Then, the reliability engineering method for life analysis, including data collection, model development, and forecasting, is presented in detail and illustrated through two case studies. The chapter concludes with some remarks on potential opportunities to improve wind turbine reliability. An owner and operator’s perspective is taken and mechanical components are used to exemplify the potential benefits of reliability engineering analysis to improve wind turbine reliability and availability.
Keywords
Wind turbine; reliability; life data analysis
15.1 Introduction
Modern utility-scale wind turbines are complex systems that include both hardware components—structural, mechanical, electrical, thermal, and hydraulic—and software components. They are designed to convert kinetic energy from wind to electrical power for 20–25 years. The development of modern large wind turbines dates back to the 1970s and 1980s and has expanded dramatically during the past few decades with the global cumulative installed wind power generation capacity reaching 430 gigawatts (GW) by the end of 2015 [1,2]. The evolution, however, has been profoundly influenced by reliability and availability issues [2], ranging from structural collapses in the early prototypes to the recent premature component failures on commercial wind turbines. The encouraging fact is that nowadays most modern land-based wind turbines can achieve an availability of about 98% and mean time between failures (MTBFs) of more than 7000 hours, implying a failure rate of a little over 1 failure(s)/turbine per year [2]. The challenge is a few overhauls or replacements of major components are normally needed, throughout the design life of a modern wind turbine, despite the fact that structural components, such as the foundation and tower, can normally last longer. These overhauls or replacements of major components which are infrequent but typically associated with long downtime, compounded with frequent failures of other components that have short downtime, lead to increased operation and maintenance (O&M) costs of wind turbines and subsequently, the cost of energy (COE) for wind power. The cost can increase as wind turbines age and become much higher for offshore wind plants. Based on European experience, on average, the availability of offshore wind plants is about 7% lower than land-based plants [3], and the O&M costs for an offshore wind plant are twice the cost of a land-based plant [4]. As a result, there is a clear need for the wind industry to improve reliability and reduce O&M costs, especially when turbines are installed offshore.
There are a few different factors to consider when improving turbine reliability and reducing O&M costs, such as design [5], testing [6], and O&M [7]. The wind turbine application is uniquely featured by a stochastic duty cycle, which is similar to automotive applications, and an expected long asset lifetime, which is more similar to aerospace applications. It is also characterized by difficult access, remote and regional resources, strained supply chains, and new functional requirements. The majority of wind turbine components are designed to be dependable and have no redundancy. For example, a typical wind turbine has about 5000 parts, which can lead to around half a million possible turbine failures at a wind plant with 100 turbines. Current turbine design standards focus on component survival against damage from hazards throughout a turbine design lifetime. This is compounded by the use of custom parts, and designer’s behaviors are driven by certification, not regulation. Reliability demonstration is difficult as specific designs and parts become obsolete. Reputation of a turbine technology also has an influence, which is supported by anecdotes, analysis, witness to failures, and reporting. Oftentimes severe events are overstated. A lack of reliability increases capital expenditures through overdesign, excessive prototyping and testing, and warranty and insurance requirements; increases financing costs due to uncertainties, operational expenditures from both scheduled and unscheduled events; and reduces annual energy production.
Once turbines are installed in a wind plant, the main opportunity for COE reduction lies in improvement of O&M practices, which is the perspective taken in this chapter. The intention of this chapter is to highlight the current reliability statistics of wind turbines, and present the opportunities for the wind industry O&M to benefit from reliability engineering, such as warranty, maintenance, supply-chain, and risk management. The motivation is that reliability engineering is ready to be widely adopted and practiced by the wind industry and it can help reduce O&M costs without much delay. The authors hope that the materials presented in this chapter can help stimulate the integration of reliability engineering methods by the global wind industry and benefit O&M. This chapter is not intended to provide a comprehensive discussion on wind turbine reliability or O&M practice improvements through condition-based maintenance or prognostics and health management, for which the audience can refer to such books as Ref. [2].
Given that wind turbines have various types of components, a wind turbine reliability evaluation needs to consider them accordingly. However, this chapter focuses on mechanical components and uses them to demonstrate the potential benefits of reliability engineering to wind. In addition, different sectors of the wind industry may have different interests in terms of wind turbine reliability. For example, manufacturers may be more interested in improving wind turbine reliability through design improvements; whereas owners and operators may be more interested in improving wind turbine reliability through O&M practice enhancements. This chapter takes the owners’ and operators’ perspective, focusing on reliability analyses to determine efficient maintenance practices [8]. Specifically, failure analysis identifies certain component failure rates and life characteristics over time or operating conditions to help determine maintenance or component replacement intervals. If root causes for certain failures were identified, these failure modes could be mitigated through either O&M practices or replacements with improved products. Another type of practice, such as failure-mode-effect-criticality analysis (FMECA), performed for product design or improvements, can also be conducted to benefit O&M [9].
In the next few sections, a brief discussion on terminology and reliability metrics is provided. Then, the current status of wind turbine reliability is presented. Next, the reliability life data analysis that can potentially benefit wind plant O&M, including data collection, model development, and forecasting, is discussed. Two case studies are then presented to illustrate how the life data analysis can be utilized to benefit wind plant O&M. The chapter concludes with some final remarks on potential opportunities to improve wind turbine reliability.
15.2 Fundamentals
15.2.1 Terminology
15.2.1.1 Reliability
Reliability is the probability that a product or a system will perform its intended functions satisfactorily (i.e., without failure and within specified performance limits) for a specified length of time, when operating under specified environmental and usage conditions [10]. Depending on the perspective, reliability can be inherent as designed and manufactured or operational as observed in the field [11]. To use wind turbines as the context, the product or system can be a wind turbine or a turbine component. The specified length of time is normally treated as the design life of 20–25 years for a wind turbine, which only specifies the duration and is not a complete reliability statement. Two other factors in the definition are to perform intended functions and under specified conditions. Reliability is a probability that changes if the application or design is changed. When wind turbine reliability is discussed, often it is based on anecdotes, not thorough and systematic life analyses using data collected from the field. A failure occurs when the intended functions of a wind turbine component cannot be performed satisfactorily.
For complex machines like a wind turbine, reliability of the entire turbine is affected by the reliabilities of its subsystems, including both hardware and software, and how those components are connected. When analyzing the reliability of a wind turbine or a wind turbine subsystem like a gearbox, it is recommended to use a comprehensive and normalized grouping of components according to their functions and positions. One method is to use reliability block diagrams [12], which show the functional components and their relationships within a wind turbine. They consider the relationship of all competing and independent failure modes impacting the components on a wind turbine. The reliability of a wind turbine is also affected by environmental conditions, such as wind and wave conditions in offshore wind plants. It is worth noting that improvements in major turbine subsystem or component reliability alone are not sufficient and the impacts of connecting components on reliability also need to be considered. The economies of wind turbines and other independent power generation plants generally prohibit the use of redundant components (This does not include safety equipment.). In addition, low-level actionable components in wind turbines are generally nonrepairable, implying when failed, the components cannot be repaired without a maintenance intervention. All components must function for the wind turbine to generate electricity. This dependency on all turbine subsystems and components negatively impacts the reliability of a wind turbine as it leads to lower system reliability than individual component reliability. For more information on system and component reliability, please refer to Chapter 6 in Ref. [13].
15.2.1.2 Metrics
To evaluate the reliability of a wind turbine, its major turbine components normally need to be grouped into three categories: structural, electrical, and mechanical. The reason for this grouping is because they typically need different reliability evaluation metrics and methods. For structural components, such as the blades, tower, and foundation, the probability of failure can be used as the metric and evaluated using structural reliability theory [14,15]. For electrical and mechanical components, their life is assumed to follow the classical bathtub curve. Its failure rate, λ, is a very popular measure, which is normally treated as the inverse of MTBF. These metrics can be calculated using classical reliability theory [13]. Some work on wind turbine reliability evaluation by integrating structural subsystems with electrical and mechanical components was reported in Ref. [16]. This chapter focuses on the mechanical components.
Below is a brief list of metrics and expressions that are useful for reliability evaluation, as stated in Chapter 1 of Ref. [2].
• Mean time to failure: MTTF (nonrepairable components)
• Mean time to repair or replacement: MTTR
• Mean time between failure: MTBF=MTTF+MTTR+LDT (repairable systems, such as a wind turbine or a wind turbine gearbox)
(15.1)
(15.2)
The MTTF often is used on nonrepairable turbine components that need to be replaced after they fail. These are often the lowest level actionable components within a wind turbine. For a wind turbine gearbox or the entire turbine, which are both composed of many low-level actionable components, MTBF is more appropriate. Among these metrics, MTBF, or failure rate, and downtime are often used in the wind industry to evaluate relative improvements of turbine reliability. No matter which metric is used, the key is to trend the chosen metric over time. On the other hand, using MTTF or MTBF alone is not sufficient [17] for reliability engineering analysis. When discussing wind turbine reliability within the community of peers, reliability engineers are better served by expressing the reliability in terms of life distributions and parameters, which will be discussed in Section 15.4.
15.2.2 Taxonomy
Different parties may use various sets of taxonomies when talking about wind turbines. In terms of reliability, it is essential to know the taxonomy and chain of dependability in wind turbines. The set of taxonomy introduced by the ReliaWind consortium is adopted in this chapter. It uses a five-level system to describe a wind plant and the definitions include [2]:
• System, which could be the wind plant including wind turbines, substation, and cables
• Subsystem, which could be an individual wind turbine or a substation at the wind plant
• Assembly, which could be the gearbox in a wind turbine or the high-voltage system in the substation
• Subassembly, which could be the high-speed shaft in the gearbox
The set of taxonomy is also helpful when conducting reliability data collection. For more details on this set of taxonomy, please refer to Chapter 11 in Ref. [2]. If cost analysis is also of interest, refer to the land-based and offshore wind plant cost break down structures developed by the National Renewable Energy Laboratory (NREL) in Appendixes E and F of Ref. [18].
15.2.3 Failure Types
Wind turbine components are nonrepairable during operation and function similar to a chain under tension. All components must survive or the turbine fails. The length of the chain is not constant for all wind turbine designs [19]. The chain shown in Fig. 15.1 includes 14 major components common to many modern wind turbines: three blades, three pitch bearings, a hub, main bearing, main shaft, gearbox, generator, main frame, yaw bearing, and tower. Some turbine designs may include more or fewer major components [19].

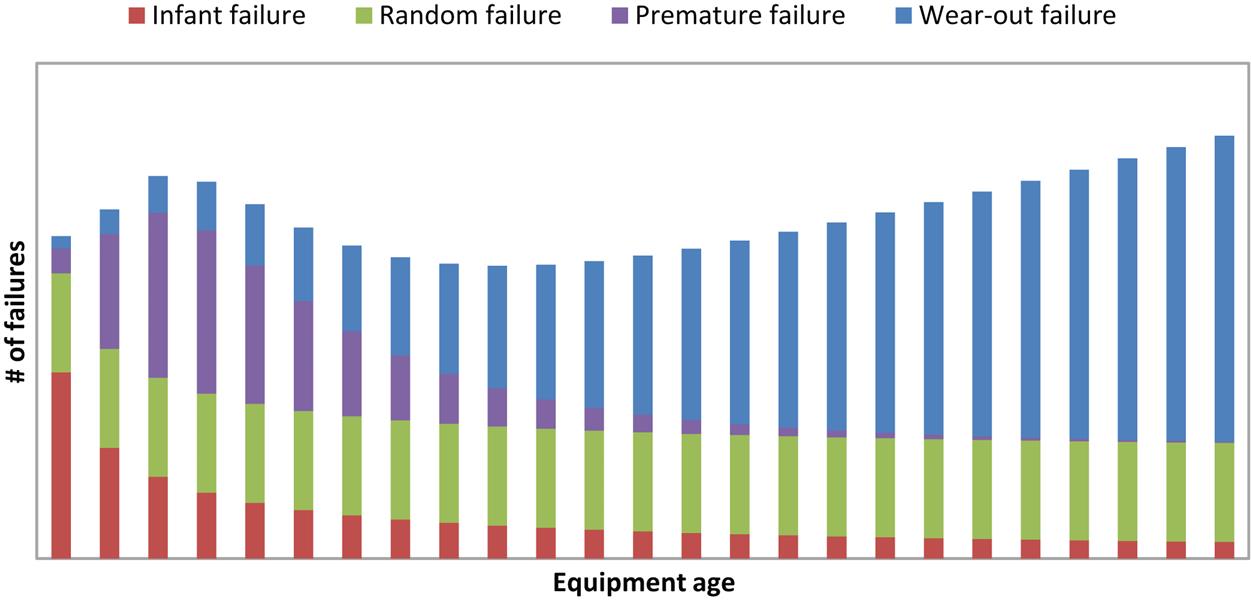
Component life cycle reliability needs to consider all independent failure modes of the component. Wind turbine components commonly suffer from four types of failures: infant, premature, random, and wear out.
Infant failures are those events mostly due to wear-in problems or quality defects from the material manufacturing process. These types of failures are more likely to occur early in life and have a decreasing incidence rate with age. Preventing all infant failures is prohibitively expensive and every turbine manufacturer must allow some defect rate for each component. The allowable defect rate is a function of the manufacturer’s quality management and risk assessment. For wind project owners, the majority of infant failures are mitigated by a supplier warranty. Performing life data analysis on infant failures provides the wind turbine owners with a way to measure the quality management of the supplier and to understand the value of a supplier warranty.
Premature failures include those events due to a latent defect in the design, manufacturing process, or application (including maintenance activities). Premature failures are often detected after some period of operation and may progress to show signs of degradation and wear before functional failures. Axial cracks are a common premature failure of wind turbine gearbox bearings. Corrosion is another premature failure seen on wind turbine components. Premature failures can impact a small or a large portion of an aging turbine population and these failures often disrupt operations like a “bump in the road,” or in extreme cases may be like a “fall from a small cliff.”
Random failures are expected to appear throughout the wind turbine life cycle. These failures are caused mostly by an unlikely string of preceding events, which can be an overload event like a 50 year extreme gust or a lightning strike. The rate of a random failure is constant regardless of the equipment age. As with infant failures, it is prohibitively expensive to overdesign wind turbine components to survive all likely random, extreme failures. Experienced owners and original equipment manufacturers with a large fleet of wind turbines expect some failures due to random strength exceedances. The risk of these random failures is typically mitigated by insurance. Life data analysis of random failures provides wind turbine owners with a method to quantify their wind turbine insurance needs.
As strange as it may sound, wear-out failures are the way in which owners hope wind turbine components fail. If a majority of the failures are wear out, it is likely that the owner has selected a quality manufactured product, operated and maintained the asset effectively, avoided random failures from a host of causes, and finally failed the components by “old age.” This is the ideal way a component will break down at the end of its life and the failure for which the component lifetimes are often specified (e.g., a 20 year design life refers to the classic fatigue wear out of materials). These failures are more likely to happen later in the life cycle and life data analysis of this type of failures helps owners plan for maintenances and spare parts.
Table 15.1 provides a list of failure modes typically seen in major wind turbine assemblies, i.e., gearboxes, blades, pitch bearings (A wind turbine typically has three pitch bearings, which are treated together as an assembly.), and generators, by grouping according to the four failure types discussed earlier. For each failure mode, a failure mechanism is present and needs to be modeled and analyzed [16]. It is clear that reliability analysis of wind turbines can be conducted at different levels, for various components, and on certain failure modes. As a result, when analyzing or discussing wind turbine reliability, it is beneficial to specify as many of the details as possible.
Table 15.1
Typical Failures Seen in Major Turbine Assemblies

The stacked bar plot in Fig. 15.2 shows the relative behavior of these common failure types for a large population of wind turbine equipment, i.e. parts or components. Note that there is a possibility of experiencing any of these types of failures at any time in the life cycle of a large population of wind turbine equipment.
15.3 Current Status
To accurately evaluate the current status of wind turbine reliability, it is necessary to calculate consistent metrics based on data collected through standardized practices, including analysis and reporting. However, these types of metrics, such as MTBF, are typically not easy, if not impossible, to get in the wind industry, especially for relatively older projects. Nevertheless, wind turbine reliability is so critical that there are various benchmarking efforts around the globe. This section gives a brief overview of these efforts, along with a survey of several recent publications, highlighting where the industry is in terms of turbine reliability.
A detailed survey of reliability data collection and analysis efforts was reported in Ref. [20]. It was observed that most efforts in this area were conducted in Europe, represented by Wissenschaftliches Mess- und Evaluierungsprogramm (WMEP) [21], Landwirtschaftskammer Schleswig-Holstein (LWK) [22], VTT [23], Vindstat [24], WindStats [25], and ReliaWind [26]. WMEP was the earliest among these efforts and started in 1989. Similar efforts in the United States were not started until about 2010, represented by Continuous Reliability Enhancement for Wind (CREW) [27], and a project conducted by Det Norske Veritas-Keuring van Elektrotechnische Materialen te Arnhem (DNV KEMA) and Germanischer Lloyd (GL) Garrard Hassan under the sponsorship of NREL [28]. Another effort from the United States is the gearbox failure database [29], which was started as part of the Gearbox Reliability Collaborative [30] project and focuses on gearbox failure modes and possible root causes. One recent data collection and analysis effort in Europe was formed in 2016 and called Wind energy-Information-Data-Pool (WInD-Pool) [31]. It is clear that there are variations among different reliability data collection and analysis efforts and there is a need for the wind industry to develop and adopt a standardized approach. To correctly understand results reported by different data collection efforts, it is necessary to consider the population of turbines each database recorded, including turbine age, technology, site location, etc.
Based on a majority of the European data collection and reporting efforts discussed earlier, Fig. 15.3 shows the compiled downtime contribution from different subsystems [32]. The top three contributors are the power module, drivetrain module, and rotor module, among which drivetrain and rotor modules are typically more expensive to repair due to the crane costs.
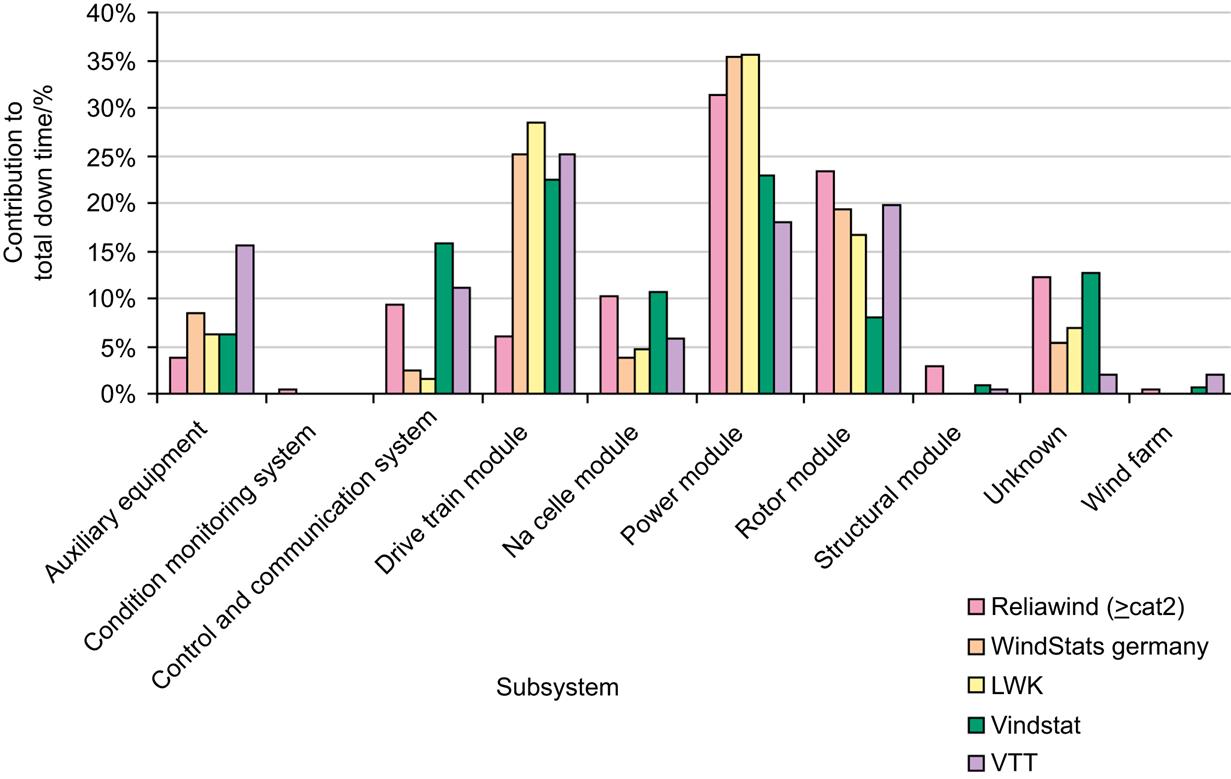
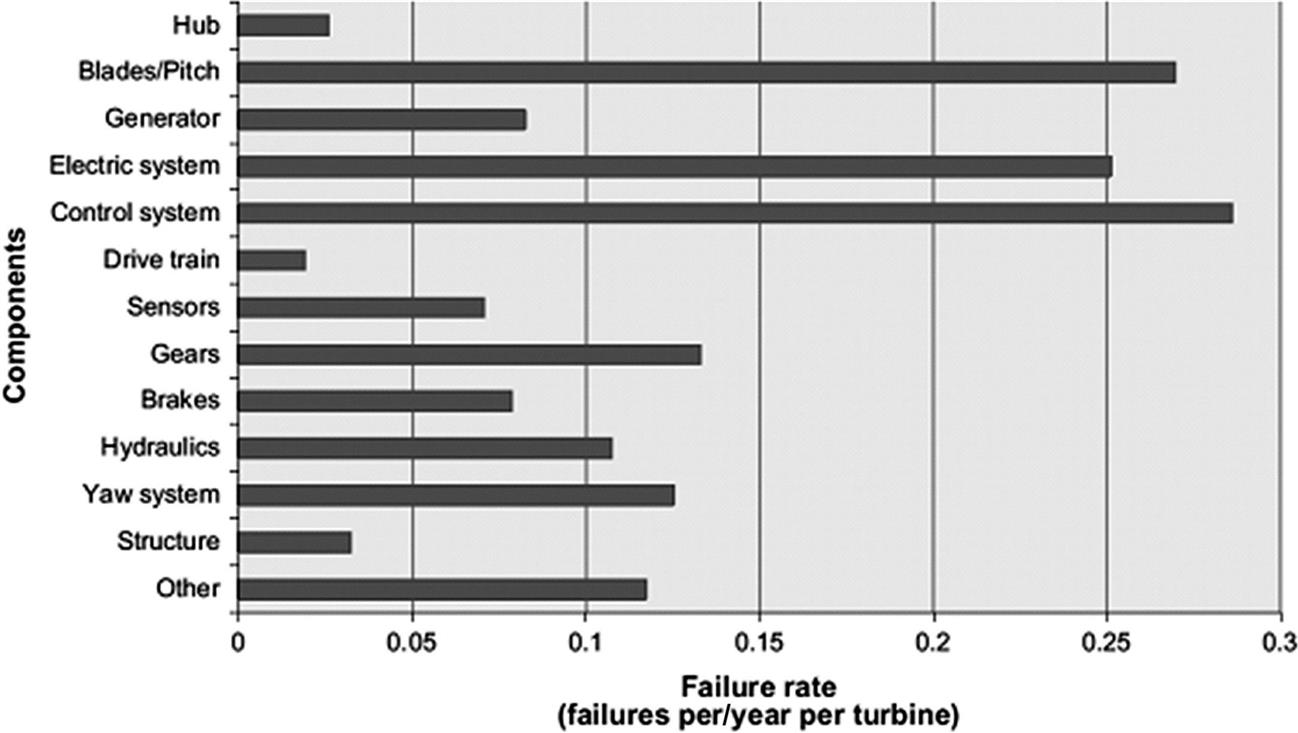
Fig. 15.4 shows the cumulative failure rate [33] and it can be observed that the control system has the highest failure rate, closely followed by the blades/pitch and electric system. A medium cumulative failure rate group is shown to include the gears, yaw system, hydraulics, brake, generator, sensor, and others. The hubs, drivetrains, and structures all have low failure rates. The study [33] also showed that medium size direct-drive wind turbines have more frequent electrical and electronic failures but higher availability than geared turbines.
A few observations from the aforementioned efforts in the United States include [20]:
• The 2012 CREW data shows the top four identifiable drivers in terms of the average number of events per turbine were the rotor/blades, electric generator, balance of plant, and controls, and the top four identifiable drivers in terms of the mean downtime per event were the braking system, controls, yaw, and power distribution. The unidentified events caused the longest downtime per event, indicting the need to clarify what it specifically covers to better understand the downtime drivers.
• The data collected by DNV KEMA and GL Garrard Hassan (newly formed DNV GL) shows from 1999 to 2011 the average yearly replacement rates for gearboxes was about 5% and peaked in years 4, 5, and 8. Generators were about 3.5% and peaked in years 6 and 7, and blades were about 2% and peaked in years 1 and 5.
• The gearbox failure data collected in 2013 and 2014 shows that wind turbine gearboxes could fail in drastically different ways. Bearing and gear failures were concentrated in the parallel stages, and the top gearbox failure mode was high-speed or intermediate bearing axial cracks.
For offshore wind turbines, generators and converters were observed to have higher failure rates than land-based turbines [34]. Assuming that the definition of failures is similar in Refs. [33] and [34], the average failure rate for an offshore wind turbine is approximately 10 failures/turbine per year by a wind plant’s third operational year, more than five times the land-based failure rate. For offshore wind turbines, the subassemblies/components that fail the most are the pitch/hydraulic system, the “other” component group (i.e., door/hatch, cover, bolts, lightning protection system, and lift), and the generator [34]. Offshore wind turbines show a stronger correlation between rising average failure rates and rising average wind speeds than land-based wind turbines [34].
There are a few conservative observations in terms of current wind turbine reliability status that can be made [2,20]:
• Mature technologies have lower failure rates and new technologies have higher failure rates
• Failure rates of 1–3 failure(s)/turbine per year are common for land-based wind plants
• Failure rates vary with turbine configurations and benefits from direct-drive wind turbines versus geared wind turbines are not yet conclusive
• The power module fails more frequently than other modules, but the drivetrain or rotor module failures typically have higher downtime and costs
• Offshore wind plants require improved reliability due to potential higher failure rates and longer downtime per failure event.
A typical wind plant has tens or hundreds of turbines, thereby generating a huge amount of data continuously. As a result, there are opportunities to make use of information technologies to standardize data collection practices and better harvest data, gaining knowledge so the reliability and availability of wind plants can be improved. One such opportunity is life data analysis based on reliability engineering, which can provide immediate benefits to wind plant O&M if appropriately adopted and practiced. It will be addressed in the next section.
15.4 Reliability Engineering
Reliability engineering is concerned with equipment life cycle management. Life data analysis is one of the most powerful tools in reliability engineering [13]. It provides a forward look based on past and present observations. There are several approaches available for performing life data analysis and this section presents one approach that is well-suited for wind turbine technology. Similar to other properties of the equipment, e.g., rating, ampacity, and height, if appropriate life data are not captured and analyzed, reliability cannot be evaluated, controlled, and improved. To benefit from reliability engineering through life data analysis, the practices typically include three steps: data collection, model development, and failure forecasting. For the analysis, it is helpful to clearly define the reliability relationships among turbine components. As shown in Fig. 15.1, the dependability between a series of major turbine components is illustrated through a system reliability block diagram. It features a representative wind turbine configuration including a gearbox, a generator, three blades, three pitch bearings, and assumes the failures that occurred to these components are independent [12].
15.4.1 Data Collection
Wind turbine equipment records and failure reports can be highly variable, from the level of detail and format to data integrity. Fortunately for wind turbine reliability engineers, there are often several data sources, such as supervisory control and data acquisition (SCADA), inspection reports, and maintenance work orders, that are available to investigate and characterize equipment records for life data analysis. One challenge with the life data analysis is that it may take more than 80% of the effort to collect and validate data. Another challenge is inconsistent definitions of failure events, as they may vary throughout the life cycle of a wind turbine or for different purposes, even within an organization. In addition, there are no mandatory and standardized practices for reliability data collection to support systematic life analysis.
Analysts should plan to drill down the turbine equipment hierarchy to the lowest actionable element. Developers of wind projects consider the wind turbines and balance-of-plant equipment as the lowest actionable items. Long-term owners and operators of wind projects are interested in the major assemblies and subassemblies in the wind turbines and balance-of-plant subsystems. A manufacturer may consider the raw materials and surface finishes the lowest actionable level to track data.
The data collection begins by evaluating the major failures that are likely to happen during the life cycle of a wind turbine and the repairs that the wind turbine owner is likely to perform. Regardless of the equipment being analyzed, the data requirements for life data analysis can be satisfied with tracking just two fields: age and failure status. In practice, it is helpful to record a minimum of four fields for all equipment:
The installation date is the first day the equipment enters service. For original equipment, this is the first day generation is reported through the SCADA system or otherwise assumed as the commercial operating date (COD) of the turbine. For replacement equipment, this is the date when the turbine returns to service following a repair. The last known operating date is either: (1) the date the equipment was taken offline, or (2) the latest date turbine operation can be verified. For most modern wind turbines, the operating status can be verified in real time, and the last known operating date can therefore be updated constantly for equipment in service. Together, the installation date and last known operating date provide the bounds to measure the component’s lifetime usage. For developing reliability models as functions of load cycles or other age measures, these two dates are useful to bound queries of a lifetime SCADA database. For convenience, equipment age is often measured with calendar time as it translates well with maintenance planning and risk analyses. The benefit of collecting the installation date and the last known operating date is the ability to measure lifetimes in several different ways.
The status identifies the state of the equipment on the last known operating date. Entries for the status field identify equipment as either a failure event, F, or a suspended event, S. Suspended events, or suspensions, are cases when the equipment has not failed by the specific failure mechanism being analyzed. Suspensions may be the default status when the equipment was commissioned as it is still in service, or may be equipment removed preventively, or otherwise failed by another failure mode than the one being analyzed. Strict failure logic should be used to categorize the status for each equipment record. The equipment key links the equipment record with an instance on a wind turbine at a plant. All asset and plant records and properties are related to the equipment through this field.
Failure and repair events are unwelcome by wind plant owners and operators, but reliability engineers normally view them as opportunities to improve knowledge. The reliability engineers need to stay aware of all equipment status changes in the fleet and ensure that the necessary detail is recovered for all failure and repair events as accurately as possible. Some questions and details to consider when recording failure and repair events include:
• When and how was the failure detected? A failure is called an event, but it is often a process. Damage can be detected in several ways as it progresses to a failure. Catastrophic failures can be detected by turbine faults or local landowners reporting noticeable problems with surrounding turbines. Progressive failure events may be detected in the same ways earlier in the failure process, and also by routine maintenance, prognostics and health management systems, or during an offline inspection campaign. Recording the failure detection method lets owners evaluate the most popular methods for each failure mode and compare how alternative methods of detection correlate with subsequent repair event costs and production losses. Reliability engineers can analyze when and how the failure modes are detected to inform owners of the best methods to manage the failure mode risks and mitigate losses.
• When was the turbine taken offline to replace the failed equipment? This date is equivalent to the last known operating date for the failed equipment. This date can be on, after, or even before the failure detection date. If the offline date is the same as the failure detection date, the equipment was likely run to failure. If the offline date is after the failure detection date, the failing equipment may have been operated and monitored while the replacement was being planned. If the offline date is before the failure detection date, the turbine was most likely taken offline due to some other cause and the component was determined to require replacement.
• When was the failed equipment replaced? This is the date when the turbine returns to service following the replacement of the failed equipment. Together, the offline date and replacement date allow the reliability engineers to measure the total event downtime and production losses.
• What is the failure mode of the failed equipment? A failure mode describes how the equipment fails. Wind turbine equipment can fail by many independent and competing failure modes, as illustrated in Table 15.1. Recovering the failure mode detail can require considerable time and resources, but categorizing and grouping events by failure modes allows the reliability engineers to develop the most informative and specific reliability models. In a system reliability analysis, the reliability engineers develop a specific reliability model for each distinguishable failure mode of the equipment.
• What type of maintenance was done? The maintenance type can be either corrective, preventive, or planned preventive. Corrective maintenance is performed on equipment that has functionally failed or is unfit for service. Preventive maintenance is performed to replace equipment on the condition of some other event, with no indication of catastrophic failure on the equipment replaced. For example, when gearbox replacement is determined as necessary for a wind turbine, the main shaft bearing may be replaced at the same time as a preventive maintenance practice. Planned preventive maintenance is recorded when replacements are scheduled or planned based on early detection of the failure process. The maintenance type field helps owners to group and analyze total event downtimes and detection methods.
To facilitate the data collection and subsequent model development and life forecasting, an equipment and an event recording database typically needs to be developed. When developing such a database, it is necessary to consider how the data will be accessed and maintained. It is recommended to use a central repository if planning to perform routine analysis for a large fleet of equipment, as this helps to organize and manage the data entries.
15.4.2 Model Development
Good data collection facilitates efficient model development. But first, it is important to discuss what differentiates the models. Reliability models are functions of time that show the evolution of equipment risk of failures. The reliability models are lifetime distributions that can be expressed in several forms, all of which define the distribution of a continuous random variable lifetime t. These forms include but are not limited to:
Detailed expression of these forms for some common lifetime distributions are shown in Table 15.2 [35].
Table 15.2
Various Forms of Reliability Models for Different Lifetime Distributions
| Lifetime Distribution | Parameters | R(t) | f(t) | h(t) | Q(t) |
| Exponential | |||||
| Weibull | |||||
| Gamma | |||||
| Lognormal | |||||
| Log-logistic |

Γ is the gamma function; I is the incomplete gamma function.
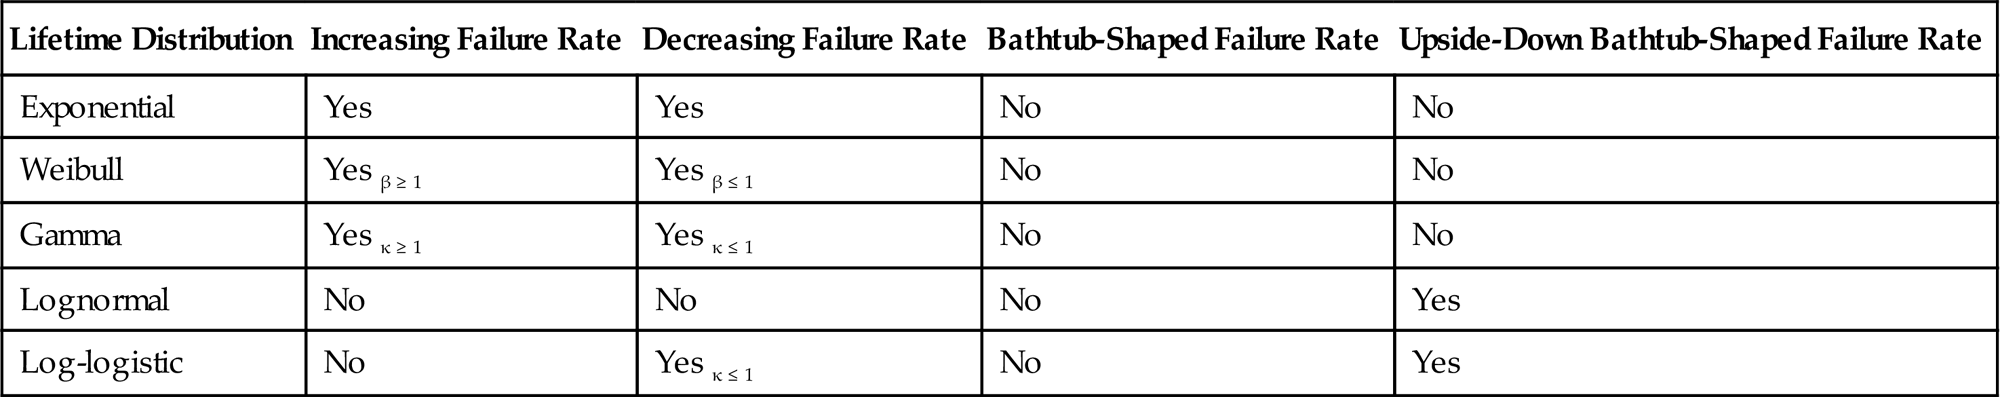
The hazard rate function, also known as failure rate in reliability, is perhaps the most popular expression of a lifetime distribution (The hazard function goes by several aliases: in reliability it is also known as the hazard rate or failure rate. In actuarial science, it is known as the force of mortality or force of decrement. In point process and extreme value theory it is known as the rate or intensity function. In vital statistics it is known as the age-specific death rate, and in economics its reciprocal is known as Mill’s ratio.) due to its intuitive interpretation of the amount of reliability risk associated with a component at time t. The shape of the failure rate function indicates how the equipment ages. An increasing failure rate shows equipment is more likely to fail as time passes. This is common with mechanical items that undergo wear or fatigue. A decreasing failure rate means equipment is less likely to fail as time passes. This can occur with computer software or with some metals that work-harden through use and increase strength with time. Failure rates can follow a bathtub shape wherein equipment reliability improves initially then degrades as time passes. Failure rates can even follow an upside-down bathtub shape. The shape of the failure rate function is useful in determining the appropriate distribution to use when modeling equipment lifetimes. The lifetime distributions can be classified by their modeling capabilities for different behaviors of failure rate functions. Table 15.3 shows the classification of some common lifetime distributions for modeling strictly increasing failure rates, strictly decreasing failure rates, bathtub-shaped failure rates, and upside-down bathtub-shaped failure rates. The classification can be used as a guideline to choose the appropriate life distributions for different types of failure rates when starting the modeling efforts. However, the final distribution that can give the best possible modeling results may only be determined through a systematic evaluation based on the methods to be introduced next.
Table 15.3
Classification of Lifetime Distributions
| Lifetime Distribution | Increasing Failure Rate | Decreasing Failure Rate | Bathtub-Shaped Failure Rate | Upside-Down Bathtub-Shaped Failure Rate |
| Exponential | Yes | Yes | No | No |
| Weibull | Yes β ≥ 1 | Yes β ≤ 1 | No | No |
| Gamma | Yes κ ≥ 1 | Yes κ ≤ 1 | No | No |
| Lognormal | No | No | No | Yes |
| Log-logistic | No | Yes κ ≤ 1 | No | Yes |
The reliability engineers rely on their experiences with failure mechanisms and lifetime data to determine the appropriate lifetime distribution(s) for the analysis. Two common methods used to analyze time-to-failure data sets and develop lifetime distributions are Rank Regression and Maximum Likelihood Estimation (MLE). In short, rank regression solutions find the distribution that minimizes the error between observed values and expected values of unreliability, whereas MLE solutions find the distribution that is most likely to reproduce the historical data set. Both methods develop parametric lifetime distributions that handle a random continuous variable lifetime. These two methods are compared in Table 15.4 and the selection of the method is based on the properties of the data set. MLE is the preferred method to develop lifetime distributions when analyzing the censored data (Wind turbine equipment lifetime data are often incomplete with censored observations. A censored observation occurs when only a bound is known on the time to failure. Censoring is seen frequently with lifetime data because it is impractical to observe all of the equipment failures.) for wind turbine equipment [35].
Table 15.4
Common Methods Used to Analyze Lifetime Data
| Maximum Likelihood Estimation | Rank Regression |
| Find the distribution most likely to produce the historical data | Find the distribution resulting in the shortest distance between the expected values and the observed values |
| Estimate parameters independent of any ranking of failure time | Requires rank estimates of each failure time |
| Considers all equipment in the estimation of parameters; not just failures | Based on total sample size and failure order number |
| Best with censored data | Best with complete data |
Development of the reliability model using the MLE method begins with an assumed distribution that could fit the data set representing reliability for one turbine subsystem or component at either a plant or a fleet level. This initial distribution may be determined based on prior knowledge of the failure mechanism and equipment lifetimes, e.g., by following recommendations given in Table 15.3. Often prior knowledge is missing and this initial assumption is left up to the reliability engineers. Still, reliability software can make this initial guess programmatically without inputs from the analysts and this initial guess typically has little impact on the final results. The initial distribution is used to evaluate the likelihood that the historical events in the data set would occur if the distribution truly characterized the equipment lifetimes. The measure commonly used to characterize the distribution with the data set is called the log-likelihood value. A log-likelihood value is calculated based on the equipment record status and age and the assumed distribution. For failure records the log-likelihood value, LF is calculated by:
(15.3)
and for censored data records (i.e., suspensions) the log-likelihood value, LS is:
(15.4)
Log-likelihood values are calculated for all failure and suspension records in the data set and these values are summed to show the total log-likelihood value, L, as:
(15.5)
The reliability engineers then iterate on the distribution and calculate a new log-likelihood value for each record. The sum of the log-likelihood values for the new distribution is compared with the sum from the initial distribution. The distribution with the maximum log-likelihood value is ranked best for the data set. More and more iterations are made by the analysts with the goal to find the distribution that maximizes the log-likelihood value for the data set. Typically, this iterative process is aided with computer software evaluating thousands, or even millions, of potential distributions for the data set. The results from the MLE method are a lifetime distribution that can serve to estimate equipment lifetimes and fully describe the reliability of the equipment throughout its life cycle.
15.4.3 Forecasting
Data collection and equipment lifetime estimates alone can inform many decisions wind plant owners need to make. But, decision-makers rely on reliability engineers to understand how the equipment reliability impacts their assets. Forecasting is the primary reason to perform life data analysis and this section discusses an approach to apply the data collection and model development efforts for performing these failure forecasts.
Recall that the probability of failure for mechanical equipment is typically a continuous value starting from 0 and increasing monotonically to 1 over time. If we know that some equipment has operated for some period of time, t0, and has not failed [status=S], the probability of failure over some additional operating time, t, is still a continuous value starting from zero at age t0 that increases to one as t approaches infinite. This value is known as the conditional probability of failure and is what wind turbine reliability engineers use to forecast failures. Often the conditional probability of failure is found easier by solving for the conditional reliability and then taking the mathematical (The term in brackets [ ] is known as the conditional reliability) complement:
(15.6)
where Q(t0+t|t0) is the conditional probability of failure for some additional service time, t, provided the equipment has operated without failure for time, t0, and R() is the reliability function. For a population of similar equipment at a wind project, the total number of equipment failures in a period of time is equal to the sum of the conditional probabilities of failure for all equipment during that time such that:
(15.7)
where n(t) is the total number of failures expected during some additional time, t, for a population of U total equipment and Qi is the conditional probability of failure for each ith instance of equipment in the at-risk population. Equipment is at risk if it did not fail at t0 and is expected to be operating during the time, t.
At a very high level, the top business decisions involve values of just two types: time and currency. Regardless of the units used in the failure forecast, all forecast results should be presented with respect to calendar time or the asset life cycle cost.
When a reliability engineer performs a failure forecast based on causal measures other than calendar time, such as total production or load cycles, the reliability engineer must forecast the duty cycle of the causal metric with respect to calendar time before presenting the failure forecast. This approach adds complexity and uncertainty to the failure forecast but it also offers higher fidelity and sensitivity for modeling application stress profiles, consistent with the diurnal and seasonal variability common to wind projects.
15.5 Case Studies
To demonstrate the reliability engineering life data analysis method discussed in Section 15.4, two case studies are presented in this section: one on gearbox spares planning and the other on pitch bearing maintenance scheduling.
15.5.1 Gearbox Spares Planning
An example wind project with 10 turbines has an inventory with one spare gearbox. Its asset manager wants to know if the project will likely need another spare gearbox in the next 2 years. She asks for a forecast showing the expected failures of the gearbox equipment at this project. The reliability engineer plans to provide the failure forecast by computing the conditional probability of failure for each gearbox at the project in the next 2 years. First, the data collection effort brings in gearbox equipment records with the status, the age in calendar days, and other classifying details about the design and application. Review of the data set shows this project has 10 gearboxes of varying ages at risk in the next 2 years. The reliability engineer happens to have access to a larger data set of assets under management and she finds 313 similar instances of gearbox equipment and lifetime records.
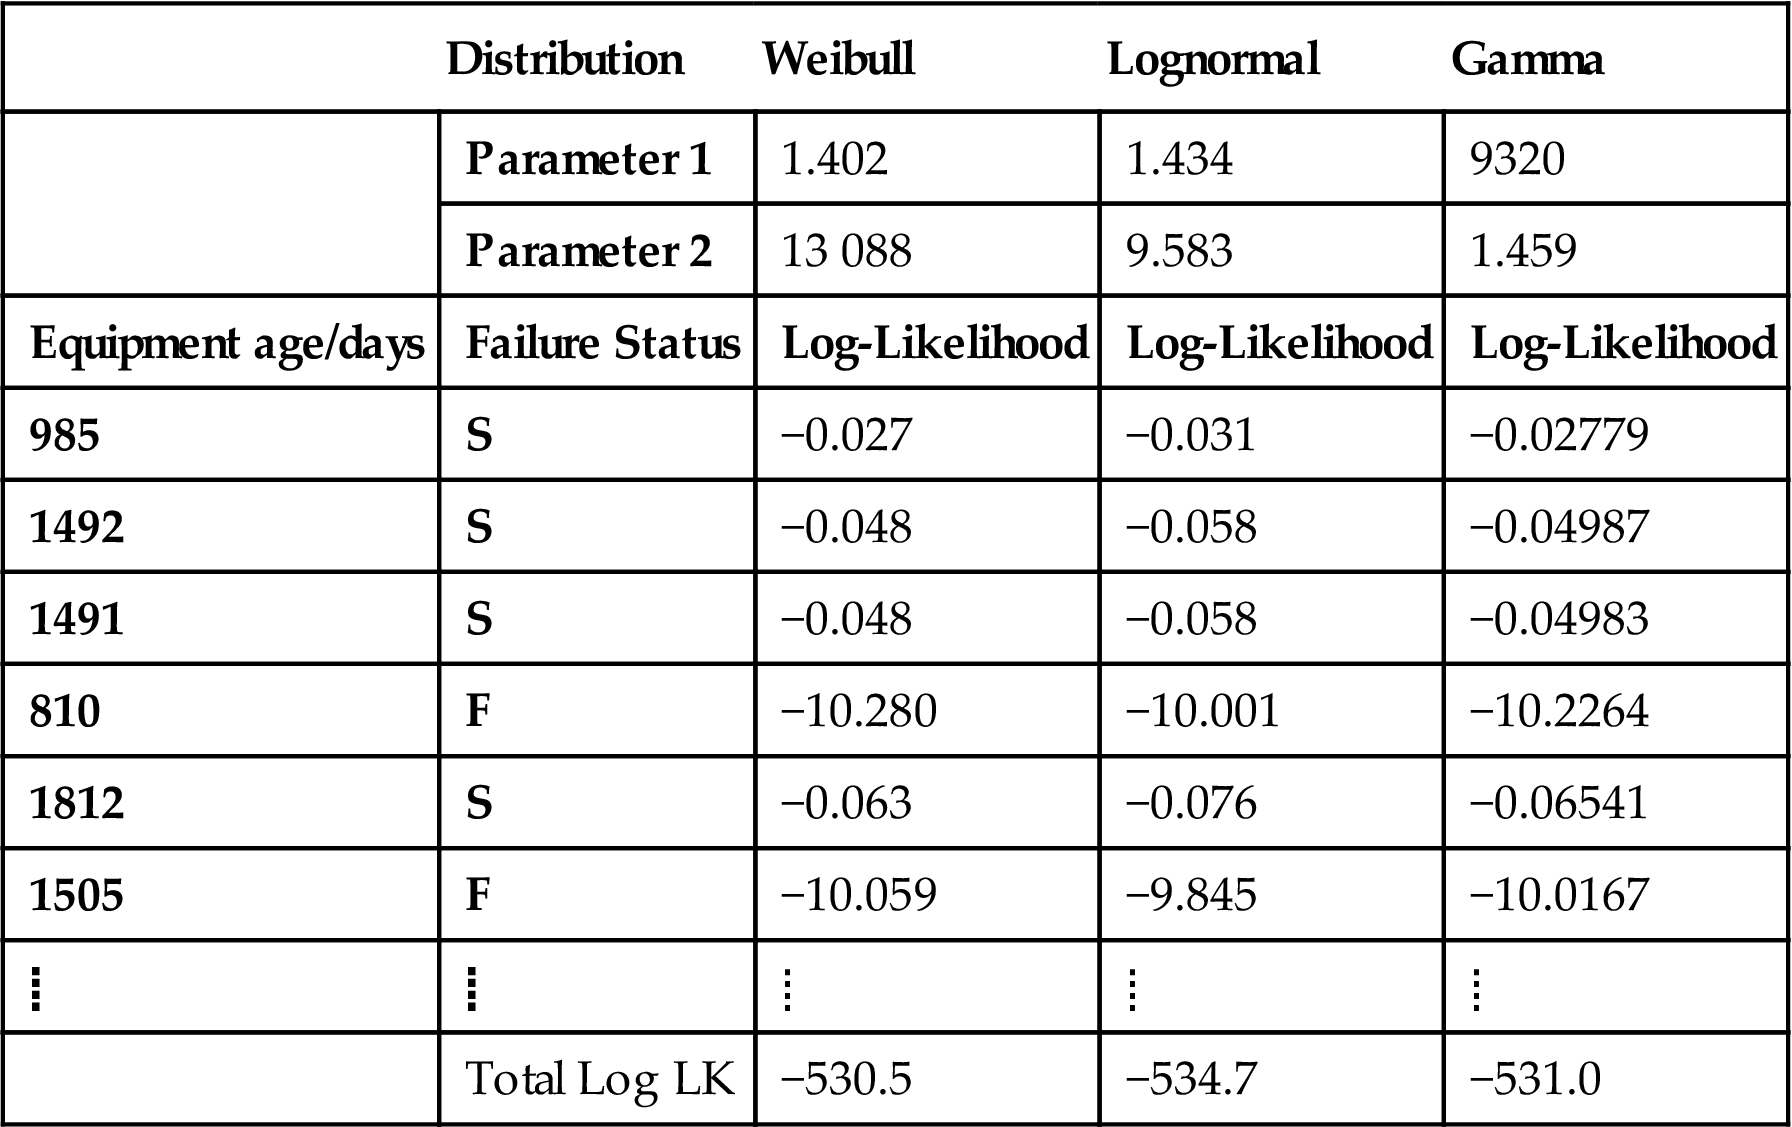
The reliability engineer reviews the censored lifetime data from the total 323 gearbox records and identifies a common gearbox failure mode in the records. For each record, she delineates the age and assigns a failure status: F for failure or S for suspension, based on her failure mode criteria. She selects three initial distributions to model the time-to-failure data and decides to use the MLE method to analyze the data. To execute the MLE method, she develops a logic that first evaluates the status of each record and then calculates the log-likelihood value for that record. If the record status is S for suspension, she calculates the natural log of the reliability function at the age of the record. Or if the record status is F for failure, she calculates the natural log of the probability density function at the age of the record. She then uses software to iterate the parameters for the distributions with a goal to maximize the log-likelihood values. An excerpt of the MLE solutions for the data set is shown in Table 15.5 along with the log-likelihood values calculated for some of the equipment records. Evaluating the maximum log-likelihood values between the three distributions, the reliability engineer chooses the Weibull distribution with a slope of 1.402 and scale parameter of 13 088 days as the best reliability model for the gearbox lifetime data.
Table 15.5
Example Spreadsheet Results of MLE Analysis With Three Lifetime Distributions
| Distribution | Weibull | Lognormal | Gamma | |
| Parameter 1 | 1.402 | 1.434 | 9320 | |
| Parameter 2 | 13 088 | 9.583 | 1.459 | |
| Equipment age/days | Failure Status | Log-Likelihood | Log-Likelihood | Log-Likelihood |
| 985 | S | −0.027 | −0.031 | −0.02779 |
| 1492 | S | −0.048 | −0.058 | −0.04987 |
| 1491 | S | −0.048 | −0.058 | −0.04983 |
| 810 | F | −10.280 | −10.001 | −10.2264 |
| 1812 | S | −0.063 | −0.076 | −0.06541 |
| 1505 | F | −10.059 | −9.845 | −10.0167 |
| Total Log LK | −530.5 | −534.7 | −531.0 |
Now that the reliability engineer has collected the data and developed the reliability model, she is ready to run the failure forecast. She lists out the current age of the gearboxes at her project as t0 along with the age of each gearbox in 2 years from now as t0+t. Note, because the equipment age and reliability model units are in calendar days, the expected future age in 2 years is deterministic, but this is not always the case for other aging metrics (e.g., production forecasts are probabilistic). The failure forecast results for the 10 gearboxes over the next 2 years are shown in Table 15.6 along with informative measures of the current and future reliability for each gearbox.
Table 15.6
Failure Forecast Results for 10 Gearboxes at a Project
| Gearbox Instance | Current Age t0/Days | Future Age (t0+t)/Days | Current Reliability R(t0)/% | Future Reliability R(t0+t)/% | Conditional Probability of Failure |
Number of Failures |
| Turbine 01 | 1825 | 2555 | 93.9 | 90.4 | 3.7 | 0.037 |
| Turbine 02 | 3285 | 4015 | 86.6 | 82.6 | 4.6 | 0.046 |
| Turbine 03 | 3285 | 4015 | 86.6 | 82.6 | 4.6 | 0.046 |
| Turbine 04 | 2920 | 3650 | 88.5 | 84.6 | 4.4 | 0.044 |
| Turbine 05 | 3285 | 4015 | 86.6 | 82.6 | 4.6 | 0.046 |
| Turbine 06 | 3650 | 4380 | 84.6 | 80.6 | 4.7 | 0.047 |
| Turbine 07 | 2920 | 3650 | 88.5 | 84.6 | 4.4 | 0.044 |
| Turbine 08 | 3650 | 4380 | 84.6 | 80.6 | 4.7 | 0.047 |
| Turbine 09 | 3285 | 4015 | 86.6 | 82.6 | 4.6 | 0.046 |
| Turbine 10 | 2190 | 2920 | 92.2 | 88.5 | 4.0 | 0.040 |
| Total number of gearbox failures expected at the project in the next 2 years is | 0.443 | |||||
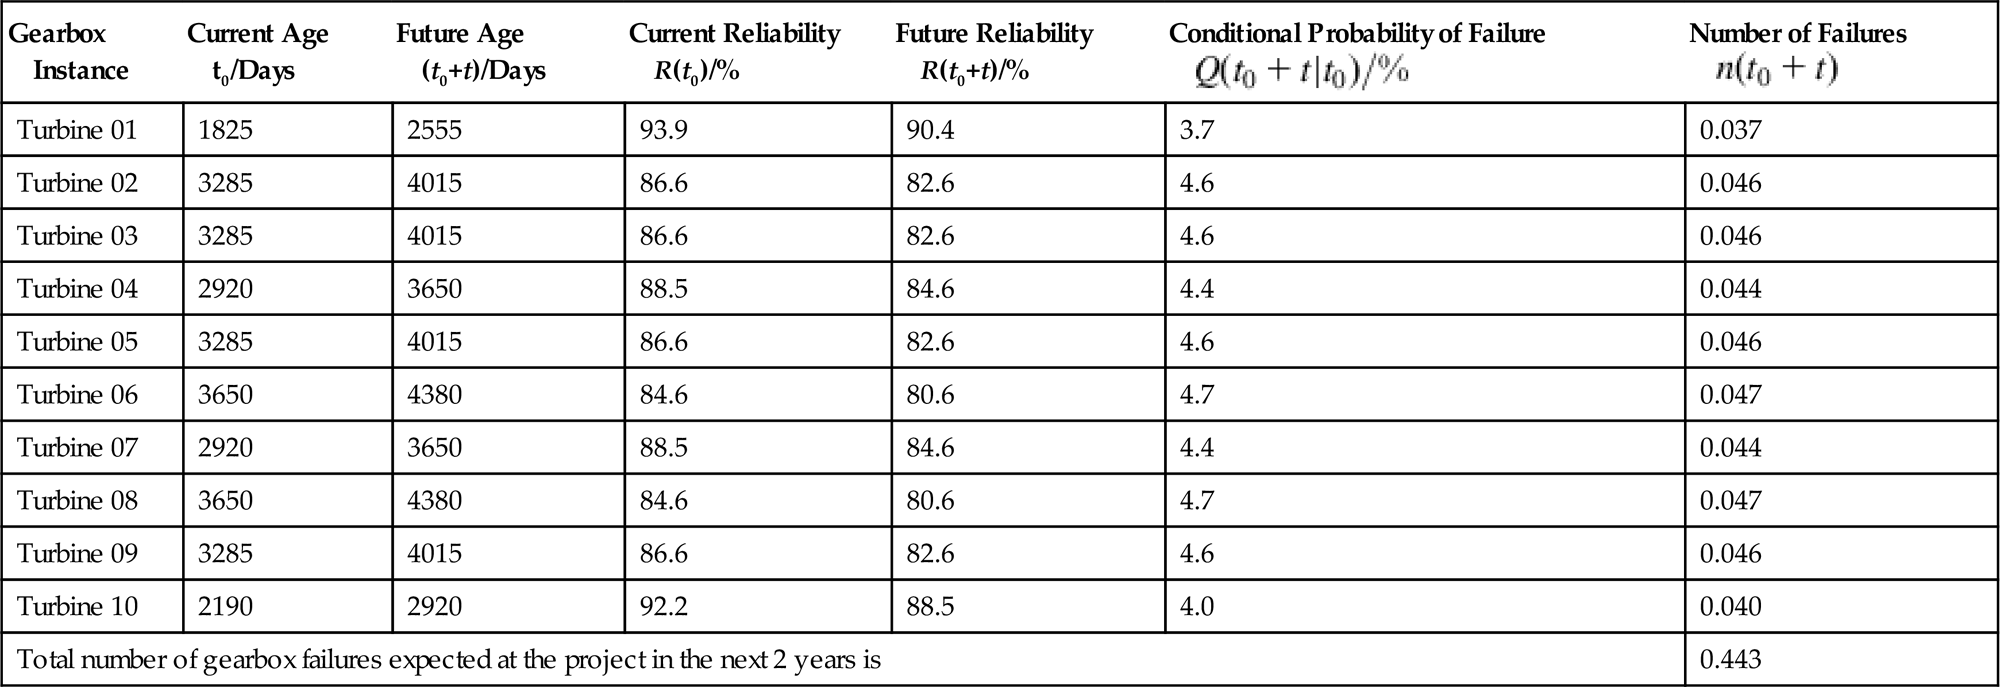
Finally, the reliability engineer adds the number of failures expected for all gearboxes and compares this sum to the number of gearboxes available in inventory. In this case, the reliability engineer advises the asset manager that the project is expected to suffer less than one gearbox failure from the identified common failure mode in the next 2 years and a gearbox spare is likely not needed.
15.5.2 Pitch Bearing Maintenance Scheduling
At another project, the wind turbines are suffering a fatigue failure of pitch bearings that can result in catastrophic losses if undetected. This project cannot tolerate a catastrophic loss and the asset manager wants to know how often to inspect the pitch bearings to mitigate the risk. The nominal maintenance plan requires an offline inspection of each turbine every 6 months but the failure rate of the pitch bearings at this project suggests more frequent inspections are needed. The reliability engineer plans to use life data analysis and a risk-based inspection approach to find out an appropriate maintenance interval for this project.
The risk-based inspection approach requires a failure forecasting model and some additional data for calculation of risks. These data includes the cost of inspection, the failure mode detectability, and the planned replacement cost and catastrophic event cost, which the reliability engineer normally gathers or assumes. The “cost” terms here are inclusive of the material and labor costs plus the lost production revenue during the event downtime. The detectability shows the likelihood of detecting failures with the inspection.
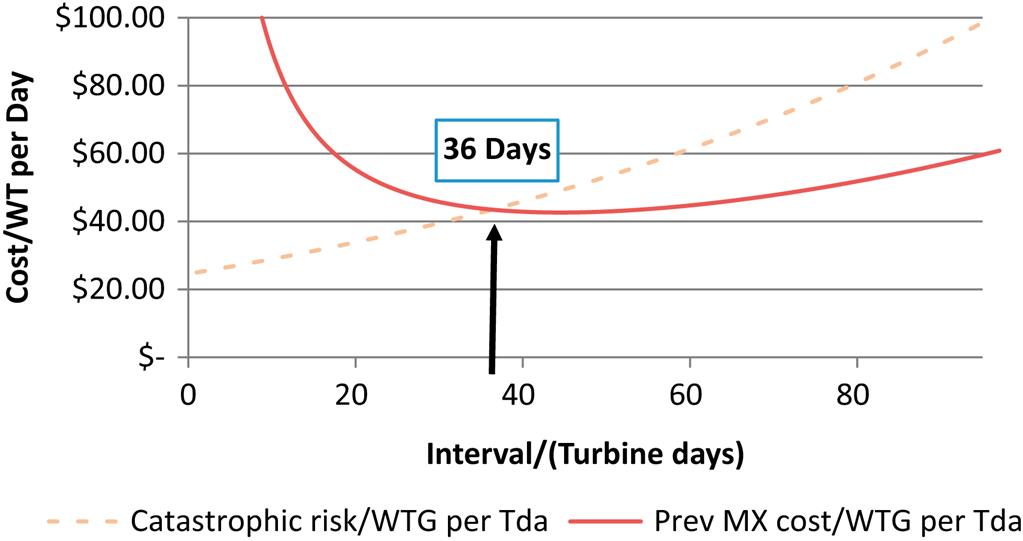
The reliability engineer prepares outlooks of two maintenance strategies: the first showing the catastrophic risk of a “do-nothing” run-to-failure strategy and the other showing the risk of a preventive maintenance strategy through offline inspections. The catastrophic risk is the calculated product of the expected failures and the cost of a catastrophic event. The preventive maintenance costs include the sum of the total cost of the inspections, the expected replacement costs when failures are found during inspections, plus the risk of a catastrophic loss from misdetection during offline inspections. Because the project cannot tolerate catastrophic risk, the reliability engineer sets the preventive maintenance costs equal to the catastrophic risk to determine the most appropriate interval for the offline inspections.
The reliability model for the pitch bearing failure at this project is found, using the MLE method, to be a lognormal distribution with a log-mean of 8.12 log days and a log-standard deviation of 0.454 log days. The current age of the pitch bearings at the project is 560 days. The cost of an offline inspection is $750 and the detectability of the failure with this inspection is 95%. The cost of a planned replacement of the pitch bearing failure is $325 000 and the cost of a catastrophic event is $650 000. The reliability engineer evaluates the risk outlooks for the two maintenance strategies as shown in Fig. 15.5 and advises the asset manager that a 36 day inspection interval is equivalent in cost to the run-to-failure strategy and has the highest likelihood for detecting a failure and avoiding a catastrophic loss.
15.6 Conclusions
This chapter briefly discussed fundamentals for wind turbine reliability and the current industry status. Then, the reliability engineering method for life analysis was presented in detail and illustrated through two case studies. An owner and operator’s perspective is taken and mechanical components are used to exemplify the potential benefits of reliability engineering analysis to wind plant O&M. It is worth noting that if there were appropriate resources, these analyses can be practiced by the wind industry now to gain tremendous benefits in terms of O&M risks and finance.
Wind turbine reliability is a complex issue. Many components are involved that can fail in vastly different ways, as well as unique operational conditions, long life expectations, and thin economic margins. However, in order to make wind power competitive and successful, the industry has to improve both turbine and plant reliability. This improvement is even more critical for the offshore wind industry. The areas of focus can start with mission-critical and costly assemblies. An immediate beneficial opportunity for the wind industry is through the adoption of reliability engineering life data analysis as discussed in this chapter. To truly address the wind turbine reliability challenge in a systematic and thorough manner as a global industry, all parties along the entire wind turbine supply chain have to come together and share data and knowledge in a fashion beneficial to both the partner and the entire industry. The task is challenging but rewarding.
Acknowledgments
The contribution from the National Renewable Energy Laboratory to this work was supported by the U.S. Department of Energy under Contract No. DE-AC36-08GO28308. Funding for the work was provided by the DOE Office of Energy Efficiency and Renewable Energy, Wind Energy and Water Power Technologies Office. The support from eDF Renewable Energy is greatly appreciated.
The U.S. Government retains and the publisher, by accepting the article for publication, acknowledges that the U.S. Government retains a nonexclusive, paid-up, irrevocable, worldwide license to publish or reproduce the published form of this work, or to allow others to do so, for U.S. Government purposes.