
Global Rare Earth Supply, Life Cycle Assessment, and Wind Energy
Zhehan Weng1,2, Gavin M. Mudd1, 1Monash University, Clayton, VIC, Australia, 2Ghent University, Ghent, Belgium Email: 2[email protected]
Abstract
Wind energy has become one of the most significant sectors in global renewable energy market. This chapter analyses the global rare earth elements (REE) demands and associated environmental implications driven from the rapid growing global wind energy demands. The NdFeB permanent magnet demand from wind turbines is a valuable case study to underpin and evaluate the environmental benefits of REE consumption and wind energy growth, as both of them are key areas of expected global clean energy supply and critical metal demands.
Keywords
Rare Earth Elements; Permanent Magnet; Wind Energy
24.1 Background of Rare Earth Elements
The rare earth elements (REE) are now considered as key elements for various emerging technologies. In the early stages of their discovery (by Arrhenius in 1787 at Ytterby in Sweden), the term “rare” originated from the belief that the only known source of these new elements was at Ytterby [1,2]. The term “earth” was an archaic reference to oxidic materials in the 19th century [3]—despite the fact they were metallic elements [4]. With scientific advancement in REE exploration and utilization, during the past two centuries, both the perceptions of REE’s geological scarcity and its chemical properties have proven to be obsolete. The International Union of Applied and Pure Chemistry (IUPAC) defines REEs as the group of 15 lanthanide elements plus scandium and yttrium (as shown in Fig. 24.1). In general Sc is not extracted, and so in this chapter we use the abbreviation of TREO+Y to highlight that our data is rare earth oxides plus yttrium only.

It is important to understand that, each REE has distinctive physical and chemical characteristics, and hence, different downstream uses. The term light rare earth elements (LREE; La to Gd) and heavy rare earth elements (HREE; Tb to Lu), defined by similar electron shell configurations, are commonly used to classify the lanthanide elements more accurately. Despite having a relatively small molecular weight, yttrium is typically classified as a HREE, and scandium is not formally classified as either a LREE or a HREE due to the lack of similarities to either group; yet, it is included with the REE as a whole.
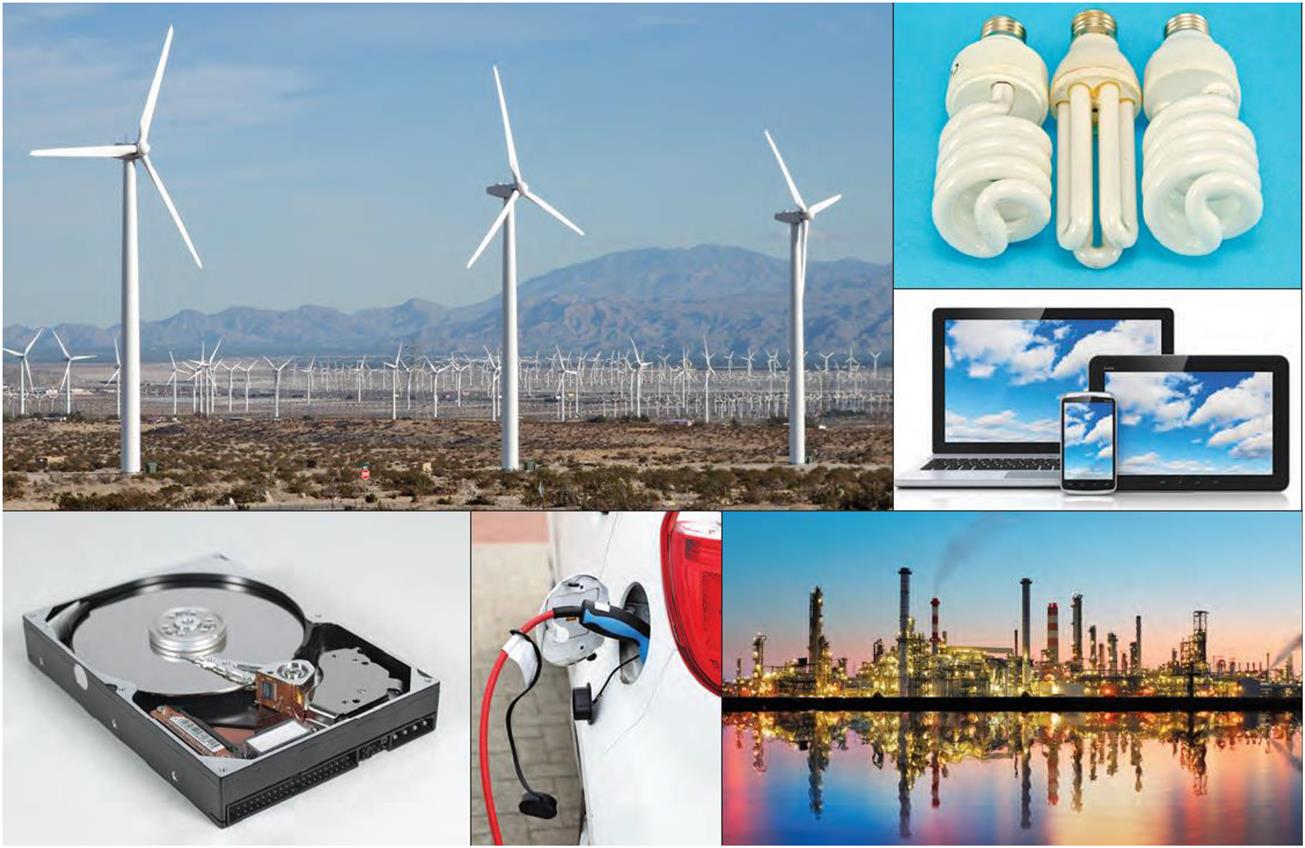
Since the latter part of the 20th century the increasing demands for high-performance REE materials (see Fig. 24.2) in emerging technological applications has altered the global REE demands. This is exemplified by the utilizations of REE “mischmetals” in the permanent magnet industry. Superior magnetic strength of the neodymium-iron-boron (Nd2Fe14B) magnet and the ability of the samarium cobalt (SmCo) magnet to retain the magnetic characteristics even at elevated temperatures make them both essential components in precise weaponry systems, electric vehicles, and wind turbines [7,8].
However, the unique characteristics and the associated complexity of REE in the downstream applications often make them extremely difficult to recycle. Binnemans et al. [9] stated that, in 2011, less than 1% of REE were recycled. Finding substitutions for REE in most applications is also difficult, if not impossible [3,10–12]. For example, for NdFeB-based permanent magnets (generally regarded as the strongest permanent magnets yet discovered), the possible alternative for Nd is Pr, with a loss in magnetic strength. For Dy, there is no feasible alternative element to date [13,14]. As a result the continuous growth of REE-dependent technologies in conjunction with new discoveries of REE applications aimed at a low-carbon society will significantly increase the future global demands for REE [6,15,16].
24.2 Global REE Supply
In global terms the REE are not “rare” from a geological abundance perspective—as some REE have a similar abundance to copper. Typical REE abundance in the Earth’s crust varies significantly. For example, Ce has an average crustal concentration of 63 µmol mol−1 (63 ppm), which is higher than several base metal elements such as copper (Cu, 28 ppm) and lead (Pb, 17 ppm), in the earth’s upper crust [17]. In comparison Tm and Lu have average upper crustal concentrations of 0.3 ppm and 0.31 ppm, respectively, which are much lower than the majority of other significant economic metals, but higher than gold (Au), silver (Ag), and the platinum (Pt) group elements [17]. Similar results of REE abundances have also been reported by Hoatson et al. [5].
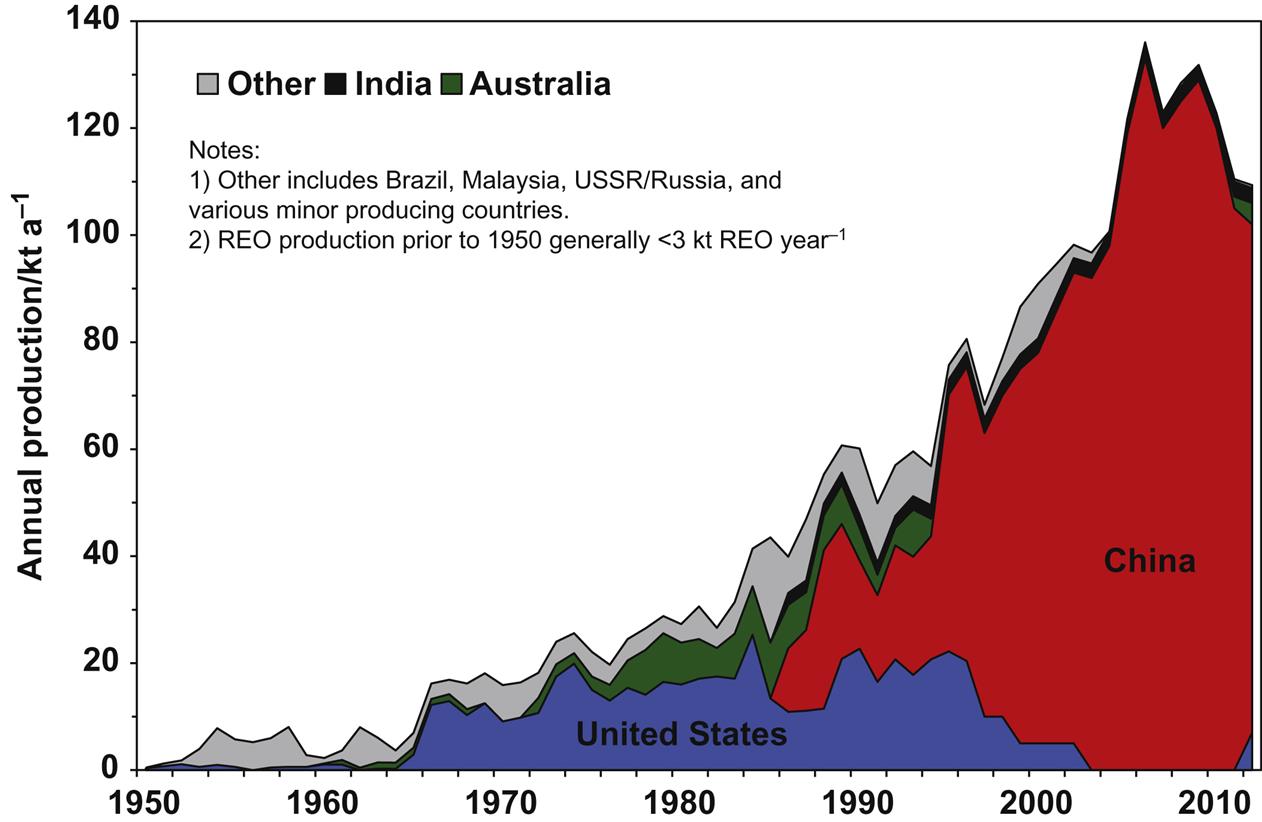
From a production perspective, the REE are primarily produced as rare earth oxides, or more specifically, rare earth oxides plus yttrium (TREO+Y). Fig. 24.3 shows the historical TREO+Y production since 1950; the global production was dominated by monazite extraction until major weathered carbonatite projects came into production. The Mountain Pass Project ore body in California, United States was discovered in 1949 [21], and was the world’s largest REE supplier until the early 1990s. During the same period, REE-enriched bastnäsite extracted from Mountain Pass became the primary global source for TREO+Y [22–24]. Since the 1990s, largely due to the rapid rise of Bayan Obo in northern China, the global TREO+Y market has been dominated by Chinese production. In 2006 China’s annual production peaked at 133,000 t TREO+Y (where t refers to metric tonne), accounting for 97.1% of the global production that year. Since then the Chinese production has maintained its dominance. It also exemplifies the long-term supply risk inherent in having the global supply of the TREO+Y dependent on a single dominant supplier or country. As a result concern about the long-term TREO+Y supply has become a strategic issue for major consumers like the United States and the European Union (EU) [13,14,25–27].
Weng et al. [28] reported a minimum global TREO+Y mineral resource of 619.5×10⁶ t (619.5 million tonnes) with average ore grade of 0.63%. In other words, there are abundant proven mineral resources hosted within a variety of different types of REE deposits, each of which has a diverse range of mineralogy. The study also suggests future global TREO+Y supply would shift from a few bastnäsite-based carbonatite mines toward a more diversified range of production from a range of differing geological types. Demands for certain essential REE (especially HREE)-dependent products or applications (e.g., wind turbine) should be fulfilled by targeting suitable deposits (e.g., HREE-enriched ionic clay deposits) with viable ore grades and implementing novel and site-specific mining, beneficiation and refining technologies, and plant configurations to optimize the production efficiency of the desired end products while minimizing environmental impacts.
24.3 REE Permanent Magnets
The NdFeB permanent magnet is the key functional component in modern wind turbine industry. It is used for making permanent magnet synchronous generators (PMSG) and high temperature superconductors (HTS) [16,29,30]. The superior magnetic strength of NdFeB magnets, together with their special high induction and coercive force properties [31], has enabled the development and utilization of lighter and larger wind turbines with, greater aerodynamic efficiency, better reliability, and reduced maintenance requirements. As summarized by Wiser et al. [32], “the availability and cost of rare earth permanent magnets are expected to affect significantly the size and cost of future direct-drive generator designs” (pp. 580).
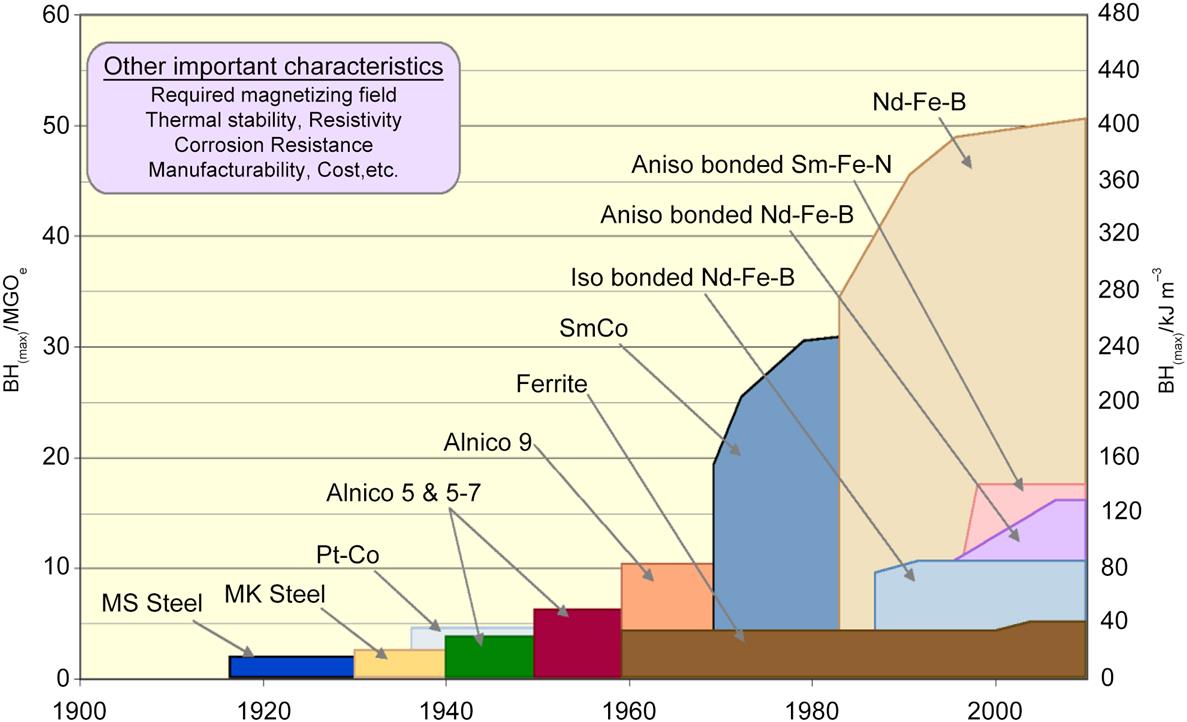
REE-dependent permanent magnets provide significantly better “maximum static energy product” capacity BH(max) compared to traditional aluminum-nickel-cobalt (Alnico) and ceramic (Ferrite) magnets (see Fig. 24.4). Given their superior magnetic strength (e.g., NdFeB magnet) and excellent resistance to demagnetization at elevated temperatures (SmCo magnet) REE permanent magnets have become essential components for various modern wind turbine designs and manufacturers [7,8].
Humphries [16] estimated the REE permanent magnet production is the single largest sector (approximately 20%) of global REE demands in 2010, and it was expected to grow by 10%–16% per year till 2015 (see Fig. 24.5). Lucas et al. [35] stated that wind turbine production uses about 10% of global annual permanent magnet supply.

Given the importance of REE in facilitating clean energy technologies to help with addressing climate change, it is clear that there is a need to examine the finer details underlying basis of the criticality of REE—especially potential supply rates to meet growing demands for a variety of specific technologies. As systematically summarized by numerous articles, governmental, and industrial reports: the design, generation capacity, and efficiency of future wind energy plant will be dependent on the availability of REE permanent magnets, especially the neodymium-iron-boron (NdFeB) permanent magnet [29,32,35,36].
24.4 Life Cycle Assessment of the Use of REE Magnets in Wind Turbines
In this section we compare two life cycle assessments (LCA) between two onshore low–medium speed wind turbines; namely: Vestas V112 3~3.45 MW with a PMSG [37] and Vestas V126 3.3 MW with single-fed induction generator (SFIG) made of steel and copper [38], to demonstrate the importance of REE in wind turbine environmental footprints.
Table 24.1 summarizes the raw material breakdowns for each system. Compared to V126, the V112 turbine contains an additional 485 kg of NdFeB permanent magnet, 3 t of copper, and 6 t of polymer materials to achieve remarkable savings of 86 t of steel and iron materials (22%), 1 t aluminum (23%) and electronics (30%), 480 kg lubricants (27%), and 364 kg other unspecified material. However, the irreplaceability and complex recycling process of REE unavoidably impacts on the overall recyclability of PMSG wind turbines compared to other models which utilize more conventional (e.g., Alnico, Ferrite) magnets.
Table 24.1
Material Breakdowns for the Vestas V112 and V126 Wind Turbines [37,38]
| Material Inputs Inventory | Units | V112 | V126 |
| Designed capacity | MW | 3~3.45 | 3.3 |
| Steel and iron materials | t | 311 | 397 |
| Aluminum and aluminum alloys | t | 3.4 | 4.5 |
| Copper | t | 4.8 | 1.8 |
| Copper alloys | kg | 9.1 | 30 |
| Polymer materials | t | 21 | 15 |
| Process polymers | kg | 765 | 1 939 |
| Other materials and material compounds | t | 27 | 25 |
| Electronics/electrics | t | 2.4 | 3.4 |
| Lubricants and liquids | t | 1.3 | 1.8 |
| Not specified | kg | N/A | 364 |
| REE permanent magnets | kg | 485 | N/A |
| Recyclability | % | 81 | 89 |

Notes: Average material inputs for each wind turbine are adapted from total 33 units of each system installed in 100 MW wind plant. t, tonne
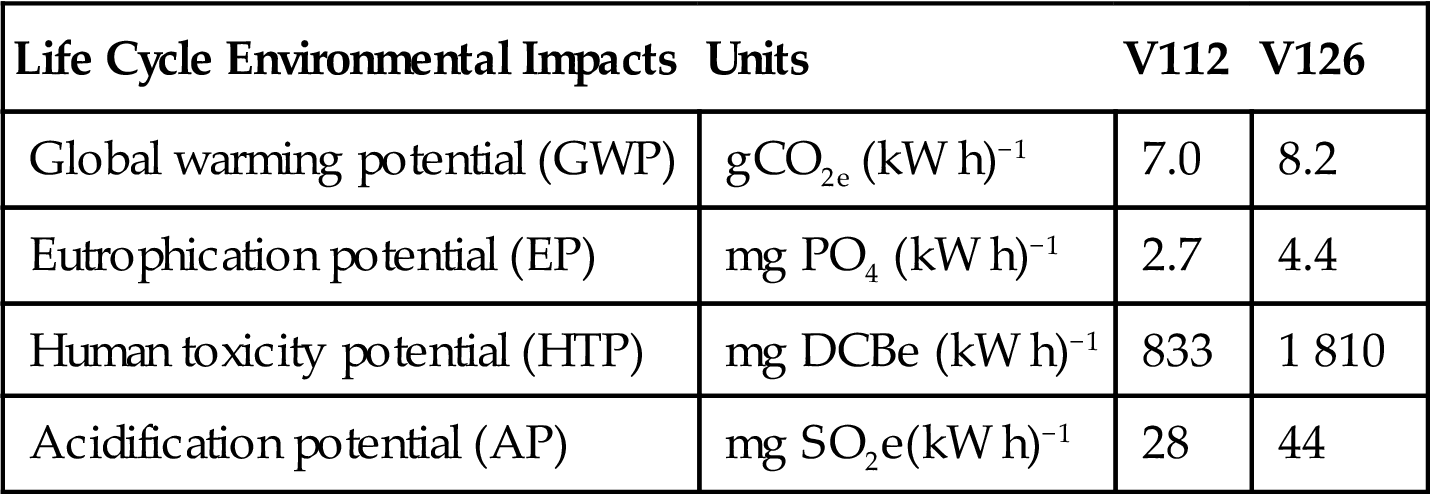
The overall life cycle impacts of a100-MW wind plant (farm) (20 years life cycle) composed of 33 units of V112 or V126 are summarized in Table 24.2. Again comparing the V126 to V112, the V112 has much lower overall environmental profiles than the SFIG model in almost all impact categories, especially as related to human toxicity (54%), eutrophication (39%), and acidification (36%) potential. Moreover, a wind power plant is often considered as one of the crucial “clean energy” systems that reduce greenhouse gas (GHG) emissions. The global warming potential (GWP), measured in carbon dioxide emissions equivalent (CO2e), is an essential indicator to demonstrate overall environmental polluting capacity. Under the same operating conditions (e.g., operating hours, wind speed, plant life cycle, etc.), a wind power plant involving Vestas V112 turbines has a 15% lower GHG footprint than a plant involving V126 turbines kW h−1 electricity generated. This comparison highlights the critical role that REE permanent magnets play in the wind turbine industry by significantly reducing the raw material requirements and improving the overall environmental performance.
Table 24.2
Life Cycle Environmental Impacts for 100 MW Onshore Wind Power Plant [37,38]
| Life Cycle Environmental Impacts | Units | V112 | V126 |
| Global warming potential (GWP) | gCO2e (kW h)−1 | 7.0 | 8.2 |
| Eutrophication potential (EP) | mg PO4 (kW h)−1 | 2.7 | 4.4 |
| Human toxicity potential (HTP) | mg DCBe (kW h)−1 | 833 | 1 810 |
| Acidification potential (AP) | mg SO2e(kW h)−1 | 28 | 44 |
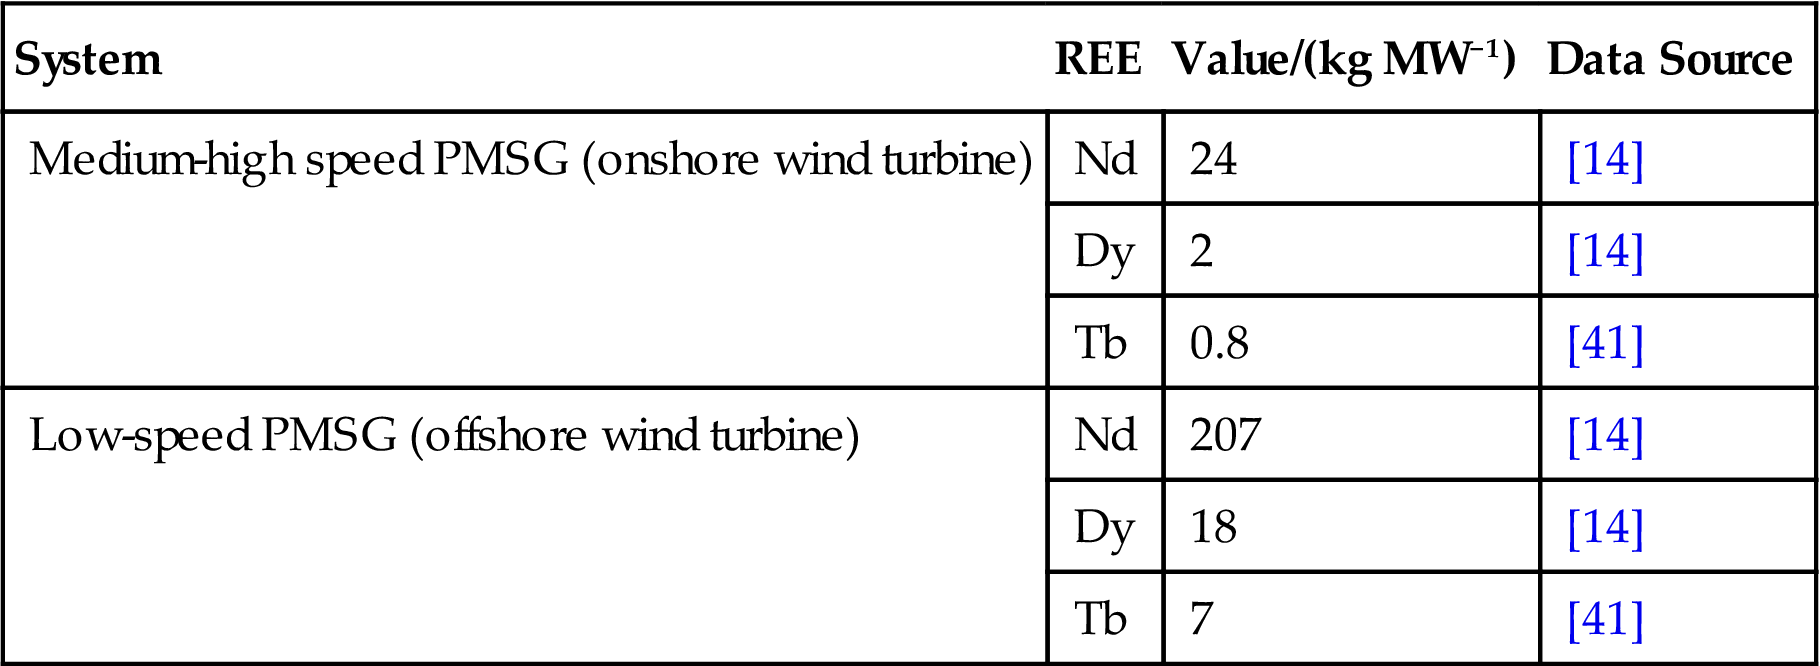
The detailed Nd, Dy, and Tb mineral resources data and corresponding environmental impacts in the production stage have been adapted from Refs. [28,39]; the NdFeB magnet production LCIA data adapted from Ref. [7]; and LCIA of onshore and offshore wind turbines are based on data from Ref. [40]. The REE composition inventory of medium-high and low-speed PMSG wind turbines is shown in Table 24.3.
Table 24.3
Rare Earth Elements (REE) Composition of Medium-High and Low-Speed Permanent Magnet Synchronous Generators (PMSG) Wind Turbines
| System | REE | Value/(kg MW−1) | Data Source |
| Medium-high speed PMSG (onshore wind turbine) | Nd | 24 | [14] |
| Dy | 2 | [14] | |
| Tb | 0.8 | [41] | |
| Low-speed PMSG (offshore wind turbine) | Nd | 207 | [14] |
| Dy | 18 | [14] | |
| Tb | 7 | [41] |
Principal assumptions include:
• Typical life cycle period of a wind turbine is 25 years [42] with GWP as primary environmental impact indicator of this assessment.
• Medium-high speed PMSG is only utilized in onshore wind turbines.
• Low-speed PMSG is only utilized in offshore wind turbines.
• The average capacity factors (Ratio of wind turbine’s actual power output and peak power output under 100% nameplate capacity for the same period of time) for both onshore and offshore PMSG wind turbine are estimated as 28% [43] while the maximum and the minimum capacity factor is calculated based on full load hours (FLH) for corresponding systems [42].
• Other metal demands of permanent magnet production (e.g., Fe, Cu, Ni, B, etc.) are assumed to be covered by existing LCA studies with environmental impacts and has been included as part of the wind turbine’s overall environmental footprint.
• Environmental impacts of REE production and NdFeB magnet manufacturing characterizations and allocations are based on mass fractions of metal.
Table 24.4 shows the results of this LCA analysis. Regarding the GWP assessment, regardless of onshore or offshore wind turbine, the REE production, and magnet production only accounts for a negligible proportion of the total GWP footprint for a wind turbine. This is expected given that the impact characterizations are based on the mass fractions of each material, and the relatively small amount of REE material in each turbine (Table 24.3). Our assessment also suggests that the overall GWP footprint for electricity generated from both onshore and offshore wind farms are the lowest when compared to power plants based on other energy sources (Fig. 24.6).
Table 24.4
Life Cycle Assessments (LCA) of Medium-High and Low-Speed Permanent Magnet Synchronous Generators (PMSG) Wind Turbines
| System and Process | Maximum | Average | Minimum | |
| gCO2e/(kWh)−1 | gCO2e/(kWh)−1 | gCO2e/(kWh)−1 | ||
Onshore PMSG medium-high |
Nd production | 2×10⁻³ | 1×10⁻³ | 1×10⁻³ |
| Dy production | 1×10⁻⁴ | 9×10⁻⁵ | 6×10⁻⁵ | |
| Tb production | 1×10⁻⁵ | 8×10⁻⁶ | 6×10⁻⁶ | |
| Magnet production | 0.040 | 0.037 | 0.040 | |
| Entire system | 45 | 15 | 3 | |
Offshore PMSG low-speed |
Nd production | 1×10⁻² | 1×10⁻² | 9×10⁻³ |
| Dy production | 7×10⁻⁴ | 7×10⁻⁴ | 5×10⁻⁴ | |
| Tb production | 7×10⁻⁵ | 7×10⁻⁵ | 4×10⁻⁵ | |
| Magnet production | 0.23 | 0.29 | 0.29 | |
| Entire system | 23 | 12 | 7 | |


Compared to medium-high speed PMSGs, which dominates the current wind turbine market, low-speed generators have a significant higher REE (i.e., Dy, Nd, Tb) amount per megawatt capacity, in exchange for lighter weight, better energy efficiency (or capacity factors), and lower GHG footprint. This is also seen in the lower average total GWP impact of low-speed PMSG as compared to the medium-high speed PMSG units. Broadly speaking, it is reasonable to believe that extrapolating GWP impacts from REE production and permanent magnet manufacturing processing, to future wind turbine production (especially for low-speed PMSG), the utilization of REE permanent magnets will not compromise but will enhance the systems overall GWP footprint. Hence REE permanent magnets will become even more important for future wind turbine designs and application, especially given that the market is shifting toward high capacity low-speed PMSG wind plants.
It is also worth mentioning that, due to lack of good quality data, current indicative LCA focus only on GWP impacts. The available data is insufficient to determine the overall environmental burden of global REE production. There is a broad range of other critical issues such as REE recovery efficiency, supply capacity, health concerns, acidification potential, and radiation exposure from hazardous by/coproducts (e.g., thorium and uranium, etc.), which should be addressed before making a conclusion on the overall impact of REEs with relevance to future sustainable energy systems.
Table 24.5 presents the environmental benefits related to Vestas V112 and V126 wind turbines. The obvious result suggests the applications of REE magnets in modern wind turbine systems provides greater environmental benefits for wind turbines compared to the associated environmental costs from REE mineral extraction and magnet production stages.
Table 24.5
Benefit Accounting Based on Vestas V112 and V126 Systems With Rare Earth Elements (REE) Production Stage Footprints [37–39,42]
| System and Process | GWP Reduction/mg CO2e(kW h)−1 |
| Nd production | −3.3 |
| Dy production | −0.2 |
| Tb production | −0.02 |
| REE magnet production | −290 |
| GWP benefit | +1200 |
| Overall benefit | +906 |
24.5 Global Wind Energy Projections
The International Energy Agency (IEA) predicts the evolution of the global energy sector toward 2040 [44]. The projections are divided into three primary scenarios that assess key aspects: energy sources by regions and sectors; energy security and environmental protection; and economic development. The three core scenarios and their underlying assumptions about the evolution of energy-related government policies are summarized below:
• The Current Policies Scenario (CPS): This scenario only considers existing energy policies for which implementing measures have been formally adopted as of mid-2015 and make the assumption that these policies persist unchanged until 2040.
• The New Policies Scenario (NPS): In addition to incorporating the policies and measures that affect energy markets that have been adopted as of mid-2015, it also takes into account other relevant intentions that have been announced, even when the precise implementing measures have yet to be fully defined. This includes the energy-related components of the Intended Nationally Determined Contributions (INDCs), submitted by national governments by October 01, 2015 as pledges in the run-up to the United Nations Framework Convention on Climate Change Conference of the Parties (COP21). These policies include programmes to support renewable energy and improve energy efficiency, to promote alternative fuels and vehicles, carbon pricing, reform of energy subsidies, and the introduction, expansion or phase out of nuclear power. NPS is the moderate estimate of all three scenarios with considerations based on both existing and most likely developments for renewable energy growth.
• The 450 Scenario (450S): The “450” scenario assumes a set of policies based on the trajectory of GHG emissions from the energy sector that is consistent with the international goal to limit the rise in the long-term average global temperature to 2°C, compared with preindustrial levels. The policies collectively ensure an emission trajectory consistent with stabilization of the GHG concentration after 2100 at around 450 ppm. Compared to the previous two scenarios, 450S provides the most optimistic projection for renewable energy growth.
All scenarios have predicted a rapid growth of the renewable energy sector toward 2040. For example, in the NPS scenario, with increasing policy support from governments, reducing production and implementation costs, and greater scale use of new technologies, the fraction of renewable energy in total global energy market is expected to rise from 14% in 2014 to 19% in 2040, with a total renewable power generation of 78,000×1015 J (78,000 petajoules) in 2014 and 140,090 Mtoe (140,090 million tonnes of oil equivalent) in 2040 [44]. The electricity generations from renewable energy sources are projected to reach 13,429 TW h in 2040, with wind turbines expected to increase from 635 TW h in 2014 to 3568 TW h in 2040—an average 6.7% annual growth rate. The projected wind energy capacity requirements derived from all three scenarios are summarized in Fig. 24.7.

The substantial increase in global wind energy sector will require a corresponding growth in upstream REE-dependent component or material industries (e.g., NdFeB magnets) thus steering the economic drivers to increasing TREO+Y production over the coming decades along with other REE-dependent technologies.
24.6 Implications for Future REE Supply
The limited TREO+Y production capacity, China’s monopoly position in REE processing, and commercial, geopolitical, and environmental supply risks, all contribute to the implication that insufficient long-term REE supply will be the most severe constraint for wind energy to meet projected demands. In order to provide a more reliable and robust assessment of wind energy growth and expected demand, this sector presents a quantitative analysis of intercorrelations between available mineral resources [28], TREO+Y production capacity [28,39], and projected REE demands from IEA’s three wind energy scenarios (i.e., CPS, NPS, and 450S).
Fig. 24.8 shows the expected growth of global wind-based electricity generation capacity and evolution toward PMSG wind turbines. As estimated by Moss et al. [14], electricity production from PMSG wind farms will account for 15% of European wind energy market and 20% global market in 2030. The European Wind Energy Association, EWEA, established an ambitious goal for global offshore wind energy of 4.3% of overall wind demand in 2020 [47]. This assessment uses the European wind energy targets based on the growth of various PMSG technologies (i.e., medium-high vs low-speed PMSG) as a benchmark for global wind energy evolution. The cumulative REE demands (2013–40) to meet these global energy targets are summarized in Table 24.6.
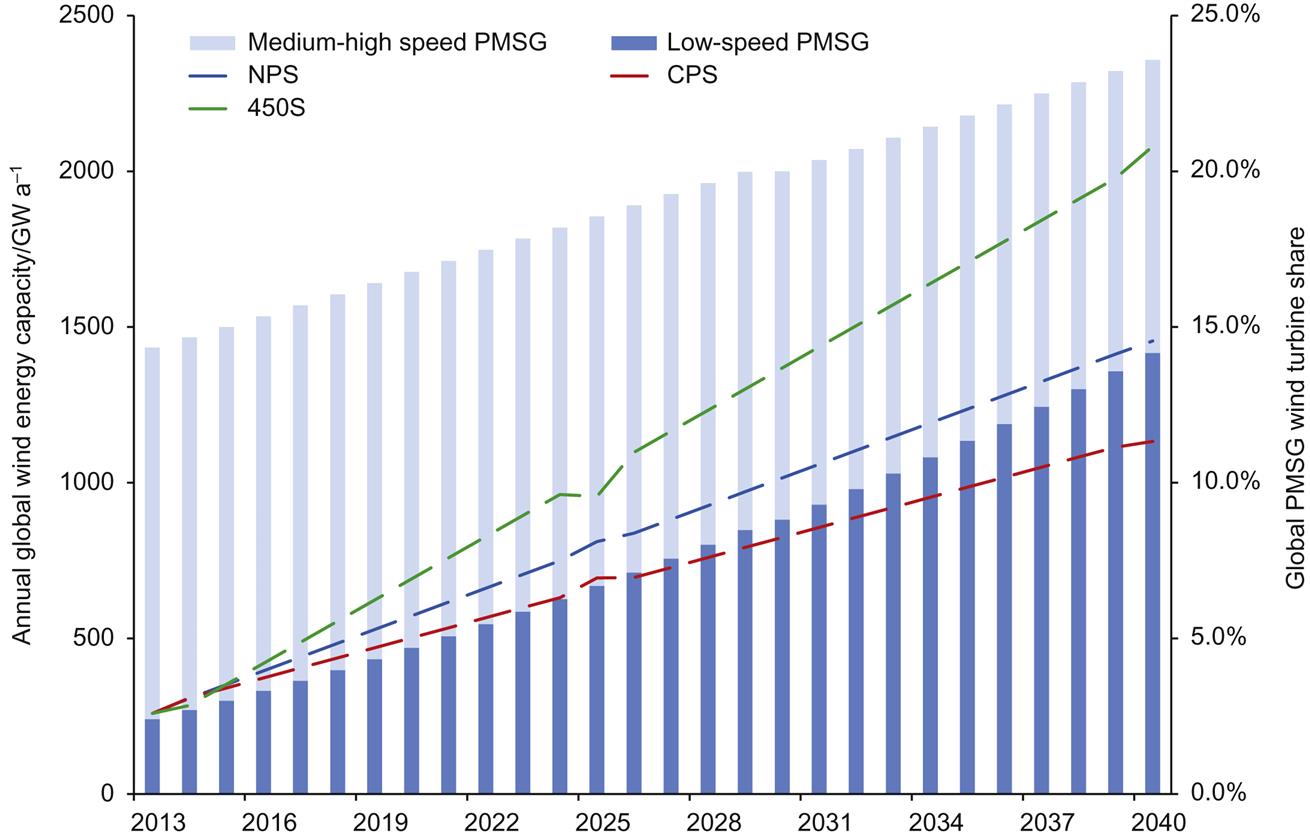
Table 24.6
Cumulative REE Demand (2013–40) Driven by Medium-High and Low-Speed Permanent Magnet Synchronous Generators (PMSG) Wind Turbines
| REE | Wind Energy Scenario | Cumulative Demands/(kt) | Mineral Resources/(kt) |
| Dy | CPS | 35 | 4 601 |
| NPS | 44 | ||
| 450S | 58.7 | ||
| Nd | CPS | 419 | 72 821 |
| NPS | 515 | ||
| 450S | 692.6 | ||
| Tb | CPS | 14 | 973 |
| NPS | 17 | ||
| 450S | 23.5 |
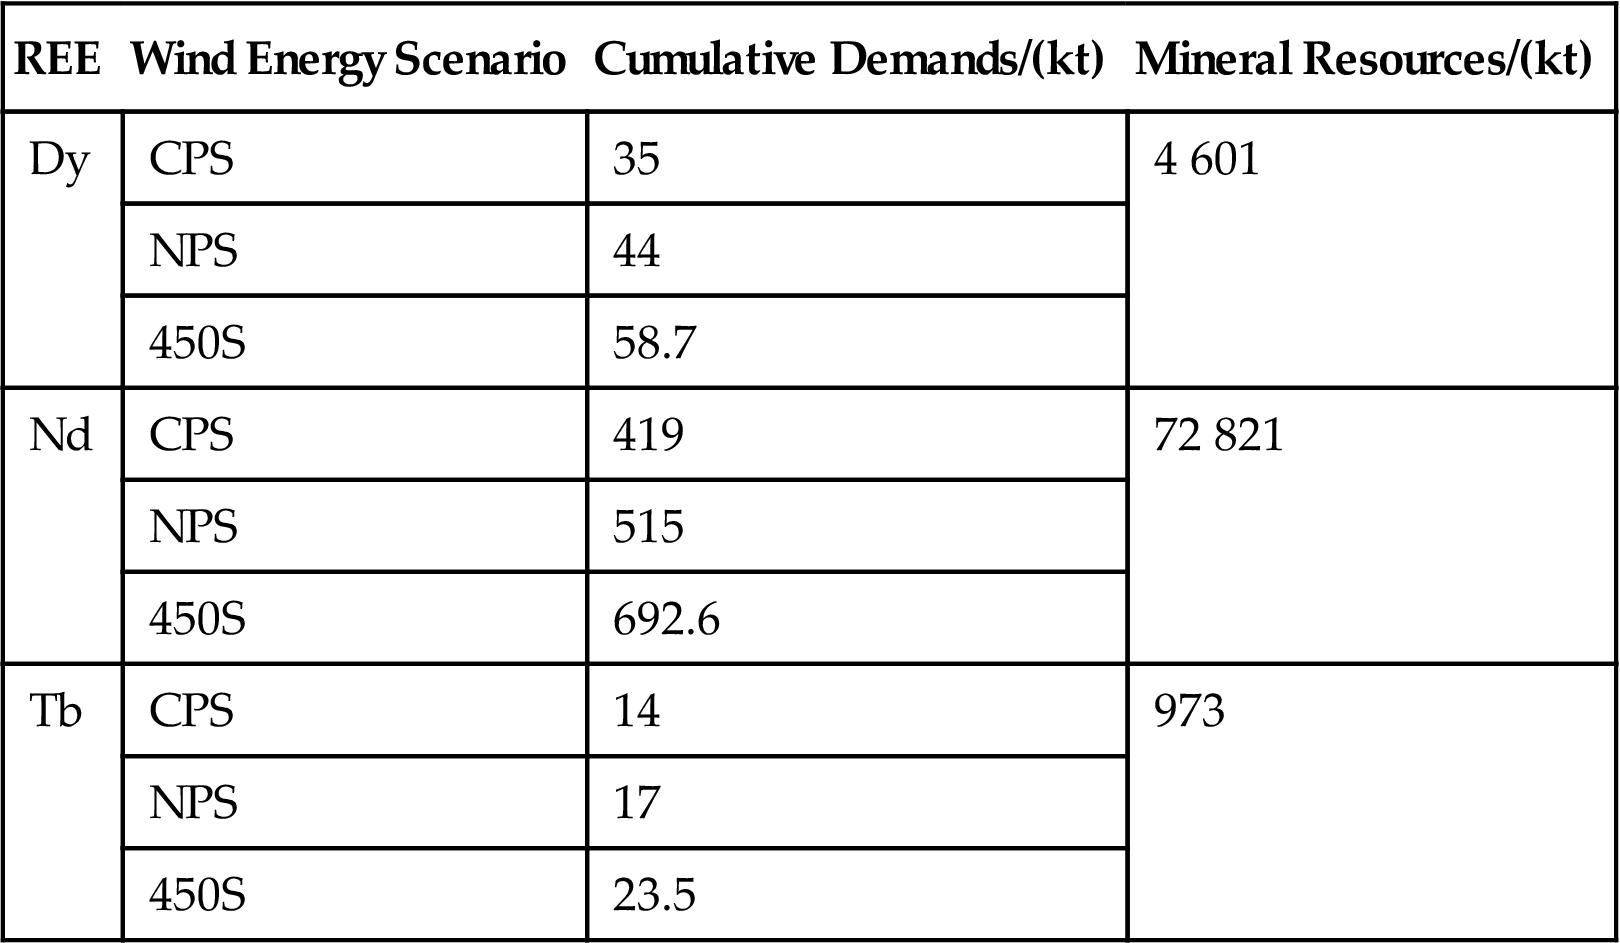
Again as stated by Weng et al. [28], the geological scarcity of available mineral resources is not an immediate problem for wind energy development. This can be gauged by considering the most ‘rare’ REE in the group—Tb. The estimated quantity of Tb in the world is 973 kt, which is more than enough to satisfy the most optimistic Tb (23.5 kt) demands, even considering the 450S scenario. Nd is also widely considered as one of the most critically scarce REE, however, as given in Table 24.6, the total Nd demands (considering the 450S scenario) of 693 kt accounts for less than 0.1% of geologically available Nd. However, converting these geological resources into saleable commodities or functional materials will require complex mining, beneficiation, and refining processes. Hence, the real limitation is the annual REE production capacity instead of the REE geological scarcity.
Fig. 24.9 shows the projected annual TREO+Y production based on Tb demand in wind turbines. The projected Tb demand based on all three scenarios (CPS, NPS, and 450S) increases from 63 t in 2013 to 1208, 1552, and 2218 t in 2040, respectively. Corresponding annual production required to meet these demands have increased from 2.12×10⁶ t (2.12 million tonnes) to 39×106 t, 50×106 t and 72×106 t TREO+Y, respectively, based on several key assumptions. These assumptions include: the average Tb proportion (0.11%) calculated from carbonatite REE deposits [28]; the average wind energy share (10%; [35]) of global REE permanent magnet market; and the permanent magnet share in global REE demand of 20% [16]. These assumptions were consistent throughout the modeling period (2013–14). According to Ref. [19], the reported annual global TREO+Y production is presently 110,000 t while the peak production occurred in 2006 with 137,000 t produced; this being only 6% of the expected supply to meet Tb demands in 2013. The main explanation of such significant difference between expected and reported TREO+Y production is that current global HREE are derived mainly from southern China ionic clay projects instead of traditional carbonatite projects with a much higher average HREE concentrations.

24.7 Conclusion
The use of REE permanent magnets will not compromise but enhance the environmental footprint of wind turbines. Furthermore they lead to greater environmental benefits for the life cycle of wind turbines, which includes the associated environmental impacts from REE mineral production stages. Therefore REE permanent magnets as key functional components will become even more critical for future wind turbine design and applications, especially given the market shifting toward high capacity low-speed PMSG wind turbines.
However, as a global industry, the overall environmental impact from increasing REE production are still significant especially considering the exponentially increasing global REE demands driven by other emerging technological applications like electric vehicles (EV), photovoltaic (PV) thin films, and new sustainable system in future. Hence novel REE extraction, recovery, and diverse supply chain based on various REE mineralogy are needed to cope with expected demands. Also instead of the long-term availability of REE mineral resources, the short to medium term TREO+Y production capacity and recovery efficiency are the main challenges for future REE supply.
Furthermore current global REE mineral resources are dominated by LREE instead of HREE (e.g. Dy, Tb, Er, etc.) with an average ratio of light rare earth element oxides (LREO) to heavy rare earth element oxides (HREO) of 13:1. The recent global REE supply has been dominated by the production of LREE-enriched bastnäsite-based carbonatite projects (e.g., Bayan Obo in China and the Mountain Pass in United States; the latter was shut down again in 2015). However, the predicted global REO consumption growth is mostly driven by increasing HREE (and particular LREE such as Eu, Nd) demands from the emerging and advanced technology sector. Therefore by simply increasing the production at the current carbonatite REE mines may result in an excess of LREE production while not being able to meet the demands for a particular HREE. As highlighted in Fig. 24.9, the expected Tb demands are simply too high based on traditional TREO+Y supply from bastnäsite-based carbonatite projects.