Growth Trends and the Future of Wind Energy
Lauha Fried, Shruti Shukla and Steve Sawyer, Global Wind Energy Council, Brussels, Belgium Email: [email protected]
Abstract
This chapter gives an overview of the current status of the global wind industry now present in over 80 countries; 26 of which have more than 1 GW installed, and 8 with more than 10 GW. The global wind industry had another record-breaking year in 2015, annual installations topping 63 GW; and not only did renewables surpass all other power sector investments, for the first time capital investments in renewables surpassed all capital investments in fossil fuels. By the end of 2015, there were about 433 GW of wind power spinning around the globe, a 17% increase over the previous year; and wind power supplied more new power generation than any other technology.
Looking ahead, Global Wind Energy Council (GWEC) sees wind power installations nearly doubling in the next 5 years. Wind power has become the least cost option when adding new capacity to the grid in an increasing number of markets, and prices continue to fall. Given the urgency to cut down CO2 emissions and continued reliance on imported fossil fuels, wind power’s pivotal role in the world’s future energy supply is assured.
Footnote The Global Wind Energy Council (GWEC) is the global trade association representing the wind industry. GWEC works at the highest international political level to create a better policy environment for wind power. GWEC’s mission is to ensure that wind power establishes itself as the answer to today’s energy challenges, providing substantial environmental and economic benefits. For more information visit: www.gwec.net.
Keywords
Wind power; wind energy; renewable energy; global wind market; global wind industry; climate; environment; clean energy; Global Wind Energy Council; GWEC
26.1 Introduction: Global Status of Wind Power (on- and Offshore) in 2015
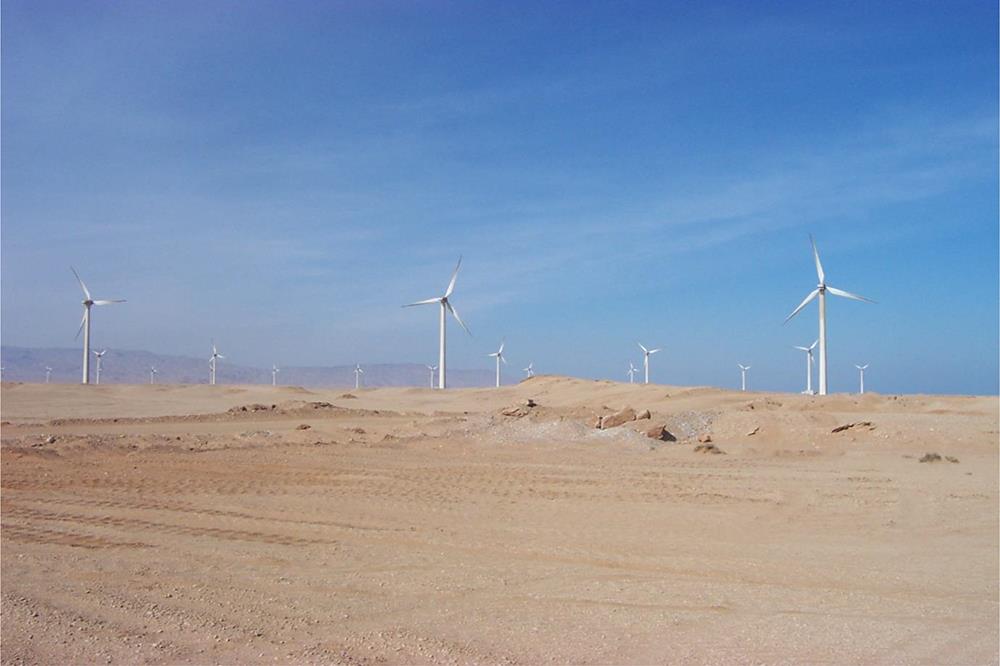
Wind power is a mature technology with proven reliability and cost competitiveness across an ever-increasing number of markets today. The cost-stability of wind power makes it a very attractive option for utilities, independent power producers, and companies who are looking for a hedge against the wildly fluctuating prices of fossil fuels while reducing their carbon footprint.
Wind power remains the most competitive way of adding new power generation capacity to the grid in a large number of markets around the world, even when competing against heavily subsidized conventional generation technologies.
If we are to have any chance of safeguarding the world against serious climate change, global CO2 emissions must be reduced before 2020, and a dramatic increase in renewable energy deployment is urgently required to help make this happen. In the short term the three key options available for mitigating greenhouse gas emissions include a rapid deployment of renewable energy, primarily wind power; escalation of efforts toward promoting energy efficiency and conservation; and fuel switching from coal to gas.
By 2020 the Global Wind Energy Council (GWEC) projections suggest that wind power alone could save 8.2×10⁹ t (8.2 billion tonnes) of CO2. On average each kilowatt hour of wind power generated avoids 600 g of CO2 by displacing the need for the generation of the same unit of electricity from conventional energy sources (coal, oil, or gas).
2015 was an unprecedented year for the wind industry as annual installations crossed the 60 GW mark for the first time in history. More than 63 GW of new wind power capacity was brought online. The last record was set in 2014 when over 51.7 GW of new capacity was installed globally.
In 2015 total investments in the clean energy sector reached a record US$ 329×109 (US$ 329 billion). The figures for 2015 were up 4% from 2014s investment of US$ 316×109 and beating the previous record, set in 2011 by 3% [1]. The new global total at the end of 2015 was 432.9 GW, representing cumulative market growth of more than 17%. This growth was powered by an astonishing new installations figure of 30.8 GW in China; the global wind power industry installed 63.5 GW in 2015, representing annual market growth of 22%.
China the largest overall market for wind power since 2009, retained the top spot in 2015. Installations in Asia again led global markets, with Europe in the second spot, and North America in third place.
As a result of this, was that in 2015, the majority of wind installations globally were outside the Organization for Economic Co-operation and Development (OECD) once again. This has been the case since 2010, with the exception of 2012. This trend will continue for the foreseeable future.
By the end of last year the number of countries with more than 1000 MW installed capacity was 26: including 17 in Europe; 4 in Asia-Pacific (China, India, Japan, and Australia); 3 in North America (Canada, Mexico, United States), 1 in Latin America (Brazil), and 1 in Africa (South Africa).
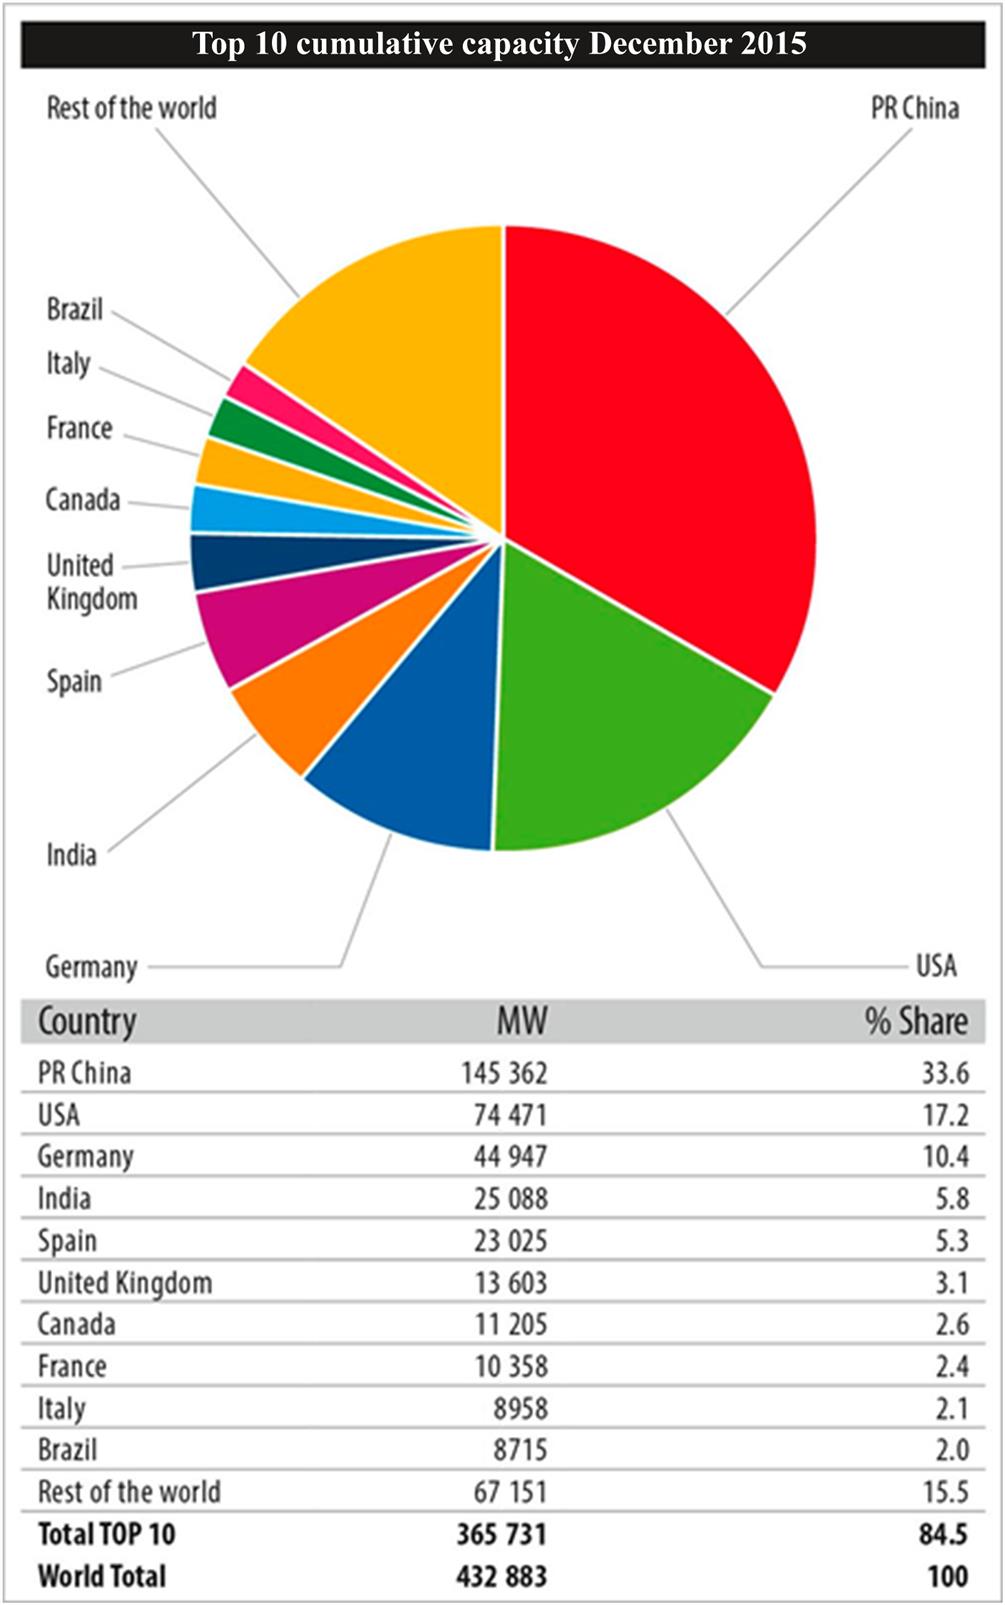
By the end of 2015 eight countries had more than 10 000 MW of installed capacity including China (145 362 MW), the United States (74 471 MW), Germany (44 947 MW), India (25 088 MW), Spain (23 025 MW), United Kingdom (13 603 MW), Canada (11 205 MW), and France (10 358 MW).
China crossed the 100 000 MW mark in 2014, adding another milestone to its already exceptional history of renewable energy development since 2005. This year it made history again and strengthened its position on the leaderboard.
Europe and North America both had strong years in 2015, led by Germany and the United States, respectively. Guatemala and Jordan each added their first large commercial wind farms, and South Africa became the first African market to pass the 1 GW mark.
26.1.1 Asia: Remarkable Year for China
For the seventh year in a row, Asia was the world’s largest regional market for new wind power development, with capacity additions totaling just over 33.9 GW.
In terms of annual installations China maintained its leadership position. China added 30.8 GW of new capacity in 2015, once again the highest annual number for any country ever.
In 2015 wind power generation in China reached 186.3 TW h, accounting for 3.3% of total electricity generation [2]. This follows a pattern of steady increase in wind-based electricity generation despite heavy curtailment. In 2012 wind-generated electricity in China was just over a 100 TW h, accounting for 2% of the country’s total electricity output. Wind provided almost 135 TW h of electricity in 2013, contributing 2.6% of the country’s total electricity generation [3]. Total wind power generation reached over 153 TW h in 2014, 2.78% of total electricity generation [4].
The Chinese wind market almost doubled its capacity from 75 GW in 2012 to reach 145 GW by the end of 2015, reinforcing China’s lead in terms of cumulative installed wind power capacity.
All observers continue to be surprised by the astonishing track record for growth of the wind sector in China over the last decade. The current pace of growth in the Chinese wind power market may see a slowdown in 2017. However, we have often been positively surprised when time and again when China’s latest installation figures are presented.
Curtailment on wind farms in China worsened in 2015, as plunging utilization rates kept almost 34 TW h from being delivered to the grid. According to the National Energy Administration (NEA), the country wasted 15% of wind power generated in 2015 [5].
Ongoing curtailment of electricity generation is a challenge for wind power projects. However, the NEA and State Grid are working to solve the transmission bottlenecks and other grid issues, and the situation is expected to improve.
India continues to be the second largest wind market in Asia, offering ample prospects for both international and domestic players. The Indian wind sector has struggled over the years to repeat the strong market performance of 2011 when over 3 GW was installed. 2015 seems to signal the onset of a recovery phase given the government desire to address some of the structural bottlenecks in the market.
India’s new wind energy installations totaled 2.6 GW in 2015, for a total of 25 GW. This kept the Indian wind power market firmly in the top five rankings globally. The total grid-connected renewable energy installations in the country reached approximately 39.5 GW [6].
The Indian government has committed to a target of 175 GW of renewables by 2022. The target includes achieving 100 GW of solar capacity and 60 GW of cumulative wind power capacity by 2022. The government has also indicated its support for rapidly growing the power sector, renewables being a core part of this strategy.
While the rest of Asia did not make much progress in 2015, there are some favorable signs on the horizon. The Japanese market installed almost 245 MW in 2015 to reach a cumulative capacity of 3 GW. This represents around 0.5% of the total power supply in Japan. Japan is slowly moving toward a transformation of its energy system to allow for a more diverse energy mix including more wind power and other renewables. However, removing existing barriers will take time. Offshore wind development, in particular floating turbines, is a promising prospect for the future.
Although South Korea still has “green growth” as one of its national development priorities, wind power is still a relatively small energy generation technology, with 225 MW of new installations in 2015, bringing total installed capacity to just over 835 MW.
Taiwan added 14 MW of new capacity, bringing its total installed capacity to 647 MW. As for the rest of Asia, we expect new projects to come online in Pakistan, Thailand, and Vietnam in 2016.
26.1.2 North America: Resurgence in the United States
The year 2015 ranks as the third highest year for wind installations for the United States, the single largest market in terms of total installed capacity after China. The US market added 4000 new turbines for a total of 8.6 GW last year, a 77% increase over 2014, and total installed capacity reached 74.5 GW.
Wind produced over 190 TW h in the United States in 2015, which was 4.7% of the total electricity generated in the United States.
Wind energy accounted for almost 31% of all new generating capacity installed between 2011 and 2016. Wind energy provided more than 25% of the electricity in Iowa and South Dakota, and 12% or more of the generation in a total of nine states [7].
In terms of annual capacity additions, Texas led the 2015 market with 3.6 GW, followed by Oklahoma (1.4 GW), Kansas (799 MW), Iowa (524 MW), and Colorado (399 MW).
At year-end wind developers reported more than 9.4 GW of construction activity across 72 projects in 22 states (plus Guam). This included over 1.8 GW of new construction announcements made toward the end of 2015.
The 5-year extension and phase out of production tax credit (PTC) provides the greatest degree of long-term policy stability the US wind industry has ever seen. This, combined with a broader range of customers, and an ongoing “wind rush” driven by technological improvements is setting the stage for more years like 2015 in the United States.
In Canada 1.5 GW of new wind capacity came online, making it the sixth largest market in 2015. Canada finished with over 11.2 GW of total installed capacity making it the seventh largest market globally in 2015. Canada’s new wind energy projects in 2015 represent over US$ 3×10⁹ (US$ 3 billion) in investment. At the end of 2015 wind power was supplying approximately 5% of Canada’s electricity demand. The Canadian wind industry demonstrated a 5-year annual average growth rate of 23% per annum.
Canada added new wind capacity through the commissioning of 36 projects, 23 of which involved Aboriginal Peoples, municipal or local ownership. For comparison in 2014 of the 37 new wind energy projects installed, 15 projects also included significant ownership stakes from Aboriginal Peoples, municipal or local ownership. This is a sign that local communities are taking a keen interest in wind energy.
Most of the growth was centered in the provinces of Ontario (871 MW), Quebec (397 MW), and Nova Scotia (186 MW). The Canadian industry expects to see another record year in 2016.
Mexico installed an impressive 713.6 MW of new capacity to reach a total of 3.0 GW by the end of 2015. Mexico’s Energy Reform legislation was enacted in December 2013.
Mexico has set an ambitious annual target of 2.0 GW a−1 until 2023. The country is facing one of its biggest energy challenges in 20 years, with the current energy reform opening up the electricity market like never before. The market reforms for the electricity sector are expected to have a significant impact on the future of wind power in the country. 2016 will be another strong year for the Mexican wind power market.
26.1.3 Europe: Unparalleled Year for Germany
Across Europe 13.8 GW of wind power was installed in 2015. The European Union member states (EU) accounted for 12.8 GW of the total.
There are now almost 141.6 GW installed in the EU with a total cumulative capacity of 147.7 GW for all of Europe. Wind power installed more than any other form of power generation in 2015, accounting for 44.2% of total 2015 power capacity installations. Wind energy overtook hydropower as the third largest source of power generation in the EU with a 15.6% share of total power capacity by the end of 2015.
Renewables accounted for 77% of new power plant installations in 2015 (22.3 GW of a total of 29 GW) of which wind accounted for 44%.
The overall EU installation levels mask significant volatility across Europe. Germany alone accounted for almost 50% of total EU wind energy installations with 6.0 GW. Poland at 1.3 GW and France at 1.1 GW were the only two other markets to install over 1 GW during the year. Together these three countries account for over two-thirds of all installations. In a number of previously healthy markets such as Sweden and the United Kingdom, installations slowed down significantly.
At the end of 2015 the EU had 142 GW of installed wind power capacity of which 131 GW was onshore and 11 GW offshore. However, 47% of all new EU installations in 2015 took place in Germany and 73% occurred in the top four markets, a similar trend to the one seen in 2014. This is unlike previous years when installations were less concentrated and spread across many more healthy European markets.
In Europe wind energy development saw €26.4×10⁹ (€26.4 billion) invested in 2015, 40% higher than the total investment in 2014. While wind power led 2015 installations, solar photovoltaics accounted for 29%, coal 16%, and gas 6.4%.
Germany remains the EU country with the largest installed capacity (44.9 GW), followed by Spain (23 GW), United Kingdom (13.6 GW), France (10 GW), and Italy (9 GW). Sweden, Denmark, Poland, and Portugal have more than 5 GW installed.
Annual installations of wind power in the EU have increased over the last 14 years, from 3.2 GW in 2000, to 12.8 GW in 2015 at a compound annual growth rate (CAGR) of 9%. Wind power accounts for one-third of all new power installations since 2000 in the EU.
In 2015 the annual onshore market in the EU decreased by 7.8%, but offshore installations more than doubled compared to 2014. Overall EU wind energy annual installations increased by 6.3% compared to 2014.
Offshore wind accounted for almost a quarter of total EU wind power installations in 2015, and investment in offshore wind in Europe doubled to €13.3×10⁹ (€13.3 billion). It was a record year for financing and grid-connected installations. Germany (2.3 GW), United Kingdom (572 MW), and the Netherlands (180 MW) were the three countries to grid-connect new offshore wind turbines in 2015 with 14 projects reaching completion.
The United Kingdom still has the largest offshore wind capacity in Europe at 5.1 GW, accounting for 46% of total European installations. Germany had a stellar year and rose to the second spot in 2015. Germany saw total installation rise to 3.3 GW (29.9%). With 1.3 GW (11.5%), Denmark is third, followed by Belgium at 712 MW (6.5%), the Netherlands at 427 MW (3.9%), and Sweden with 202 MW (1.8%). Other small markets include Finland with 26 MW, Ireland with 25 MW, Spain with 5 MW; Norway with 2 MW, and Portugal with 2 MW.
Weakened legislative frameworks, ongoing economic crisis and austerity measures implemented across Europe continue to hinder growth of the wind power industry. The year ahead is likely to be difficult but the broader investment shift away from fossil fuels could boost the European renewables sector.
Beyond the EU, Turkey is the largest market, with annual installations of 956 MW in 2015. The Turkish market reached a cumulative installed capacity of 4.7 GW last year. Looking ahead, the future of wind sector in Turkey looks promising.
26.1.4 Latin America and the Caribbean: Brazil Continues to Lead
Latin America and the Caribbean had a good year. The region saw 3.7 GW of new capacity come online, bringing total installed capacity to 12.2 GW. Latin America has begun developing a substantial wind power industry to complement its rich hydro and biomass (and potentially solar) resources.
Post the Paris Agreement at the Conference of Parties 21 (COP21) [8], the demand for clean energy bolstered by concerns for energy security and diversity of supply will promote the growth of wind power in Latin America and the Caribbean.
For the fourth year in a row the Latin American market installed over 1 GW of new capacity. In 2012 six markets in the region installed 1.2 GW of new wind capacity for a total installed capacity of just over 3.5 GW. In 2013 just five markets including Argentina, Brazil, Chile, Dominican Republic, and Uruguay accounted for 1.2 GW of new wind power capacity for a total installed capacity of 4.7 GW. In 2014 ten markets added new capacity. These included Argentina, Brazil, Chile, Costa Rica, Ecuador, Peru, Honduras, Nicaragua, Venezuela, and Uruguay. In 2015 eight markets added new capacity. These included Argentina, Brazil, Chile, Costa Rica, Guatemala, Honduras, Panama, and Uruguay.
Brazil led Latin America with installations of almost 2.8 GW; although the projects were fully commissioned not all of them could be given a grid connection before the end of the year. Brazil continues to be the most promising onshore market for wind energy in the region out to 2020.
Uruguay has a goal to generate as much as 38% of its power from wind by the end of 2017 and added almost 316 MW, bringing its total installed capacity to over 845 MW. With its neighbors Argentina and Brazil, Uruguay has traded electricity for years. In 2013 for the first time in more than a decade Uruguay did not import electricity from its neighbors selling US$ 21×106 (US$ 21 million) worth of electricity to Argentina in 2013. The National Utility—UTE and Brazil’s Eletrobras are testing a 500 MW transmission line, which could enable Uruguay to add more wind power [9].
Chile added 169 MW of new capacity to reach a total installed capacity of almost 1 GW. Panama added record capacity of 235 MW to reach 270 MW, and Costa Rica added 70 MW of new capacity to reach a total of 268 MW. Honduras saw its total installed capacity reach 176 MW, when it added 50 MW of new capacity in 2015. Guatemala for the first time added wind power to its energy mix in 2015, with a 50 MW project.
Argentina added 8 MW of new capacity to bring its total installed capacity up to 279 MW last year. The Caribbean reached a total installed capacity of 250 MW across various island states by the end of 2015.
26.1.5 Pacific
The region saw its total installed capacity rise to just over 4.8 GW last year. The Australia added 380 MW in 2015, bringing its total installed capacity up to 4.2 GW.
The previous Australian Prime Minister did not support renewables and was causing significant difficulties for the renewable energy industry in Australia. In a strange move in the run up to COP21 last year, the Australian parliament approved legislation cutting the Renewable Energy Target from 41 to 33 TW h [10]. However, the target is at least now fixed, and the new Prime Minister is more forward looking. In a positive development, the province of South Australia committed to a new target of zero net emissions by 2050 last year.
Samoa added 550 kW of new wind power capacity in 2015. This was the first wind project in the Pacific Island nation. The project site is located on the island of Upolu; Samoa’s second largest island. United Arab Emirates-based energy firm Masdar developed the project with funds from the UAE’s Pacific Partnership Fund.
New Zealand and the rest of the Pacific did not add any new wind power capacity in 2015, just like 2014.
26.1.6 Africa and the Middle East
The Africa and Middle East region saw 953 MW of new capacity additions last year, bringing cumulative capacity for the region up to 3.5 GW. Africa’s wind resource is best around the coasts and in the eastern highlands, but until last year it was in North and East Africa that wind power has been developed at scale.
South Africa installed 483 MW of new capacity, for a cumulative capacity of 1.1 GW. This is just the beginning of a promising wind market in the region, which has surpassed 1 GW in just 2 years.
Egypt saw a new wind farm come online in 2015. It is one of the largest wind farms in Africa with 100 turbines with a total capacity of 200 MW. It was inaugurated in Egypt’s Gulf of El-Zayt. This brought Egypt’s total installed capacity up to 810 MW. Egypt wants to source 20% of its energy from renewable sources by 2030.
Ethiopia had a good year as well, as 153 MW of new capacity came online last year. This brought total installed capacity in Ethiopia to over 324 MW.
In 2015 Jordan added its first large wind farm (117 MW) to its generation mix for a total of 119 MW. The Tafila wind farm is the first utility scale wind power project in the Middle East. The wind farm accounts for almost 6.5% of Jordan’s 1.8 GW renewable energy target for 2020 [11].
At the end of 2015 over 99% of the region’s total wind installations were spread across 10 countries—South Africa (1053 MW), Morocco (787 MW), Egypt (810 MW), Tunisia (245 MW), Ethiopia (324 MW), Jordan (119 MW), Iran (91 MW), Cape Verde (24 MW), Kenya (19 MW), Israel (6.25 MW), and Algeria (10 MW). New projects are expected to come online in Egypt, Ethiopia, Kenya, Morocco, Tanzania, and South Africa in 2016.
26.1.7 2015: Extraordinary Year Fueled by China’s FIT Reduction Plan
After a slowdown in 2013 the wind industry set a new record for annual installations in 2014 by installing 51.7 GW of new wind power. In 2015, however, the global wind industry smashed all previous records by installing over 63 GW of new capacity—see Figs. 26.1–26.3.
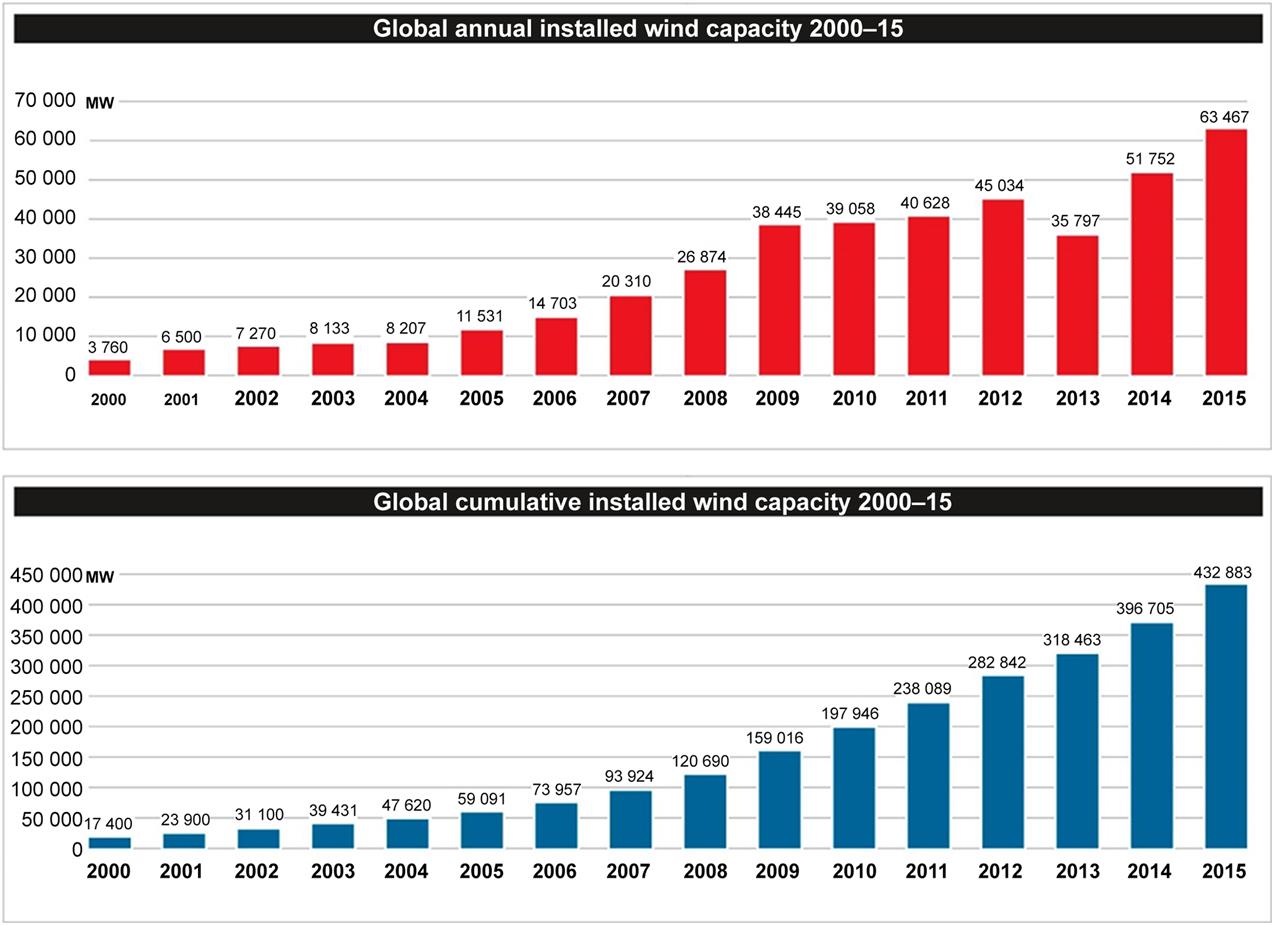
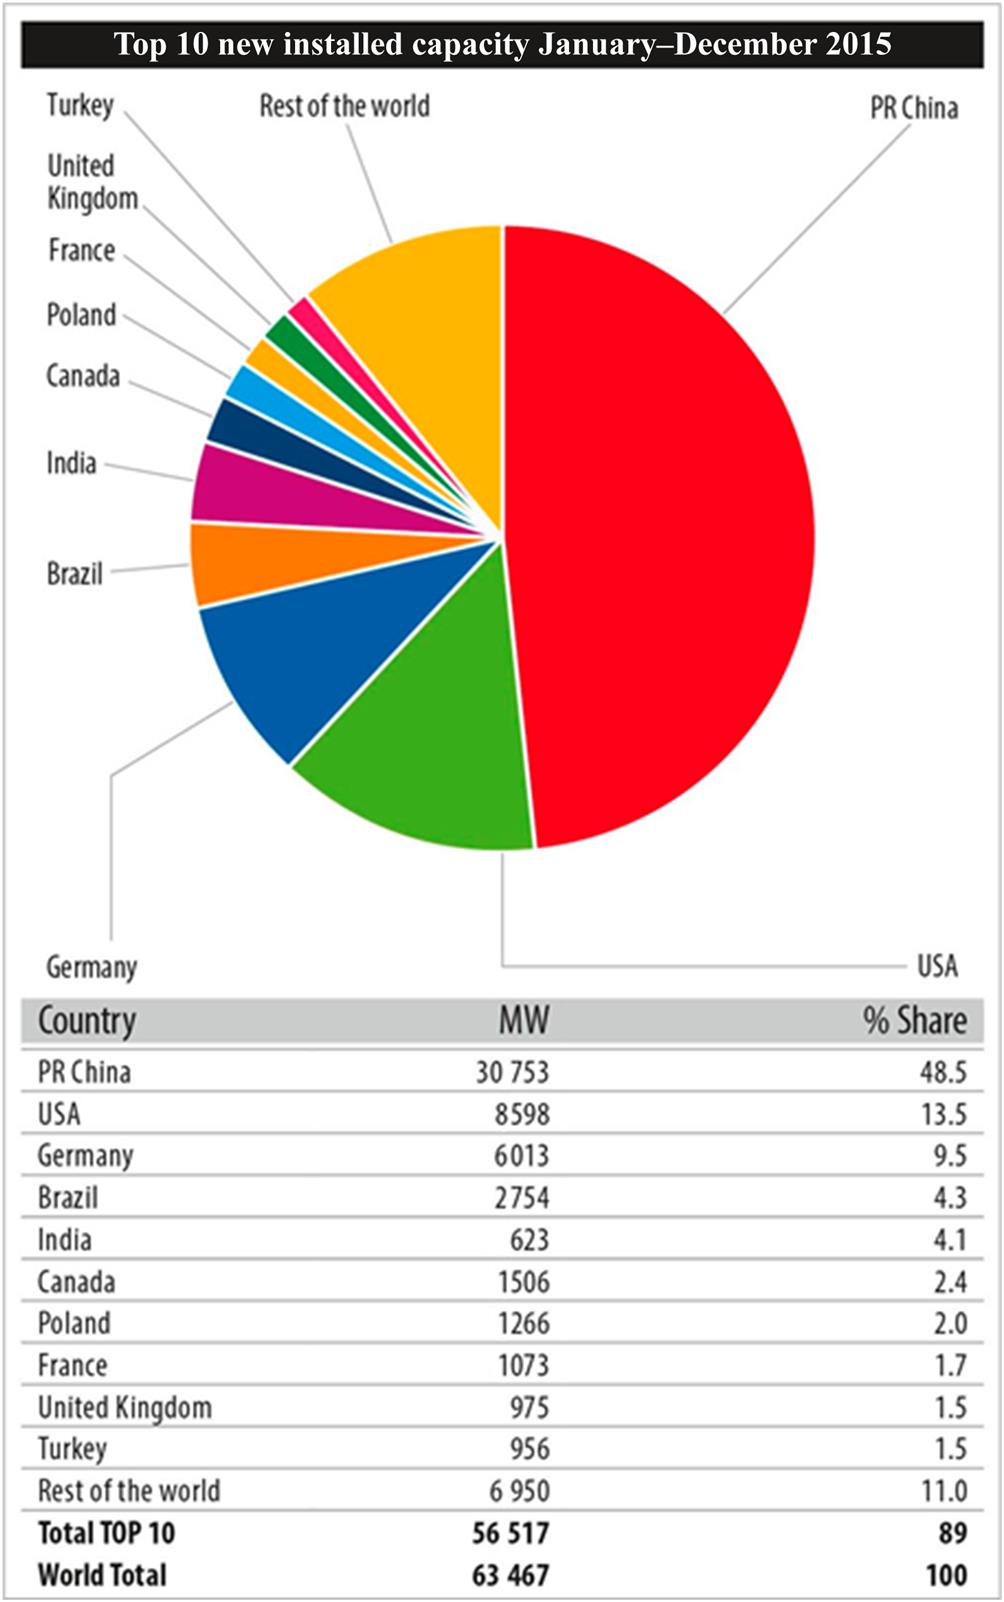
The record-setting figure represents a 22% increase in the annual market. Total cumulative installations stood at 432 GW at the end of 2015, representing cumulative growth of 17%. This record was led by China’s annual capacity addition, which alone accounted for 48% of total global installations.
2015 was a big year for the big markets—China, the United States, Germany, and Brazil, all of which set new records. But there is a lot of activity in new markets around the world and in 2016 the installations are likely to see a broader distribution.
There is a still an acute need around the world for new power generation, which is clean, affordable, indigenous, reliable, and quick to install. Wind power is leading the charge in the transition away from fossil fuels; and is blowing away the competition on price, performance, and reliability.
26.2 Offshore Wind Energy
2015 was a significant year for offshore wind installations. New capacity additions totaled more than 3.4 GW across five global markets. This brought the total offshore wind installed capacity to over 12 GW. See Fig. 26.4.

At the end of 2015 more than 91% (11.0 GW) of all offshore wind installations were located in waters off the coast of 11 European countries. The remaining 9% of the installed capacity is located largely in China, followed by Japan and South Korea.
Globally the United Kingdom is the largest offshore wind market today and accounts for over 40% of the installed capacity, followed by Germany in the second spot with 27%. Denmark accounts for 10.5%, Belgium for almost 6%, Netherlands for 3.5%, and Sweden for 1.6%. Other European markets including Finland, Ireland, Norway, Spain, and Portugal make up about 0.5% of the market. The largest market outside of the European waters is China, which accounts for approximately 8.4% of the global market in the sector.
Governments outside of Europe are now setting ambitious targets for offshore wind and development is starting to take off in some of these markets. Japan, South Korea, and Taiwan have put actual turbines in the water. The United States saw the first commercial project start construction in 2015. The GWEC led FOWIND consortium is developing an offshore wind roadmap for India.
Relatively higher costs and installation complexity compared to onshore wind are a big challenge for offshore wind development. However, according to a study [12] commissioned by E&Y in 2015, offshore wind cost could be reduced to €90 (MW h)−1 (€90 per megawatt hour) by 2030. The report says that the sector will have nearly reduced the LCOE to €100 (MW h)−1 by 2020, by which time cumulative installed capacity in European waters is expected to have reached 23.5 GW.
Key cost reduction steps include: deploying larger turbines to increase energy capture (a 9% saving); encouraging greater competition (7%); keeping the volumes up (7%); and tackling supply-chain challenges (3%). The offshore industry is on its way to meeting the goal of getting the leveled cost of electricity (LCOE) down to €100 (MW h)−1. At present the average offshore wind turbine size is 4.2 MW in European waters, average water depth 27.1 m and average distance from shore 43.3 km.
26.2.1 Europe Passes 11 GW Mark
In 2015 an astounding 3.0 GW of new offshore wind capacity came online in Europe, a 108% increase over the 2014 market. Offshore wind accounted for 24% of total EU wind power installations in 2015, up from 13% share of annual additions in 2014.
Three underlying factors enabled this growth: effective policy, the grid connectivity of large amounts of offshore capacity installed but not grid-connected in 2014, and the industry’s rush to complete installations before the German market switches to market-based arrangements in 2017.
Overall 419 new turbines were erected in 2015. Also for the first time offshore turbines were decommissioned. A total of 7 turbines in the United Kingdom and Sweden were decommissioned, resulting in a net addition of 412 turbines. A total of 14 projects were completed in 2015.
Over 75% of all net capacity brought online was in Germany (2.3 GW), a fourfold increase in its grid-connected capacity compared to 2014. This was in large part due to the delay in grid connections finally coming online in 2015.
The remaining installations in the EU took place in just two markets. The second largest market was the United Kingdom with 572 MW, and an 18.7% share of total installations. The Netherlands follows with 180 MW, a 5.9% share of the market.
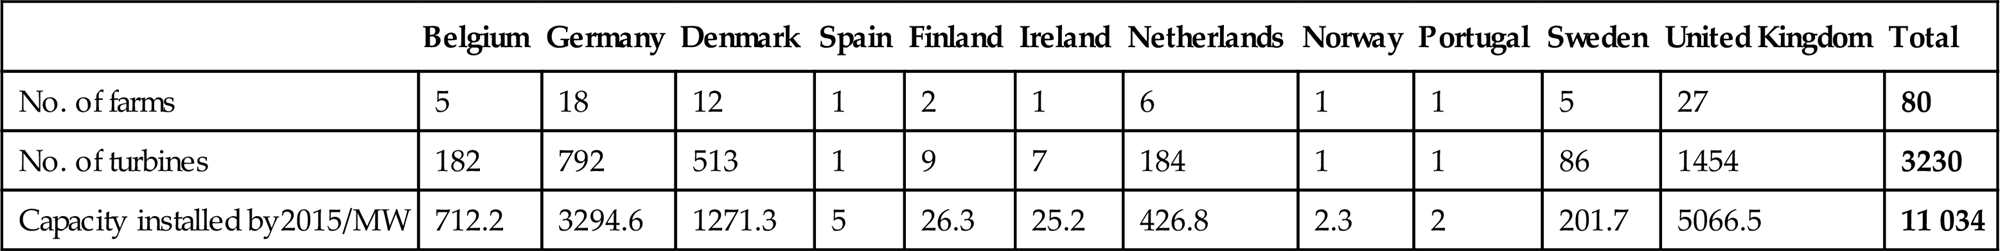
Overall 3230 turbines are now installed and grid-connected, bringing the cumulative total to just above 11 GW in Europe. The currently installed capacity is capable of producing 40.6 TW h in a normal wind year. See Table 26.1.
Table 26.1
Number of Wind Farms, Turbines, and MW Fully Connected to the Grid in Europe (2015)
| Belgium | Germany | Denmark | Spain | Finland | Ireland | Netherlands | Norway | Portugal | Sweden | United Kingdom | Total | |
| No. of farms | 5 | 18 | 12 | 1 | 2 | 1 | 6 | 1 | 1 | 5 | 27 | 80 |
| No. of turbines | 182 | 792 | 513 | 1 | 9 | 7 | 184 | 1 | 1 | 86 | 1454 | 3230 |
| Capacity installed by2015/MW | 712.2 | 3294.6 | 1271.3 | 5 | 26.3 | 25.2 | 426.8 | 2.3 | 2 | 201.7 | 5066.5 | 11 034 |
Source: EWEA (2016); Rounding and decommissioning of 16 MW affect the sums.
The United Kingdom has the largest amount of installed offshore wind capacity in Europe at over 5 GW representing almost 46% of all installations. Germany follows with 3.2 GW with almost 30% share of all installations. Denmark stands third with 1.2 GW installed capacity accounting for 11.5% of total European installations. By the end of 2015 Belgium had 712 MW with 6.5% market share, the Netherlands had 427 MW with 3.9% market share, Sweden had 202 MW with 1.8% market share. Finland had 26 MW installed and Ireland had installed 25.2 MW. Spain, Norway, and Portugal each have one wind turbine operating offshore.
Siemens is the lead offshore wind turbine supplier in Europe with 63.5% of total installed capacity. MHI Vestas (18.5%) is the second biggest turbine supplier, followed by Senvion (7.4%), Adwen (5.7%), and BARD (3.6%).
In terms of the total number of wind turbines connected to the grid at the end of 2015, Siemens remains the top supplier with 2059 turbines, accounting for 63.6% of the market.
MHI Vestas has 750 grid-connected turbines representing 23.2% of the total, followed by Senvion (140 turbines, 4.3%), Adwen (127 turbines, 3.9%), BARD (80 turbines, 2.5%), WinWind (18 turbines, 0.6%), and GE Renewable Energy with 15 turbines (0.5%).
2015 also marked an important year for offshore wind financing. Ten projects worth €13.3 ×10⁹ (13.3 billion euros) in total reached final investment decision in 2015, compared to €6.5 ×10⁹ in 2014. In total 3 GW of new gross capacity were financed across four countries, 66% of which was in the United Kingdom.
Total investments in offshore wind in 2015 were more than €18 ×109; this includes investments in construction of offshore wind projects, transmission assets, and refinancing. This makes 2015 a record year in terms of total committed funds.
An estimated financing of €11×109 will be needed for just over 3 GW of new capacity in 2016. Several transactions are already under appraisal or expected to go through final investment decision in 2016.
Projects under appraisal include the Otary Rentel (294 MW) wind farm, Hornsea Phase 1 (1 200 MW), Hohe See (492 MW), Dudgeon (402 MW), Beatrice (664 MW), and the refinancing of Luchterduinen (129 MW).
Additionally reduced risk perception for offshore wind projects has led to the emergence of project bonds as a means of financing. For the first time in 2015 €1.5 ×10⁹ was raised through project bonds for the construction and refinancing of offshore wind farms.
26.2.2 UK Remains Largest Global Market
The United Kingdom has the highest share of consented offshore wind capacity today. It continued to lead the world’s offshore industry in terms of cumulative installations in 2015.
Out of the 22 offshore wind farms where work was carried out in Europe last year, five were in the United Kingdom. At four offshore wind sites—Gwynt y Môr, Westernmost Rough, Humber Gateway, and Kentish Flats 2 Extension—153 turbines were connected in 2015, for a total annual market of 572 MW. At one offshore wind farm—Robin Rigg—two turbines of 3 MW each were decommissioned.
At the time of writing over 4 GW of projects are fully contracted and will be delivered over the next 4 years, with a further 1 GW anticipated to reach financial close within weeks.
In November 2015 Amber Rudd, UK’s Minister for Climate and Energy stated that based on current plans the country expects to see 10 GW of offshore wind installed by 2020. However, this is linked to the industry meeting its obligation of bringing offshore costs to under £100 (MW h)−1 (GBP 100 per megawatt hour) by 2020. The UK industry is well on its way to meeting this goal. The Minister further said that the government will make funding available for three auctions and intends to hold the first of these auctions by the end of 2016 [13].
26.2.3 Germany Had an Exceptional Year
The offshore wind industry in Germany had a record year. A total of 546 offshore wind turbines came online bringing the offshore capacity in Germany up to 2.3 GW. Over 75% of all net capacity brought online in Europe was in Germany, a fourfold increase in its grid-connected capacity compared to 2014. Cumulatively Germany accounts for about 30% of the offshore capacity installed in Europe.
The German offshore wind market had surpassed the 1 GW mark in 2014, more than doubling both 2013s annual market and the country’s cumulative offshore capacity. At the end of 2015 Germany accounted for almost 26% of all consented projects in Europe. Sites in Germany are an average of 52.6 km from shore. The total number of turbines connected to the grid by December 31, 2015 up to 792, with a combined capacity of 3.3 GW.
In 2015 Germany saw 41 wind turbines with a total capacity of 246 MW fully erected, but not yet connected to the grid. One hundred twenty-two foundations were constructed offshore in 2015 for wind turbines to be installed in 2016.
According to the working group AG Energiebilanzen, offshore wind turbines produced over 8 TW h of electricity in 2015. This was enough to cover the power consumption of over 2 million households or around 1.4% of the gross electricity generation in Germany that year [14].
In 2016 the German government is expected to adopt a revision to the Renewable Energy Sources Act (EEG), which will lay the foundations for a stable domestic market. The German offshore sector under the EEG 2016 will see an intermediate expansion target of 11 GW by 2025. This will limit the annual market to approximately 700 MW over the next 10 years.
The industry considers reliable, continuous expansion more important in the long term than any one-off records. To achieve such continuity it is necessary that the Renewable Energy Sources Act (EEG) 2016 and the Offshore Grid Development Plan (O-NEP) 2025 are properly coordinated. The industry has asked for the annual market to be at least 900 MW so as to be able to achieve economies-of-scale and long-term certainty for investing in further cost reductions. It is expected that Germany will add approximately 700 MW of new offshore capacity in 2016.
26.2.4 Netherlands: Fourth Largest Market Globally
In 2015 Netherlands added 180 MW of offshore capacity, installing 60 turbines, which make it the world’s sixth largest offshore market. Netherland’s total installed capacity reached 427 MW by the end of last year.
The Netherlands has a 15% renewable energy goal out to 2020. It has a plan to expand the country’s offshore wind power capacity by 3.5 GW through several tenders by 2023.
In March 2016 the Senate approved a law that will allow the Dutch government to move ahead with an offshore wind tender. This amendment to the Dutch Electricity Act allows transmission operator TenneT to start construction of grid infrastructure required for the new wind farms off the country’s coast and at Borssele (Zeeland). This amendment also clarifies for wind farm developers the damage liability from delays and disruption to the grid.
A key challenge for the sector is to ensure a smooth running of the planned tenders for offshore wind energy. The first tender is expected to be held during spring 2016, a second one before the end of the year, and a further 1400 MW are planned to be auctioned in the Borssele area.
The industry has also a goal to reduce costs by 40% over the next 5 years. Over the longer term, the Dutch North Sea has huge potential to further develop large-scale wind after the 2023 targets have been achieved; to start with the already designated area of IImuiden Ver could accommodate 6.0 GW of offshore wind power.
26.2.5 France Gearing up to Deliver
Six offshore wind farms totaling 3 GW are currently under construction. The Round 1 projects include: Courseulles (500 MW), Fécamp (500 MW), Saint-Nazaire (500 MW), Saint-Brieuc (500 MW); and the Round 2 projects include: Dieppe-Le Tréport (500 MW) and Iles d’Yeu et de Noirmoutier (500 MW). The industry expects the third tender for offshore wind power to be launched by the end of 2016.
The key challenges faced by the sector are the need for cost reductions; integration of offshore farms within the maritime areas; and increased competition in the market. A public debate focusing on offshore wind power development in France is planned during the summer of 2016. The French wind industry has set ambitious goals to reach 12 GW of bottom-fixed and 6 GW of floating offshore wind capacity by 2030.
26.2.6 China Passes the 1 GW Milestone
By the end of 2015 China added 360.5 MW of new offshore capacity. This was a 57% increase over last year. At the end of 2015 cumulative installed capacity reached 1015 MW, making China the fourth largest market globally. See Table 26.2.
Table 26.2
China’s Offshore Installations 2007–15
| Year | New Installed Capacity/MW | Cumulative Installed Capacity/MW |
| 2007 | 1.5 | |
| 2009 | 14.0 | 15.5 |
| 2010 | 135.5 | 151 |
| 2011 | 109.58 | 260.58 |
| 2012 | 127.0 | 387.58 |
| 2013 | 39.0 | 426.58 |
| 2014 | 227.6 | 654.18 |
| 2015 | 360.5 | 1014.68 |
The new offshore projects are spread across sites along the coasts of Guangdong, Fujian, and Jiangsu provinces. The majority of Chinese offshore projects are installed in the shallow waters close to the shore, called inter-tidal projects, where the sites dry out (or nearly so) at low tide. Most of the projects in deeper waters, such as those granted under the first round of tenders, are either still in development or have just started construction. See details of the newly added offshore projects in the Table 26.2. Most of these projects are inter-tidal.
In China offshore development is accelerating slowly and is expected to pick up steam this year. An ever-increasing number of developers are “testing the waters” with inter-tidal offshore projects.
However, the major bottleneck for large-scale offshore development is the low FIT. This is currently set as RMB 0.85 (kW h)−1 (€0.12 per kilowatt hour or/US$ 0.13 per kilowatt hour)) for “near-shore” offshore projects and RMB 0.75 (kW h)−1 for inter-tidal projects. For projects to get this tariff there is a cut-off date of 2017. This is complicating matters and also making it difficult for some developers to make a decision given the uncertain course of the feed in tariff (FIT).
Another bottleneck is the difficulty in getting the all the necessary licenses, as the offshore projects are controlled by multiple government agencies. In some cases the environmental impact assessment (EIA) has been particularly difficult to conduct and finish.
China’s offshore wind progress will continue but at a much slower pace than the onshore growth. Local developers are seeking to gain experience and expertise in this sector. Major changes to this market are expected after 2017, when the existing tariff is set to expire and a new FIT for offshore will kick in.
26.2.7 Domestic Industry Moves Japan Forward
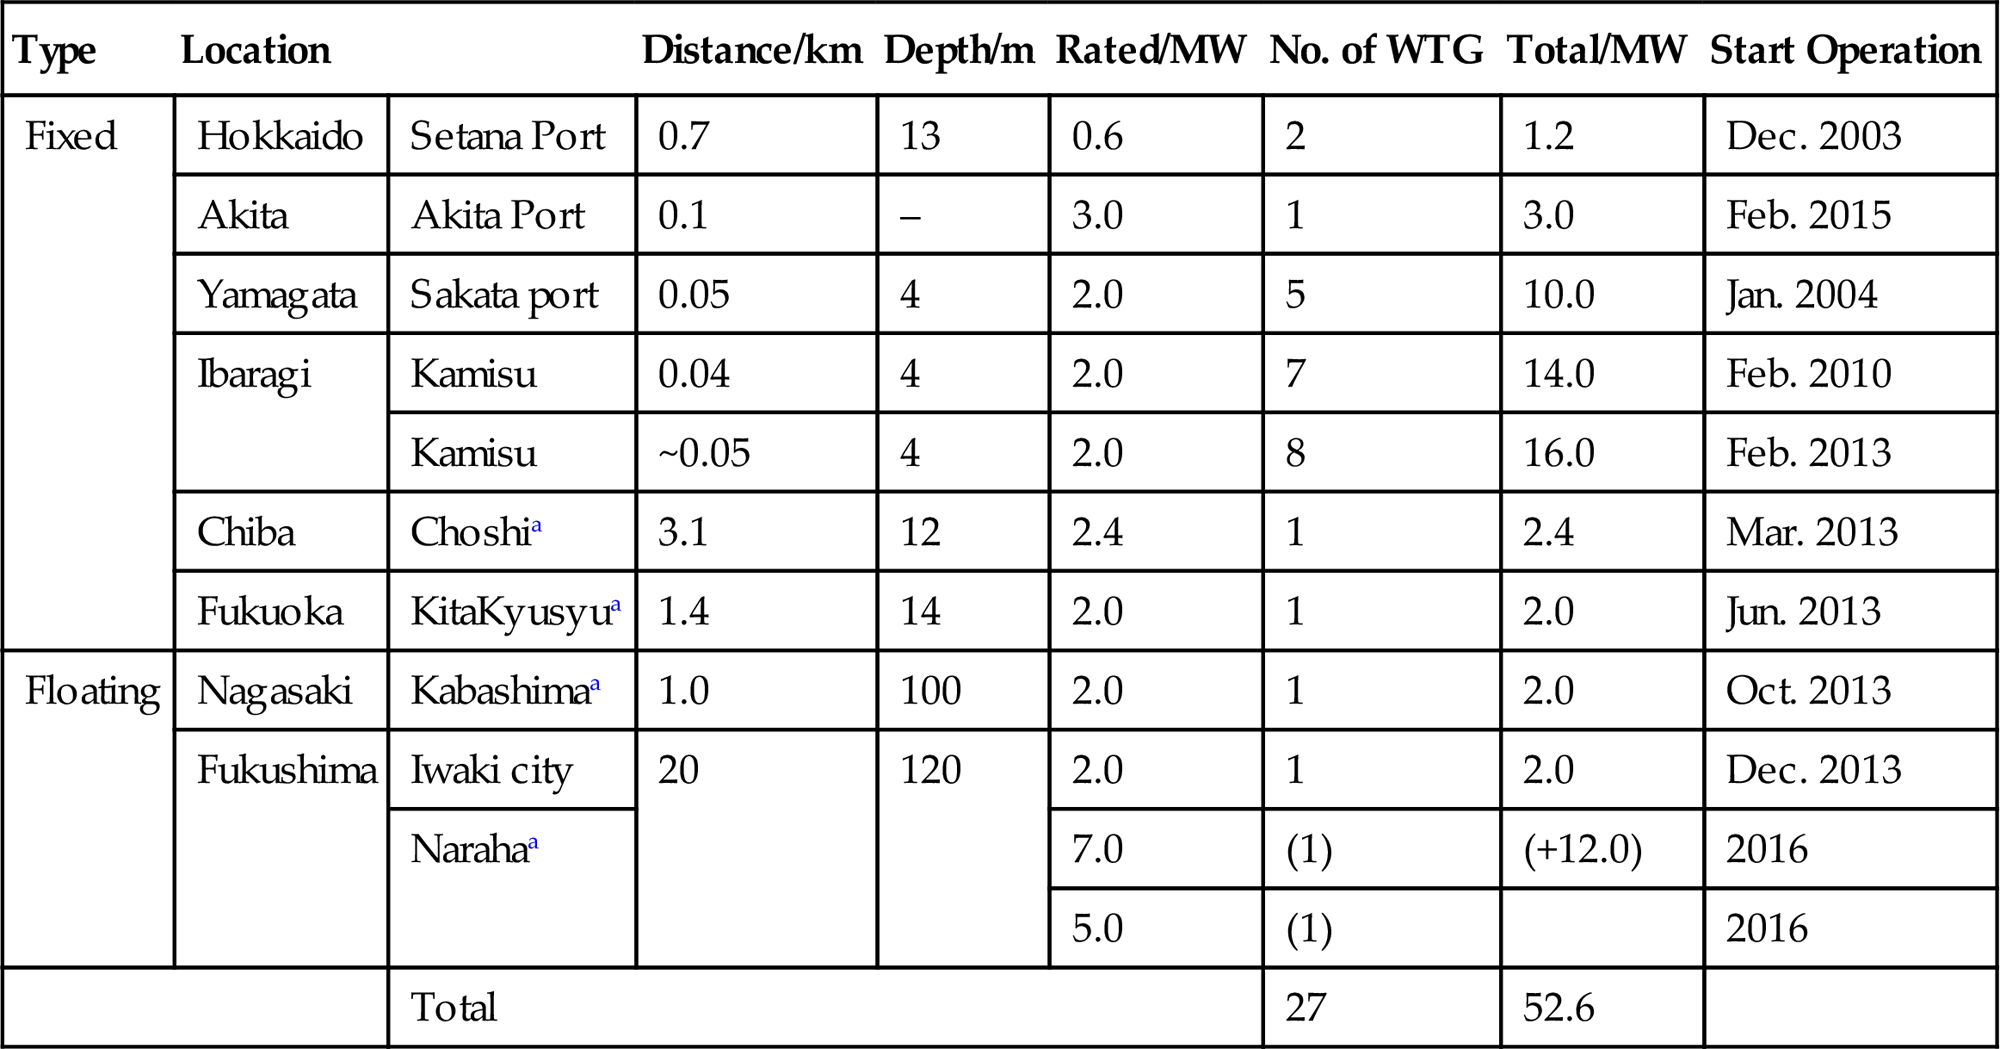
By the end of 2015 Japan had 53 MW of offshore wind power, including two 2 MW of floating wind turbines. A Siemens semioffshore 3 MW wind turbine was installed at the Eurus Akita port in 2015. The Japanese government fixed the FIT at JPY 36 (kW h)−1 (€28 or US$ 33 per kilowatt hour) for offshore wind power in March 2014. The offshore FIT is 1.6 times higher than the onshore tariff (JPY 22 (kW h)−1), which improves investment confidence in the sector. See Table 26.3.
Table 26.3
Offshore Wind Power in Japan at the End of 2015
| Type | Location | Distance/km | Depth/m | Rated/MW | No. of WTG | Total/MW | Start Operation | |
| Fixed | Hokkaido | Setana Port | 0.7 | 13 | 0.6 | 2 | 1.2 | Dec. 2003 |
| Akita | Akita Port | 0.1 | – | 3.0 | 1 | 3.0 | Feb. 2015 | |
| Yamagata | Sakata port | 0.05 | 4 | 2.0 | 5 | 10.0 | Jan. 2004 | |
| Ibaragi | Kamisu | 0.04 | 4 | 2.0 | 7 | 14.0 | Feb. 2010 | |
| Kamisu | ~0.05 | 4 | 2.0 | 8 | 16.0 | Feb. 2013 | ||
| Chiba | Choshia | 3.1 | 12 | 2.4 | 1 | 2.4 | Mar. 2013 | |
| Fukuoka | KitaKyusyua | 1.4 | 14 | 2.0 | 1 | 2.0 | Jun. 2013 | |
| Floating | Nagasaki | Kabashimaa | 1.0 | 100 | 2.0 | 1 | 2.0 | Oct. 2013 |
| Fukushima | Iwaki city | 20 | 120 | 2.0 | 1 | 2.0 | Dec. 2013 | |
| Narahaa | 7.0 | (1) | (+12.0) | 2016 | ||||
| 5.0 | (1) | 2016 | ||||||
| Total | 27 | 52.6 | ||||||
aNational projects: Under commissioning/construction.
12 MW of floating offshore turbines will start to operate in 2016. Several projects are expected to start construction within a couple of years; Kashima Port Project1-Phase1 shall be the earliest. Overall there are 1.4 GW of offshore wind power projects currently under planning.
Currently there is no law or regulation for offshore wind power development in Japan for undesignated areas. A marine area in Japan is categorized into two kinds, either as a Port associated area or as a General common sea area. The former one is controlled by port authorities, therefore the entity from whom official permissions are needed is clear. Unfortunately there is no law or regulation for the latter area. Hence there is a significant business risk for projects planned under the General common sea area at present.
All of the four projects installed up until 2013 were government-led investments and were mainly developed for testing different technologies. 2014 saw commercial development begin and bring a positive change echoing the introduction of the offshore FIT.
Ten commercial projects with a total capacity of 800 MW are being considered for the Port associated area and three projects with 580 MW are being considered for the General common sea area. The former is more feasible to develop thanks to lower business risk.
As for national projects the Japanese Ministry of Environment (MOE) is conducting a Floating Offshore Wind Turbine Demonstration Project (GOTO FOWT) at Kabashima in the Goto islands in the Nagasaki prefecture. A Hitachi 2 MW downwind rotor wind turbine on the spar-type floater has been in operation since October 2013. The electricity produced by this wind turbine was used for producing hydrogen in 2015. This turbine will soon be moved from Kabashima to Fukue Island, which has a bigger population and electricity demand.
As for METI’s Fukushima FORWARD project, the second floating offshore turbine (7 MW) was anchored in August 2015 and was commissioned thereafter. The third floating offshore turbine (5 MW) is being manufactured at Hitachi’s factory. This will be installed on the JMU’s advanced spar-type floater and will start operation in 2016. A total of three floating turbines with 12 MW capacity will start operation in 2016.
Japan’s New Energy and Industrial Technology Development Organization (NEDO) started a feasibility study for a new advanced floating offshore wind power demonstration project in 2015. Two groups are nominated as potential candidates. Each group will try to develop two floating offshore wind turbines within the rated capacity of 7.5 MW in total with the intention to achieve cost reduction compared to the former projects. The long coast line and high cost for onshore development, makes offshore wind an attractive option for the Japanese wind industry.
26.2.8 Upcoming Markets
26.2.8.1 US Set to Deliver the First Commercial Project
No offshore wind capacity is installed in the United States with the exception of the University of Maine’s 0.02 MW VolturnUS floating turbine project. The first wind farm will be commissioned 5 km (3 miles) off the coast of Block Island, Rhode Island.
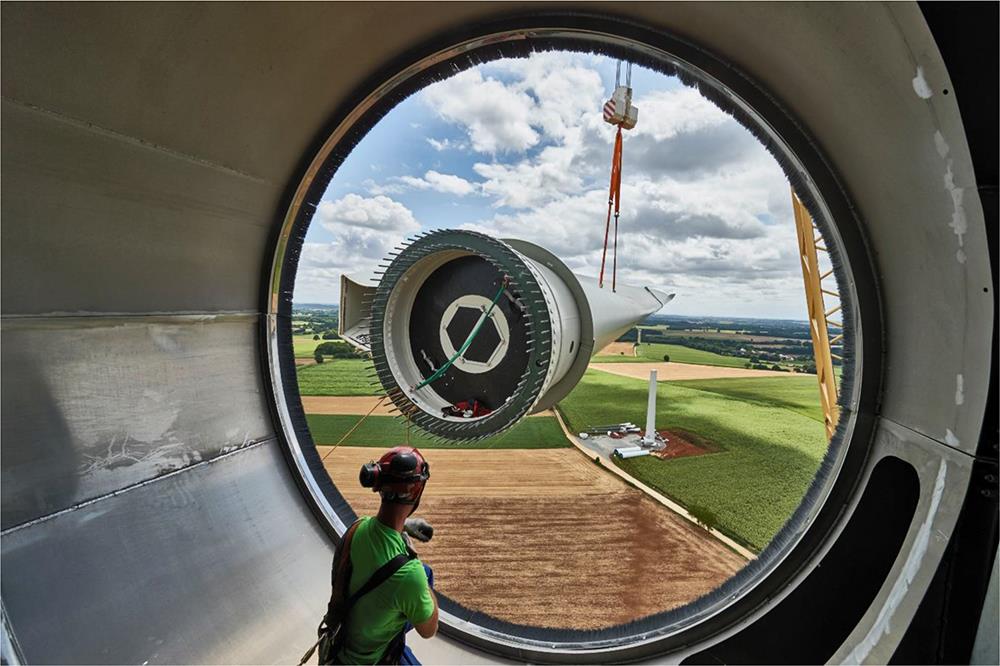
Construction on the 30 MW, US$ 290×106 (€255 million) project began in early 2015 and Deepwater Wind, the developer responsible for building the farm, says it is on track to be generating power by the fourth quarter of 2016. A construction milestone was celebrated in July 2015 when five steel foundation jackets and deck platforms were placed in the water.
According to the company’s website, the five-turbine farm will connect Block Island to the mainland for the first time with an underground cable and is expected to supply power to 17 200 Rhode Island homes by generating approximately 125 000 MW h a−1 where a refers to annum [15]. Block Island will receive about 90% of its energy needs from this project. Whenever the wind farm is under maintenance or not producing enough power, the mainland grid will serve the island. Diesel power is the current source of the island’s energy.
The National Renewable Energy Laboratory (NREL) estimates that the United States has 4200 GW of developable offshore wind potential, compared to its estimate of 11 000 GW of onshore wind potential. Wind resources are classified on a scale of 0–7based on their power density, and more than 66% of offshore wind in the United States is in wind power class six or seven.
Developers have proposed building nearly 4.9 GW of offshore wind capacity off the coasts of nine different states mostly along the northeast coast. But some challenges remain even for projects that have progressed through key regulatory and market milestones.
The US Department of Energy supported demo projects—the Virginia Offshore Wind Technology Advancement (VOWTAP [16]) Project, Fisherman’s Energy Wind [17] of New Jersey and WindFloat of Oregon—face development hurdles despite making significant progress in project development.
Each of these projects received US$ 4×10⁶ (€3.5 million) in design and planning support. Eventually these three projects were to get as much as US$ 47×106 (€41 million) each to help fund construction. The goal was to have the projects up and running in 2017, but both Fishermen’s Energy and WindFloat (semisubmersible)—are facing serious challenges [18].
Fishermen’s Energy’s proposal has a two-phase approach, the first phase a 25 MW project in New Jersey State Waters followed by a 330 MW utility scale project in Federal Waters, for the second phase.
In March 2016 the New Jersey legislature passed a second bill [19] that requires the Board of Utilities to re-open an application window for a 20–25 MW offshore wind project in state waters, a move aimed at providing Fishermen’s Energy a final chance to win regulatory approval. The NJ Board of Utilities (BU) has twice rejected Fishermen’s fully permitted 24 MW, US$ 220×106 (€194 million) project on grounds that it fails to provide the state with sufficient economic and environmental benefits to qualify for Offshore Renewable Energy Certificates [20] (ORECs).
Further the BU disagreed with the developer’s proposed OREC price of US$ 199.17 (MW h)−1, as this was contingent on Fishermen’s Energy receiving about US$ 100×106 (100 million dollars) in federal subsidies that it did not have fully in hand last year [21]. In a renewed effort to address these concerns, the project developer switched from XEMC to Siemens turbines, while pledging to utilize traditional project financing along with proven technology [22].
On the other end the US Department of Interior’s Bureau of Ocean Energy Management (BOEM) is in charge of the permitting process for offshore projects including planning, leasing, site assessment, construction and operations. It has executed individual lease sales in a number of states including Rhode Island and Massachusetts (2013), Virginia (2013), Maryland (2014), Massachusetts (2015), and New Jersey (2016) [23].
United States will see its first commercial offshore project come online in 2016. The path forward will be challenging, and will be linked to the outcome of the upcoming Presidential election results as well. The level of federal support for offshore wind could come under a scanner in case a Republican President is elected come November.
26.2.8.2 India Sets the Ball Rolling
The Indian Ministry of New and Renewable Energy (MNRE) has initiated discussions on promoting a demonstration project in India. In October 2015, it announced India’s Offshore Wind Policy. The National Institute for Wind Energy (NIWE) is the nodal agency for implementing the policy and creating the necessary ecosystem for the sector.
Facilitating Offshore Wind in India [24] (FOWIND) is a European Union supported 4-year project. A GWEC led consortium is implementing this project in Gujarat and Tamil Nadu. NIWE is the knowledge partner for the project in India. FOWIND will undertake the first offshore wind resource measurement in the Gulf of Khambat, off the coast of Gujarat in 2016. FOWIND works in close consultation with the MNRE and state government agencies to establish a roadmap for offshore wind power development in India.
The Offshore Wind Policy outlines an international competitive bidding mechanism for the sector. The first tender is likely to be announced in late 2018.
26.3 The Future: Market Forecast (On- and Offshore) to 2020
Looking ahead GWEC anticipates a period of steady growth, although not expecting the kind of spectacular growth we have seen in the last two years. Asia will continue to dominate the period from 2016–20, capturing at least 50% of the global market, although its dominance may be tempered slightly toward the end of the decade. Europe will continue its steady pace towards its 2020 targets, although increasing policy uncertainty might mean some bumps in the road. With Mexico, Canada and the United States all on a strong policy footing, North America should continue its strong growth for the rest of the decade. See Fig. 26.5.

Latin America will continue to be driven largely by Brazil, although there will be increasing contributions from a variety of markets, including a large new potential market in Argentina. Africa and the Middle East continue to diversify, although in the short term it will be dominated by South Africa, Egypt, and Morocco, with Kenya and Ethiopia coming on strong. The Pacific region will return to substantial growth with a period of policy stability in Australia.
China surpassed the EU in cumulative installations in 2015, and will continue to drive Asian growth. Despite FIT cuts for wind as of this year and again in 2018, the new 5-Year Plan has upped the target for China’s wind sector for 2020 once again, this time to 250 GW, which the market is likely to in fact exceed. Also the “take-off” of the Chinese offshore sector is likely to happen, with about 1 GW of projects in the construction phase, adding a new dimension to the world’s largest market.
Despite the Indian government’s commitment to renewables’ development, the wind industry only experienced modest growth in 2015, and it is not yet clear how fast the industry can grow given infrastructure limitations and the overall parlous state of the electricity industry’s finances. The government is working hard to overcome these, however, and modest growth is expected in India throughout 2020. Elsewhere in Asia, while not too much is expected from South Korea and Japan in the short term, but new markets will emerge every year, and the signing of PPAs in Indonesia are hopefully the beginnings of a large new potential market. Pakistan, Philippines, and Mongolia continue to grow, and hopefully Vietnam can begin to exploit its excellent wind resources before the end of the decade. Overall the Asian market is likely to roughly double between now and 2020, adding 177 GW over the period.
In Europe Germany posted extraordinary numbers in 2015, bolstered by more than 2 GW of offshore installations, which is not likely to be repeated in the near future. Poland was Europe’s number two market last year, at least partly due to a rush to install prior to the change in the support scheme, and the United Kingdom is facing a period of policy instability which may, ironically, lead to stronger installations in the short term but does not bode well for the medium term. Turkey’s market remains strong and is looking to grow significantly in 2016, and some southern European markets are recovering from the aftereffects of the financial crisis. However, it seems likely that there will be a small downturn in 2016, with later recovery at least in part dependent upon the outcome of EU-wide deliberations on post-2020 targets and support schemes.
The United States could grow spectacularly, far above current predictions depending on a number of political and economic factors. Regardless a strong and increasingly stable market in the United States is expected over the next 5 years.
The big picture view of the Canadian market has also improved of late, with the recent election of a Liberal government in Ottawa led by Justin Trudeau, which is determined to resume Canada’s leadership role in the international climate debate. Coupled with a very progressive provincial government in Alberta and increasing market diversity across the country, the world’s seventh largest market (sixth in terms of annual market in 2015) looks set for a period of solid growth. Mexico’s newly reformed market is just getting underway, so it is too soon to say whether it will reach its target of 2 GW year−1 any time soon, but early results are encouraging. Overall the North American market is likely to add about 60 GW over the next 5years.
Despite Brazil’s political and economic woes, the wind sector continues to power ahead with another 10 GW already contracted by 2019, and two auctions scheduled for 2016. Elsewhere in the region Chile and Uruguay will add capacity in 2016, although Uruguay is likely to pause there for a while. Peru’s recent successful and very low-priced tender results could mean that market is going to move in earnest, and there are some stirrings in Colombia.
But the big new story in Latin America is Argentina, with the advent of a new government and a new commitment to utilizing the country’s vast renewable energy sources, sorting out the electricity sector’s finances and re-establishing itself as a leader in the international climate debate. We could have a major new South American market relatively soon. Much could go wrong, of course, but the current government is working hard to put things in place as soon as possible. 30 GW of new wind power is expected across the region by 2020.
Jordan inaugurated its first wind farm in 2015, underlining the diversification of the uptake of wind power across the region, albeit most of them are small markets, at least for now. South Africa, despite Eskom’s financial woes, which prevented the round four projects from reaching financial close in 2015, will continue to be the largest market in the region. Morocco will see a number of projects come online over the next 5 years, mostly from the famous tender won by the consortium of EGP, Nareva, and Siemens early this year. Egypt is still a sleeping giant, waiting for the pieces to fall into place with their new support systems, but they still maintain very aggressive targets for 2022.
Ethiopia is rapidly taking steps to allow independent power producers (IPPs) to take advantage of their tremendous wind resources, which augurs well for that market, and Kenya’s Lake Turkana project finally started construction during 2015. Elsewhere in the region a number of smaller projects are at various stages of development, and we are very optimistic about the spread of wind power across Africa to meet the development needs of its growing economies, which will result in about 16 GW of new installations out to 2020.
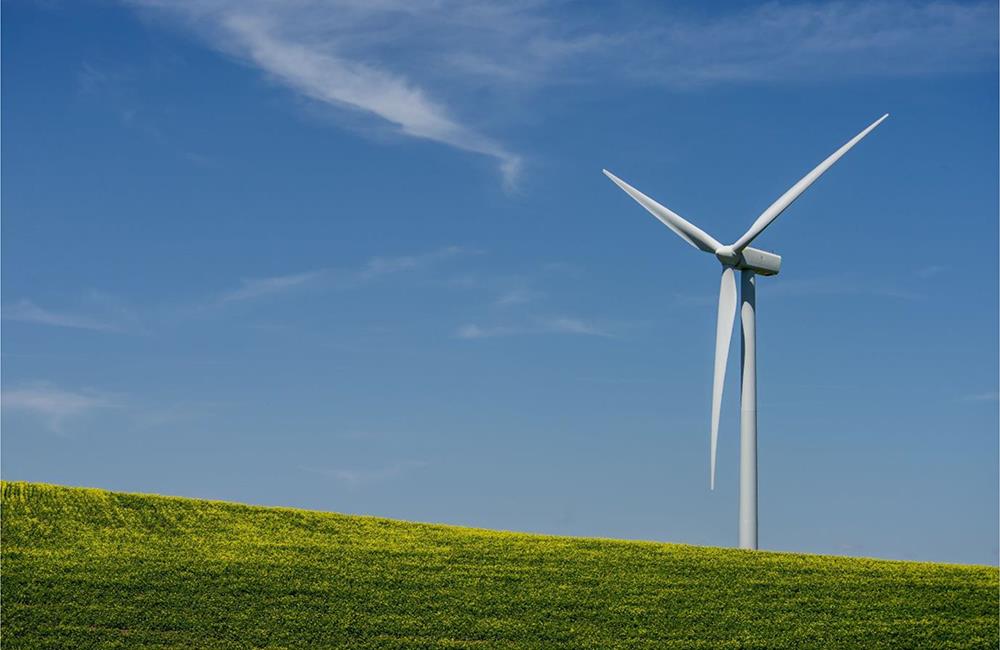
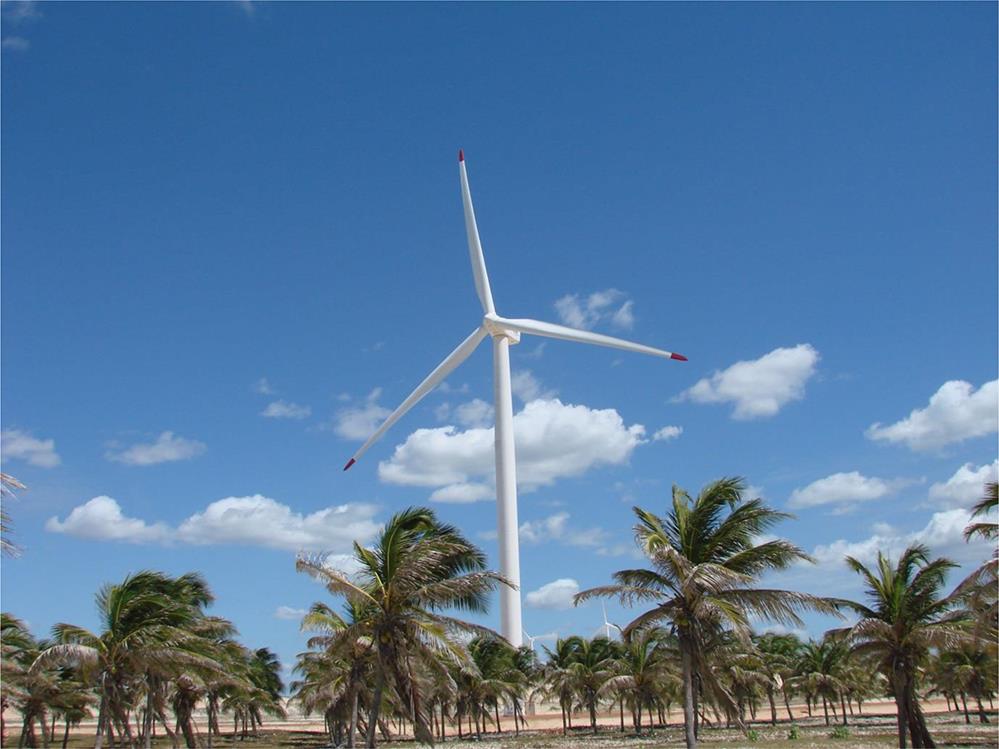
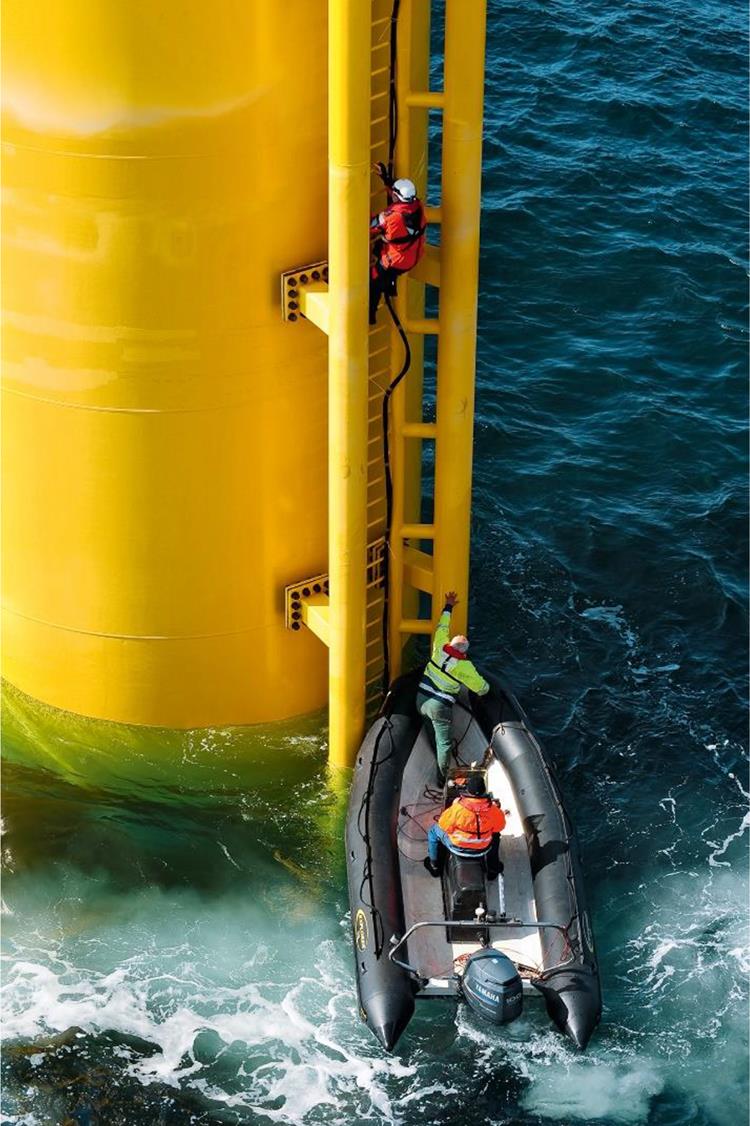
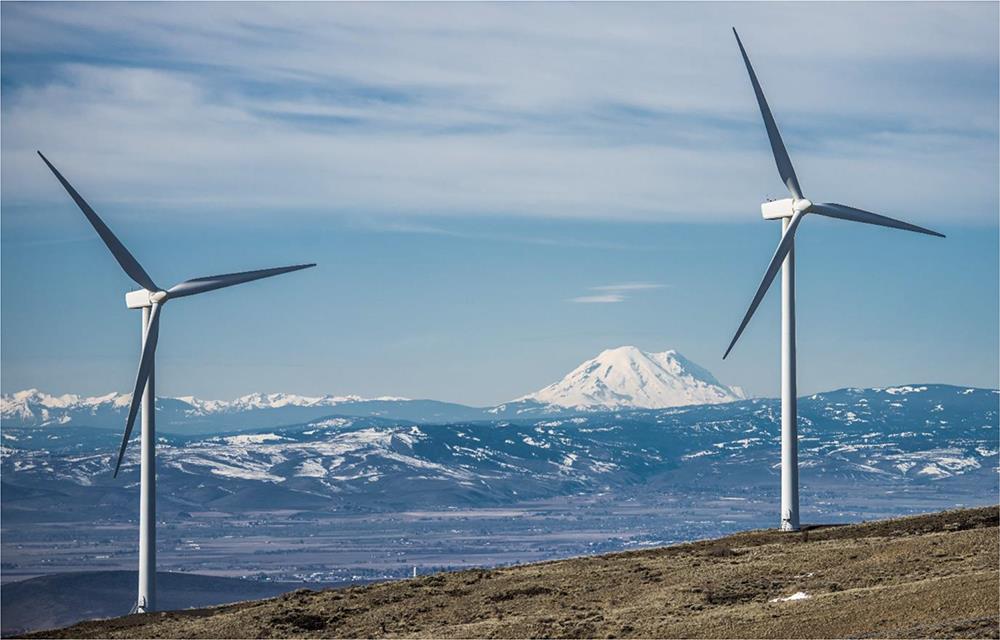
After a relatively quiet year in the main market in the Pacific, Australia seems poised for another round of growth based on the clarification of the Renewable Energy Target, bringing some visibility to the market out to the end of the decade. Australia’s new Prime Minister has shown a more positive attitude toward renewables than his predecessor, and the market for wind in Australia is expected to nearly double over the next 5 years. This combined with some activity in the Islands and New Zealand, leads us to anticipate that about 4.5 GW will be added in the region in the period from 2016–20. Figs 26.6–26.11 of wind turbines around the world.