
Chapter 3: Understanding Analytics
In This Chapter
![]() Understanding how analytics can tell you about your blog
Understanding how analytics can tell you about your blog
![]() Choosing an analytics-tracking option
Choosing an analytics-tracking option
![]() Deciphering analytics terminology
Deciphering analytics terminology
![]() Working with Google Analytics
Working with Google Analytics
Every business on the face of the Earth needs to figure out what works and what doesn’t if it wants to succeed. Bloggers often know basic statistics about their blogs, such as the current number on their hit counters or how many people subscribe to their blogs. These stats may give you the big picture, but they don’t really address why something is or isn’t working.
You need to get at least a basic understanding of analytics if you want to make the most of your blog. The data provided by free programs such as Google Analytics can really help you grow as a blogger. In this chapter, you discover how to incorporate various data-measuring tools into your WordPress installation, deciphering what the data is telling you, and determining how to act on it.
Google Analytics provides you with a tremendous amount of information on your content. The goal of this chapter is to help you interpret the data, understand where your traffic is coming from, understand which of your content is the most popular among your visitors, know how to draw correlations between various data sets, and use this information to shape the content you write. This process may sound very geeky and accountant-like, but in reality, it gives you a roadmap that helps you improve your business.
Understanding the Importance of Analytics
Personally, I avoid math like my 7-year-old nephew avoids vegetables. Most people’s eyes glaze over when they hear the word analytics followed by stats, any type of percentages, and anything that sounds like accountant-speak.
However, you should view analytics not as a bunch of numbers but as a tool set that tells a story. It can tell you how people are finding your content, what content is most popular, and where users are sharing that content. Knowing what type of content is popular, where your site is popular (in which time zones, countries, and states, for example), and even what time of day your posts get more readers is all valuable information. Understanding your audience’s interest in your content, as well as preferences for when and how to read your content, is important.
At one point in my life, I had a pretty popular political blog. Through studying analytics and reactions to my content, I figured out that if I posted my blog between 9:30 a.m. and 10:00 a.m. EST, my posts garnered the most comments and got the most traffic throughout the day. When I posted after noon, my blog got about half as many comments and half as much traffic over a 24-hour period. Additionally, I saw that my site was getting shared and voted for on the social news site Reddit (www.reddit.com) more often than on Digg (www.digg.com), another social news site, so I replaced the Digg button with a Reddit button. This change increased the amount of traffic I received from Reddit because people had the visual reminder to share the post with their friends and vote for the post as a favorite of theirs.
I was able to continue to drill down from there. Not only did I have the information on where my content was being shared, but I was also able to garner more information for analytics. Posts that had a picture mixed in with the first three paragraphs often had a lower bounce rate (the interval of time it takes for a visitor to visit a site and then bounce away to a different site) than posts that had no picture at all. If I wrote the post while elevating my left leg and wearing a tinfoil helmet, I saw a 25 percent bump in traffic. (Okay, maybe that last one isn’t true.)
Exploring the Options to Track Data
You have a lot of options when it comes to tracking data on your blog. Google Analytics is the most popular tool, but several different options are available. Analytics is popular because of its widespread use, the amount of content written on how to maximize it, and the fact that it is completely free.
Here are three popular tools:
![]() StatCounter (
StatCounter (www.statcounter.com): StatCounter has both a free and a paid service. The paid service doesn't kick in until you get to 250K page views a month.
StatCounter (shown in Figure 3-1) uses the log generated by your server and gives you the ability to configure the reports to fit your needs. If you want to use a log file, you need to have a self-hosted blog and to know where your log file is stored. StatCounter requires a little more technical knowledge than your average analytics app because you have to deal with your log file instead of cutting and pasting a line of code into your site. The main advantage of StatCounter is that it is in real time, whereas Google Analytics always has a little bit of lag in its reporting.
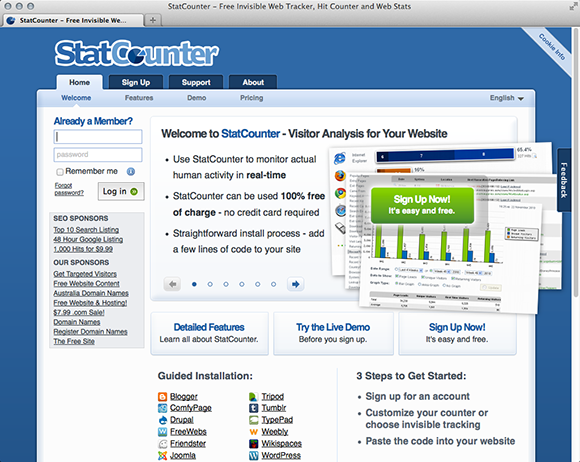
Figure 3-1: StatCounter offers real-time stats.
![]() Jetpack (
Jetpack (http://wordpress.org/extend/plugins/jetpack): The Jetpack plugin provides a pretty good stat package for its hosted-blog users. Shortly after launching, WordPress.com provided a WordPress Stats plugin that self-hosted users can use. (See Figure 3-2.) If you use this package, your stats appear on the WordPress Dashboard, but to drill down deeper into them, you need to access the stats on WordPress.com. The advantages of WordPress stats are that they are pretty easy to install and present a very simplified overview of your data. On the downside, they don't drill as deep as Google Analytics and the reporting isn't as in-depth. Nor can you customize reports.
![]() Google Analytics (
Google Analytics (www.google.com/analytics): Google Analytics can seem overwhelming when you sit in front of it for the first time, but it has the most robust stats features this side of Omniture. (Omniture is an enterprise-level stats package, which is overkill if you're a personal or small-business blogger.) Also, because Google has opened the analytics platform to developers, some pretty cool innovations for bloggers and social media people are on the way. This recent development gives you reason enough to try the platform.
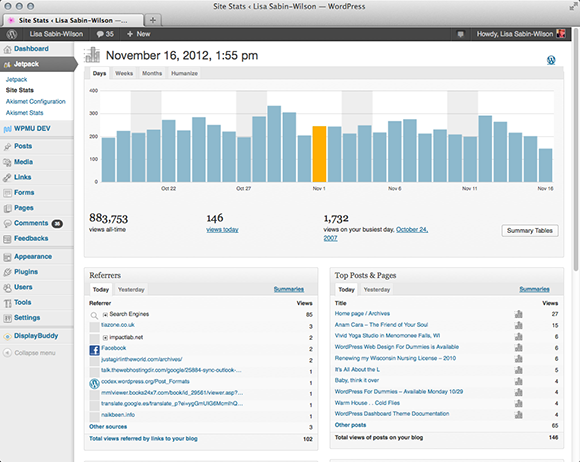
Figure 3-2: Try the Jetpack plugin.
WordPress plugins (covered in the section “Signing Up and Installing Google Analytics on Your WordPress Site,” later in this chapter) bring a simplified version of Google Analytics (see Figure 3-3) to your WordPress Dashboard (much like the WordPress.com Stats plugin). If you feel overwhelmed by Google Analytics and prefer to have your stats broken down in a much more digestible fashion, this plugin is for you: It allows for a good overview of analytics information, including goals that you can set up. Although the plugin doesn’t offer everything that Google Analytics brings to the table, it provides more than enough so that you can see the overall health of your website and monitor where your traffic is coming from, what posts are popular, and how people are finding your website. Besides the Dashboard Stats Overview, this plugin gives a breakdown of traffic to each post, which is a nice added bonus.
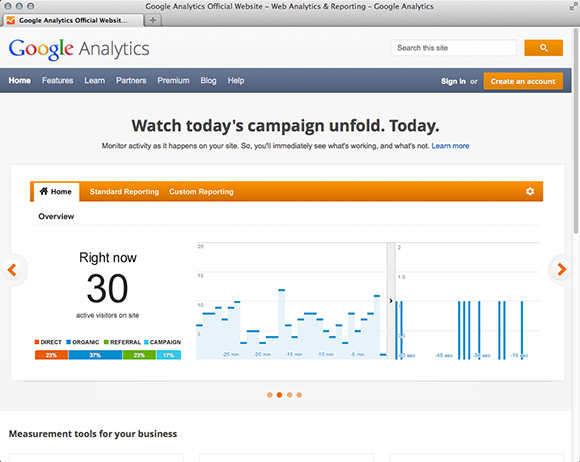
Figure 3-3: Google Analytics is a powerful tool.
Understanding Key Analytics Terminology
One of the reasons that people find analytics programs so overwhelming is their obscure terminology and jargon. Here, I’ve taken the time to define some of the more popular terms (I even spent the time putting them in alphabetical order for you; you can thank me later):
![]() Bounce rate: The percentage of single-page visits or visits in which the person leaves your site from the entrance page. This metric measures visit quality — a high bounce rate generally indicates that visitors don’t find your site entrance pages relevant to them.
Bounce rate: The percentage of single-page visits or visits in which the person leaves your site from the entrance page. This metric measures visit quality — a high bounce rate generally indicates that visitors don’t find your site entrance pages relevant to them.
The more compelling your landing pages, the more visitors stay on your site and convert into purchasers, subscribers, or whatever action you want them to complete. You can minimize bounce rates by tailoring landing pages to each ad that you run (in the case of businesses) or to the audience based on the referring site (for example, if you create a special bio page for your Twitter profile). Landing pages should provide the information and services that the ad promises.
When it comes to blogging, a high bounce rate from a social media source (such as a social news site like Digg) can tell you that users didn’t find the content interesting, and a high bounce rate from search engines can mean that your site isn’t what users thought they were getting. In blogging, having a low bounce rate really speaks to the quality of the content on your site. If you get a lot of search and social media traffic, a bounce rate below 50 percent is a number you want to strive for.
![]() Content: The different pages within the site. (The Content menu of Google Analytics breaks down these pages so that they have their own statistics.)
Content: The different pages within the site. (The Content menu of Google Analytics breaks down these pages so that they have their own statistics.)
![]() Dashboard: The interface with the overall summary of your analytics data. It’s the first page you see when you log in to Google Analytics.
Dashboard: The interface with the overall summary of your analytics data. It’s the first page you see when you log in to Google Analytics.
![]() Direct traffic: When web visitors reach your site by typing your web address directly into their browsers’ address bars. (Launching a site by clicking a bookmark also falls into this category.) You can get direct-traffic visitors because of an offline promotion, repeat readers, word of mouth, or simply from your business card.
Direct traffic: When web visitors reach your site by typing your web address directly into their browsers’ address bars. (Launching a site by clicking a bookmark also falls into this category.) You can get direct-traffic visitors because of an offline promotion, repeat readers, word of mouth, or simply from your business card.
![]() First-time unique visitor: This metric tracks the number of visitors to your website who haven’t visited prior to the time frame you’re analyzing.
First-time unique visitor: This metric tracks the number of visitors to your website who haven’t visited prior to the time frame you’re analyzing.
![]() Hit: Any request to the web server for any type of file, not just a post in your blog, including a page, an image (JPEG, GIF, PNG, and so on), a sound clip, or any of several other file types. An HTML page can account for several hits: the page itself, each image on the page, and any embedded sound or video clips. Therefore, the number of hits a website receives doesn’t give you a valid popularity gauge, but rather it indicates server use and how many files have been loaded.
Hit: Any request to the web server for any type of file, not just a post in your blog, including a page, an image (JPEG, GIF, PNG, and so on), a sound clip, or any of several other file types. An HTML page can account for several hits: the page itself, each image on the page, and any embedded sound or video clips. Therefore, the number of hits a website receives doesn’t give you a valid popularity gauge, but rather it indicates server use and how many files have been loaded.
![]() Keyword: A database index entry that identifies a specific record or document. (That definition sounds way more fancy than a keyword actually is.) Keyword searching is the most common form of text search on the web. Most search engines do their text query and retrieval by using keywords. Unless the author of the web document specifies the keywords for his or her document (which you can do by using meta tags), the search engine has to determine them. (So you can’t guarantee how Google indexes the page.) Essentially, search engines pull out and index words that it determines are significant. A search engine is more likely to deem words important if those words appear toward the beginning of a document and are repeated several times throughout the document.
Keyword: A database index entry that identifies a specific record or document. (That definition sounds way more fancy than a keyword actually is.) Keyword searching is the most common form of text search on the web. Most search engines do their text query and retrieval by using keywords. Unless the author of the web document specifies the keywords for his or her document (which you can do by using meta tags), the search engine has to determine them. (So you can’t guarantee how Google indexes the page.) Essentially, search engines pull out and index words that it determines are significant. A search engine is more likely to deem words important if those words appear toward the beginning of a document and are repeated several times throughout the document.
![]() Meta tag: A special HTML tag that provides information about a web page. Unlike normal HTML tags, meta tags don't affect how the page appears in a user's browser. Instead, meta tags provide information such as who created the page, how often it's updated, a title for the page, a description of the page's content, and what keywords represent the page's content. Many search engines use this information when they build their indexes, although most major search engines rarely index the
Meta tag: A special HTML tag that provides information about a web page. Unlike normal HTML tags, meta tags don't affect how the page appears in a user's browser. Instead, meta tags provide information such as who created the page, how often it's updated, a title for the page, a description of the page's content, and what keywords represent the page's content. Many search engines use this information when they build their indexes, although most major search engines rarely index the keywords meta tag anymore because it has been abused by people trying to fool search results.
![]() Pageview: A page is defined as any file or content delivered by a web server that would generally be considered a web document, which includes HTML pages (
Pageview: A page is defined as any file or content delivered by a web server that would generally be considered a web document, which includes HTML pages (.html, .htm, .shtml), posts or pages within a WordPress installation, script-generated pages (.cgi, .asp, .cfm), and plain-text pages. It also includes sound files (.wav, .aiff, and so on), video files (.mov, .mpeg, and so on), and other nondocument files. Only image files (.jpeg, .gif, .png), JavaScript (.js), and Cascading Style Sheets (.css) are excluded from this definition. Each time a file defined as a page is served or viewed in a visitor's web browser, a pageview is registered by Google Analytics. The pageview statistic is more important and accurate than a hit statistic because it doesn't include images or other items that may register hits to your site.
![]() Path: A series of clicks that result in distinct pageviews. A path can’t contain non-pages, such as image files.
Path: A series of clicks that result in distinct pageviews. A path can’t contain non-pages, such as image files.
![]() Referrals: A referral occurs when a user clicks any hyperlink that takes him or her to a page or file in another website; it could be text, an image, or any other type of link. When a user arrives at your site from another site, the server records the referral information in the hit log for every file requested by that user. If the user found the link by using a search engine, the server records the search engine’s name and any keywords used, as well. Referrals give you an indication of what social-media site, as well as links from other websites and blogs, are directing traffic to your blog.
Referrals: A referral occurs when a user clicks any hyperlink that takes him or her to a page or file in another website; it could be text, an image, or any other type of link. When a user arrives at your site from another site, the server records the referral information in the hit log for every file requested by that user. If the user found the link by using a search engine, the server records the search engine’s name and any keywords used, as well. Referrals give you an indication of what social-media site, as well as links from other websites and blogs, are directing traffic to your blog.
![]() Referrer: The URL of an HTML page that refers visitors to a site.
Referrer: The URL of an HTML page that refers visitors to a site.
![]() Traffic sources: This metric tells you how visitors found your website — via direct traffic, referring sites, or search engines.
Traffic sources: This metric tells you how visitors found your website — via direct traffic, referring sites, or search engines.
![]() Unique visitors: The number of unduplicated (counted only once) visitors to your website over the course of a specified time period. The server determines a unique visitor by using cookies, small tracking files stored in your visitors’ browsers that keep track of the number of times they visit your site.
Unique visitors: The number of unduplicated (counted only once) visitors to your website over the course of a specified time period. The server determines a unique visitor by using cookies, small tracking files stored in your visitors’ browsers that keep track of the number of times they visit your site.
![]() Visitor: A stat designed to come as close as possible to defining the number of distinct people who visit a website. The website, of course, can’t really determine whether any one “visitor” is really two people sharing a computer, but a good visitor-tracking system can come close to the actual number. The most accurate visitor-tracking systems generally employ cookies to maintain tallies of distinct visitors.
Visitor: A stat designed to come as close as possible to defining the number of distinct people who visit a website. The website, of course, can’t really determine whether any one “visitor” is really two people sharing a computer, but a good visitor-tracking system can come close to the actual number. The most accurate visitor-tracking systems generally employ cookies to maintain tallies of distinct visitors.
Signing Up and Installing Google Analytics on Your WordPress Site
In the following sections, you sign up for Google Analytics, install it on your blog, and add the WordPress plugin to your site.
Signing up for Google Analytics
To sign up for Google Analytics, follow these steps:
1. Go to: www.google.com/analytics and click the Create an Account button, which is located on the top-right side of the page.
A page where you can sign up for a Google account or sign in via an existing Google account appears. If you don’t have a Google account, follow the link to sign up for one.
2. Sign in via your Google account by entering your e-mail address and password in the text boxes and then clicking Sign In.
The first of a series of walk-through pages appears.
3. Click the Sign Up button.
4. On the What Would You Like to Track? page that appears (see Figure 3-4), fill in this information:
• The URL of your website
• The name you want to call your account (this really doesn’t matter; you can call it your website’s name)
• The country and time zone you’re in
5. Click the Get Tracking ID button.
The All Web Site Data page appears. (See Figure 3-5.)
At the bottom of the page, Google Analytics provides you with your Google tracking code, as shown in Figure 3-6.
6. Copy the tracking code by selecting it and pressing Ctrl+C.
7. Paste the Google tracking code into your WordPress blog.
If you’re not sure how to complete this step, see the following section.
8. Click the Save and Finish button.

Figure 3-4: Entering a URL in Google Analytics.
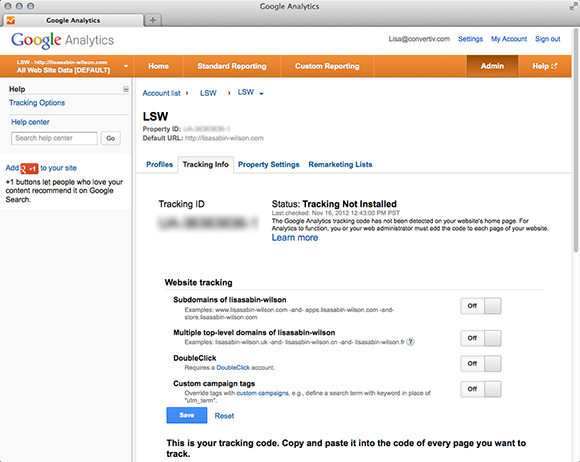
Figure 3-5: The All Web Site Data page.
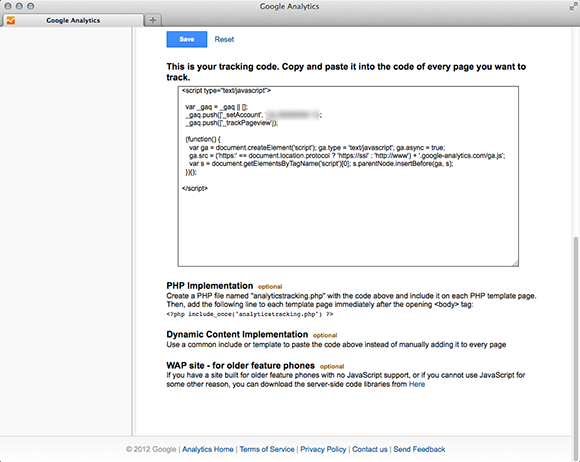
Figure 3-6: Get your Google Analytics code.
Installing the tracking code
After you set up your Google Analytics account and obtain the code to install in your WordPress site, you’re ready for the installation. You can install Google Analytics by following these steps:
1. Go to your WordPress Dashboard and log in.
If you have a theme framework, such as Genesis or Thesis, you can paste the code in the theme's Options page, or if you're using one of the many Google for WordPress plugins, you can paste the code in the Plugin Options page. However, the simplest place you can paste the code is directly into your footer (the footer.php template file within your theme) because this location works for pretty much all WordPress-designed sites.
2. Click the Appearance menu on the Dashboard and then click the Editor link.
The Edit Themes page loads in your browser window.
3. From the Templates menu on the right side of the Edit Themes page, click Footer (footer.php).
This shows you the coding for the footer in the text box on the left side.
4. Paste the Google Tracking code in the Footer Template file.
Paste the code that you copied by pressing Ctrl+V. Be sure to paste the code before the closing body tag (</body>).
 You have to put this code before the closing body tag, not after. If you put it after the close body tag, the code doesn’t function.
5. Click Update File.
Figure 3-7 shows the Footer template from the Twenty Twelve theme with the Google Analytics code (from Figure 3-6) inserted above the closing </body> tag.
Verifying that you installed the code properly
After you install your code, check whether you installed it correctly. When you log back in to Google Analytics, your Dashboard appears. (See Figure 3-8.) The Dashboard shows the tracking data obtained from your website so far. Because your account is new, your tracking data will likely be a big fat zero, much like what you see in Figure 3-8.
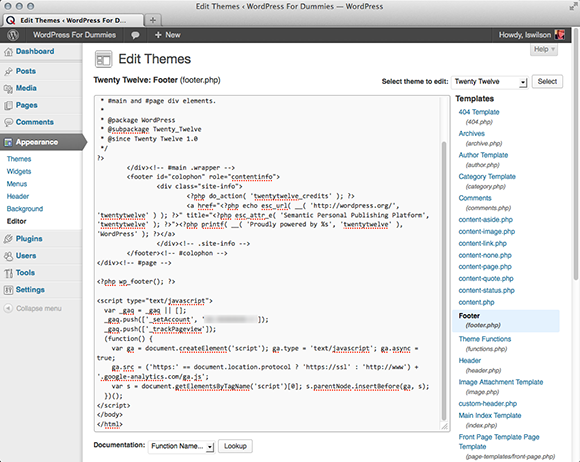
Figure 3-7: Footer template with tracking code.
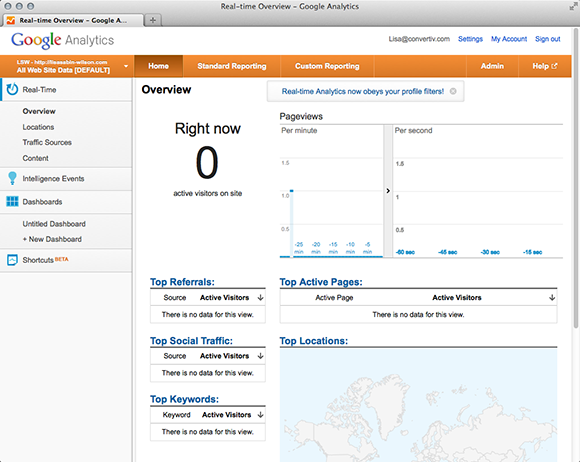
Figure 3-8: Tracking code in place and collecting data.
Installing and configuring the Analytics plugin
After you install Google Analytics on your WordPress site and make sure that the tracking code is working properly, you can install the plugin so that you can get a basic version of your stats right on your WordPress Dashboard. Just follow these steps:
1. Log in to your WordPress Dashboard.
2. On the Plugins menu, click the Add New link.
A search box appears so you can search for the plugin.
3. In the Search text box, type google analytics dashboard and click the Install Now link.
This takes you to the Installing Plugin page.
4. Activate the plugin by clicking the Activate Plugin link on the Installing Plugin page.
5. Click the Google Analytics Dashboard link on the Settings menu.
You can click the Start the Login process in the Login using the Google OAuth system, which automatically authorizes the plugin to access your Google Analytics account; alternatively, you can type your Google Analytics e-mail and password in the older authentication system section.
6. Enter your information and click Save Options to log in.
A configuration page appears. (See Figure 3-9.)
7. From the Available Accounts drop-down list, select the analytics account from which you want to pull your stats.
8. (Optional) Select the check boxes to remove your password and authentication information from Google.
You select these check boxes if you want to deactivate the plugin. If you only select to forget password or forget authentication, you will have to log back in to the menu like in Step 6.
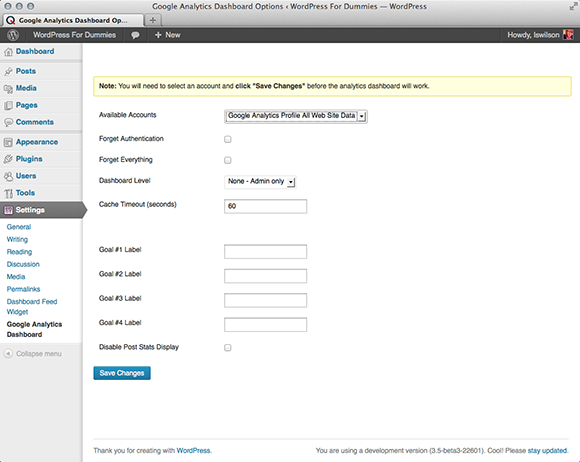
Figure 3-9: The Google Analytics configura-tion page.
9. Specify the level (or role, such as Administrator, Contributor, and so on) of WordPress users who can see the stats by selecting an option from the Dashboard Level drop-down list.
This is good if your blog has multiple authors.
10. Label your goals within analytics by entering the titles of your goals in the text boxes.
Goal labels can help people who are tracking specific metrics, such as sales, sign-ups, or other actions, to see whether people are converting.
11. Click the Save Changes button.
The plugin appears on your Dashboard.
12. Drag and drop the plugin to the position you prefer.
Figure 3-10 shows a WordPress Dashboard with the Google Analytics plugin.
Using the data from the plugin
After you install Google Analytics on your WordPress Dashboard, you can examine the data it provides. Your Dashboard displays two basic groups of stats:
![]() A general overview: The stats here include the amount of visits, pageviews, pageviews per visit, bounce rate, average time on site, and the percent of new visits. This information gives you a good overview of the base stats of your blog.
A general overview: The stats here include the amount of visits, pageviews, pageviews per visit, bounce rate, average time on site, and the percent of new visits. This information gives you a good overview of the base stats of your blog.
![]() An extended stats section: Stats here include the most popular post over the last 30 days, the top searches that found your site, and the top referrers. These stats show you the most popular content on your site, the ways people are finding your site, and the sources of your traffic. If you want get even more detailed information, go to the Posts section on WordPress (see Figure 3-11), where you can find per-page stats for each of your posts and pages. Each breakdown has a chart, number of pageviews, number of exits, and the number of unique pageviews.
An extended stats section: Stats here include the most popular post over the last 30 days, the top searches that found your site, and the top referrers. These stats show you the most popular content on your site, the ways people are finding your site, and the sources of your traffic. If you want get even more detailed information, go to the Posts section on WordPress (see Figure 3-11), where you can find per-page stats for each of your posts and pages. Each breakdown has a chart, number of pageviews, number of exits, and the number of unique pageviews.
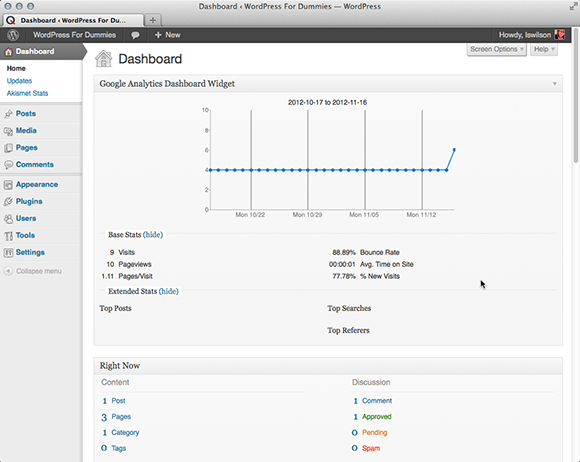
Figure 3-10: Google Analytics on your WordPress Dashboard.
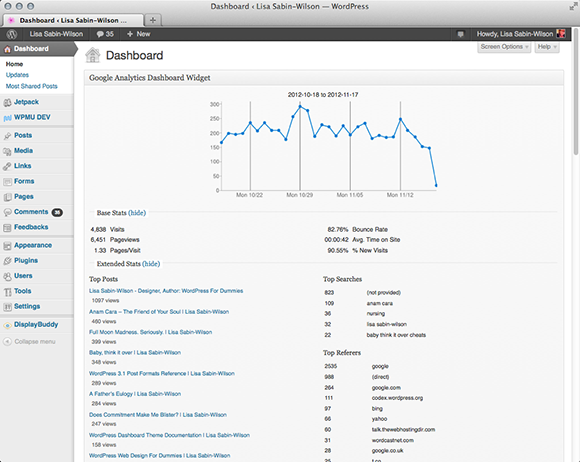
Figure 3-11: A per-post breakdown by Google Analytics for WordPress.
By examining the two data sets, you can get a handle on the traffic that’s coming to your blog. Pay attention to the following questions:
![]() What posts are popular?
What posts are popular?
![]() Do the popular posts have a unique theme or type?
Do the popular posts have a unique theme or type?
![]() Do long posts or short posts help increase traffic?
Do long posts or short posts help increase traffic?
![]() Do videos, lists, or any other type of specific posts give you more traffic than the rest?
Do videos, lists, or any other type of specific posts give you more traffic than the rest?
The answers to these questions can help you draw various conclusions and adapt your publishing schedule, content type, and writing style to optimize the popularity of your blog.