Day 15. Troubleshooting Methodology
CCNA 200-101 ICND2 Exam Topics
![]() Identify and correct common network problems
Identify and correct common network problems
Key Topics
Several upcoming days focus on troubleshooting. The review today covers general troubleshooting methodologies that can help you to efficiently track down and resolve most issues.
Troubleshooting Documentation
For network administrators to monitor and troubleshoot a network, they must have a complete set of accurate and current network documentation. This documentation includes the following:
![]() Configuration files, including network configuration files and end-system configuration files
Configuration files, including network configuration files and end-system configuration files
![]() Physical and logical topology diagrams
Physical and logical topology diagrams
![]() A baseline performance level
A baseline performance level
Configuration Files
The network configuration files should include detailed information for each network device, such as the following:
![]() Type of device, model designation
Type of device, model designation
![]() IOS image name
IOS image name
![]() Device network hostname
Device network hostname
![]() Location of the device (building, floor, room, rack, panel)
Location of the device (building, floor, room, rack, panel)
![]() All module types and in which module slot they are located (if a modular device)
All module types and in which module slot they are located (if a modular device)
![]() Data-link layer addresses
Data-link layer addresses
![]() Network layer addresses
Network layer addresses
![]() Any additional important information about physical aspects of the device
Any additional important information about physical aspects of the device
The following information could be documented within the end-system configuration files:
![]() Device name (purpose)
Device name (purpose)
![]() Operating system and version
Operating system and version
![]() IPv4 and IPv6 addresses
IPv4 and IPv6 addresses
![]() Subnet mask and prefix length
Subnet mask and prefix length
![]() Default gateway, DNS server, and WINS server addresses
Default gateway, DNS server, and WINS server addresses
![]() Any high-bandwidth network applications that the end system runs
Any high-bandwidth network applications that the end system runs
Topology Diagrams
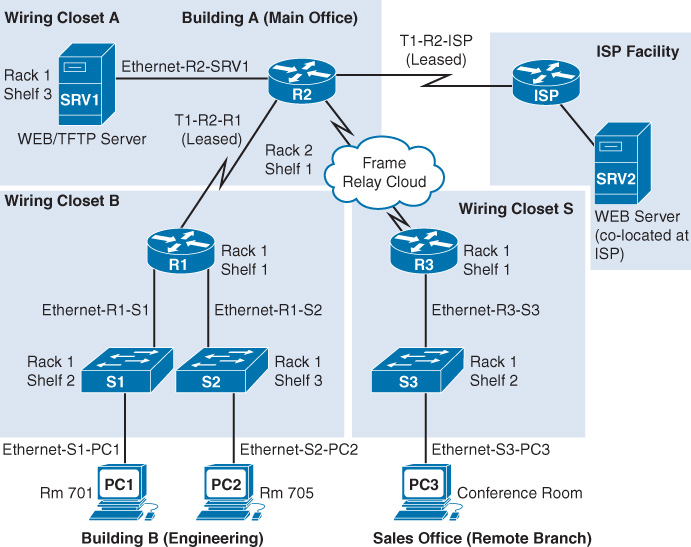
Physical topologies typically include information most vital to helping network technicians locate and resolve issues. Figure 15-1 shows a simplified example of the type of information you might find on a physical topology.
Note
A physical topology for an existing network will most likely be much more complex than the example shown here.
The physical and logical topology might be combined into one network topology. However, doing so might cause the documentation to become very complex and noisy with data. Therefore, organizations often have a separate logical topology like the example shown in Figure 15-2.

Baseline Date
The initial network performance baseline sets the stage for measuring the effects of network changes and subsequent troubleshooting efforts. Establishing this baseline requires three broad steps:
Step 1 Determine what types of data to collect.
Step 2 Identify devices and ports of interest.
Step 3 Determine the baseline duration.
You can manually collect much of the data using many of the show commands that you have learned through your studies (show ip route, show ip interface brief, show running-config, and so on). However, establishing an initial baseline or conducting a performance-monitoring analysis may require many hours or days to accurately reflect network performance. Network management software or protocol inspectors and sniffers often run continuously over the course of the data collection process.
Troubleshooting Methods
Regardless of the method you use, troubleshooting any network problem involves three major stages, as shown in Figure 15-3.
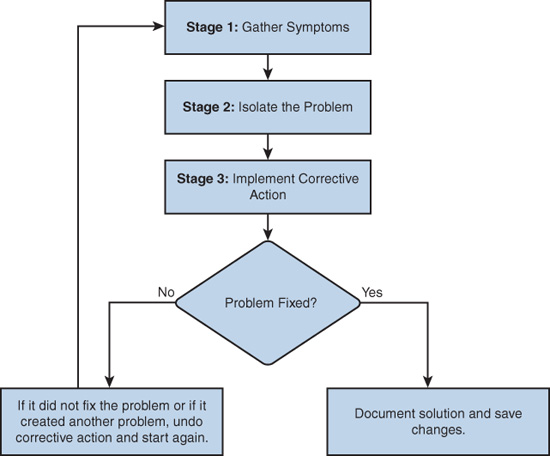
During the first stage, symptoms can appear in many different forms, including alerts from network management systems, console messages, and help desk tickets. The information gathered from these symptoms ultimately directs the network administrator’s attention to an area of the network—a single device, a group of devices, or an entire subnet of devices.
During the second stage, the network administrator isolates the problem by using tools that will most likely generate the data necessary to recommend a course of action for the next stage.
Finally, in the third stage, the network administrator implements the most likely solution and then tests it. If the original problem is resolved, the solution is documented and saved. If the problem is not resolved, the network administrator removes the solution imple-mented and returns to the first stage (gathering symptoms).
One systematic way to implement the troubleshooting process is to use the OSI model and one of the following three methods:
![]() Bottom-up: Start at the physical layer and check all the physical components. Because many issues are Layer 1 related, this method often proves effective. The disadvantage is that this method requires you to physically check every device in the affected area of the network.
Bottom-up: Start at the physical layer and check all the physical components. Because many issues are Layer 1 related, this method often proves effective. The disadvantage is that this method requires you to physically check every device in the affected area of the network.
![]() Top-down: Start with the end-user applications that are not working properly and move down through the layers. This method proves most effective when you suspect that you have an issue related to software. The disadvantage is that it requires checking every network application until you find the possible problem. Which application do you begin with?
Top-down: Start with the end-user applications that are not working properly and move down through the layers. This method proves most effective when you suspect that you have an issue related to software. The disadvantage is that it requires checking every network application until you find the possible problem. Which application do you begin with?
![]() Divide-and-conquer: The network administrator uses experience and the nature of the symptoms to make an informed guess as to which OSI layer to start the investigation. After verifying that a layer is functioning properly, you can assume that the layers below it are functioning. The administrator can work up the OSI layers. If an OSI layer is not functioning properly, the administrator can work down the OSI layer model. The disadvantage to this method is that it requires more expertise than the other methods.
Divide-and-conquer: The network administrator uses experience and the nature of the symptoms to make an informed guess as to which OSI layer to start the investigation. After verifying that a layer is functioning properly, you can assume that the layers below it are functioning. The administrator can work up the OSI layers. If an OSI layer is not functioning properly, the administrator can work down the OSI layer model. The disadvantage to this method is that it requires more expertise than the other methods.
To quickly resolve network problems, take the time to select the most effective network troubleshooting method, as illustrated in Figure 15-4.

Troubleshooting at Each Layer
This section reviews some of the more common issues at each layer of the OSI model.
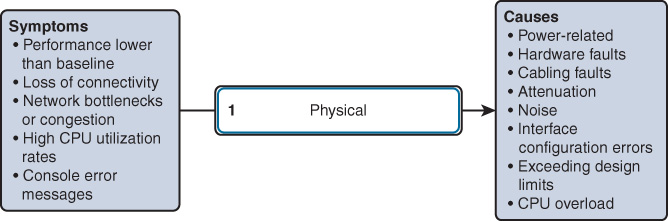
Physical Layer
Because the upper layers of the OSI model depend on the physical layer to function, a network administrator must know how to effectively isolate and correct problems at this layer. Figure 15-5 shows typical symptoms and their associated causes at the physical layer.
Data-Link Layer
Layer 2 problems cause specific symptoms that, when recognized, will help identify the problem quickly. Figure 15-6 shows typical symptoms and their associated causes at the data-link layer.

Network Layer
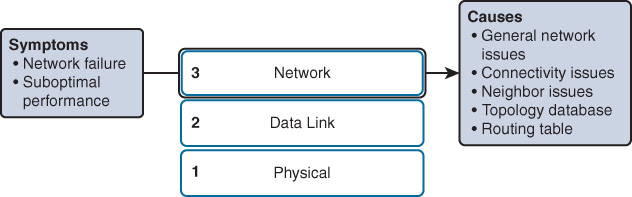
Network layer problems include any problem that involves a Layer 3 protocol, both routed protocols (such as IPv4 or IPv6) and routing protocols (such as EIGRP, OSPF, and so on). Figure 15-7 shows typical symptoms and their associated causes at the network layer.
Transport Layer
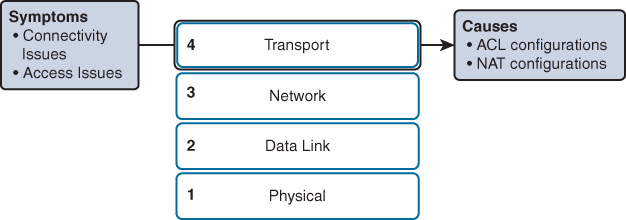
Network problems can arise from transport layer problems on the router, particularly at the edge of the network where traffic is examined and modified. Two of the most commonly implemented transport layer technologies are access control lists (ACLs) and Network Address Translation (NAT), as shown in Figure 15-8.
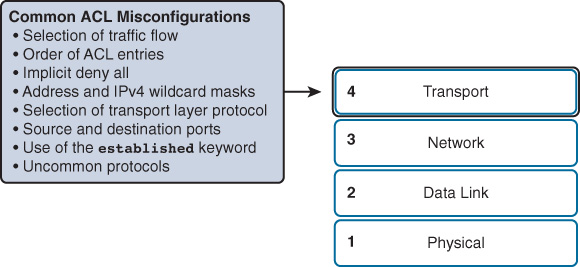
The most common issues with ACLs are caused by improper configuration, as shown in Figure 15-9.
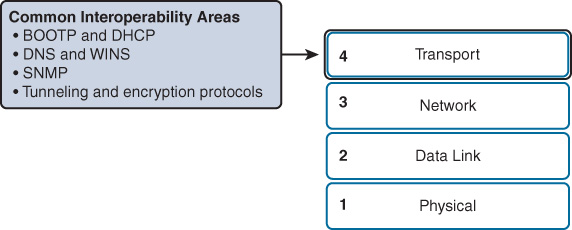
NAT can cause a number of unique issues, including misconfigured NAT inside, outside, or ACL. NAT can also cause issues when interoperating with other technologies such as the ones shown in Figure 15-10.
Application Layer
Application layer problems prevent services from being provided to application programs. A problem at the application layer can result in unreachable or unusable resources when the physical, data-link, network, and transport layers are functional. It is possible to have full network connectivity, but the application simply cannot provide data. The types of symptoms and causes depend upon the actual application itself. Figure 15-11 shows the most popular protocols that can cause issues at the application layer.
Bottom-Up and the Layers
When there is no end-to-end connectivity, and you choose to use the bottom-up method, here is an example of steps you could take:
Step 1 Check physical connectivity at the point where network communication stops.
Step 2 Check for duplex mismatches.
Step 3 Check data-link and network layer addressing on the local network. This includes IPv4 ARP tables, IPv6 neighbor tables, MAC address tables, and VLAN assignments.
Step 4 Verify that default gateways are correctly configured on devices that need it.
Step 5 Ensure that devices are determining the correct path from the source to the destination. Manipulate the routing information if necessary.
Step 6 Verify that the transport layer is functioning properly. You can also use Telnet to test transport layer connections from the command line.
Step 7 Verify that no access control lists (ACLs) are blocking traffic.
Step 8 Ensure that DNS settings are correct. There should be a DNS server that is accessible.
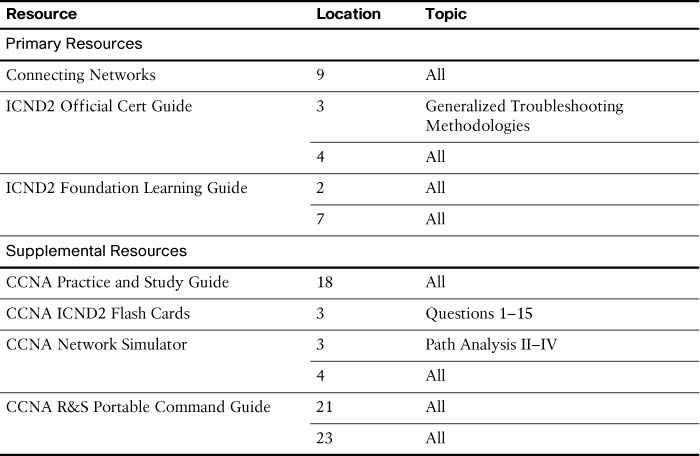
Study Resources
For today’s exam topics, refer to the following resources for more study.