Appendix B
The program description language
B.1. Overview
As the programs get more complex, it becomes necessary for the programmer to use some tools to help in the writing and testing of the developed code. There are several graphical or text-based tools that can be used to simplify the tasks of program development and testing. In this chapter, we are looking at the program description language (PDL, or sometimes called the Pseudocode) that can be used to show the flow of control in a program before the program is written.
B.2. Program development tools
Simple programs consisting of no more than 10 lines of code can easily be developed by writing the code without any prior preparation. The development of large and complex programs is easier if an algorithm is first derived and the program are broken down into smaller modules. The actual coding becomes an easy task after the algorithm is available. An algorithm describes the operational steps of a program, and it can be in the form of graphical or text-based, such as flowcharts, data flow diagrams, structure charts, PDLs, and unified modeling languages (UMLs). Flowcharts can be very useful tools to describe the flow of control in small programs where there are no more than a few pages of diagrams. The problem with graphical tools is that it can be time-consuming to draw or to modify them, especially if there is more than one diagram extending over several pages. PDL is not a programming language. It is a collection of text-based keywords and actions that help the programmer to describe the flow of control and data in a program in a stepwise and logical manner. The main advantage of the PDL is that it is very easy to modify a given PDL since it only consists of text.
In this book, we are using PDL wherever possible, but flowcharts will also be given where it is felt to be useful. In the next sections of this Appendix, we shall be looking at the basic constructs of PDL and at the same time show the equivalent flowchart of each PDL construct.
Note: There are many free of charge programs available on the Internet that can be used to help draw flowchart easily. Some of these programs are Microsoft Visio, Dia, yEd Graph Editor, ThinkComposer, Pencil Project, LibreOffice, Diagram Designer, LucidChart, and so on.
B.2.1. BEGIN – END
Every PDL description must start with a BEGIN and terminate with an END. The keywords should be in bold and the statements inside these keywords should be indented to make the reading easier. An example is shown in Fig. B.1.

Figure B.1 BEGIN-END statement and its equivalent flowchart.
B.2.2. Sequencing
In normal program flow, statements are executed in sequence one after another one. The operations to be performed in each step are written in plain text. An example sequencing is shown in Fig. B.2 together with its flowchart equivalent.
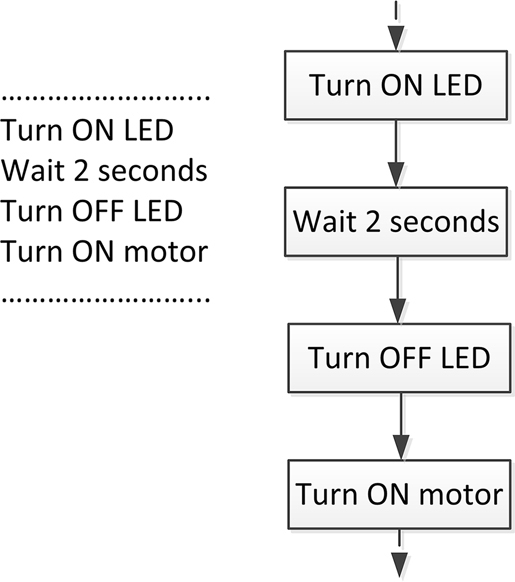
Figure B.2 Sequencing and its equivalent flowchart.
B.2.3. IF – THEN – ELSE – ENDIF
The IF-THEN-ELSE-ENDIF statements are used to create conditional statements and thus to change the flow of control in a program. Every IF statement must be terminated with an ENDIF statement. The ELSE statement is optional, and if used, it must be terminated with an ENDIF statement. It is also permissible to use ELSE IF statements in programs where multiple decisions are to be made. Figure B.3 to Figure B.5 show various examples of using the IF-THEN-ELSE-ENDIF statements.
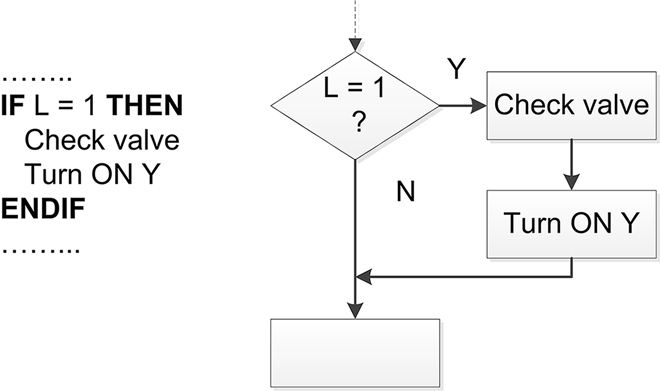
Figure B.3 Using IF-THEN-ENDIF.
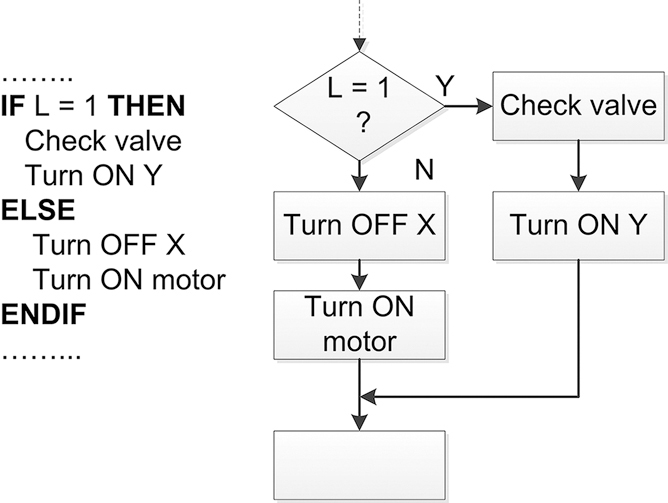
Figure B.4 Using IF-THEN-ELSE-ENDIF.
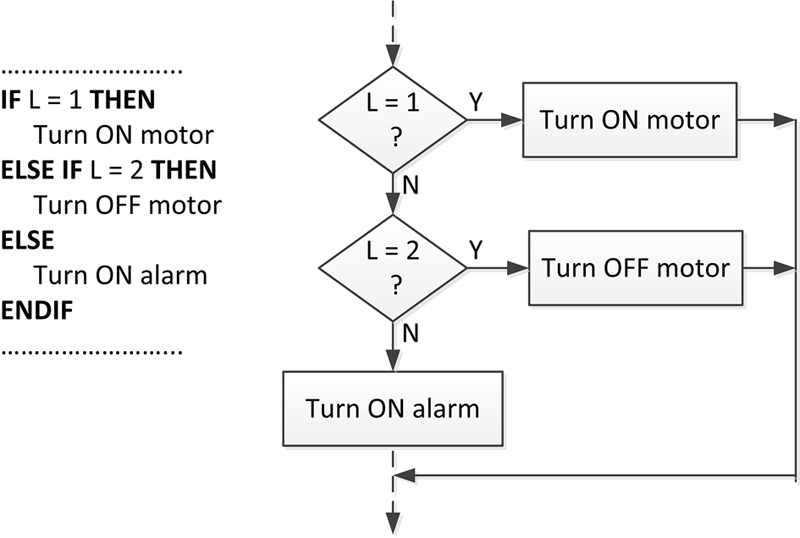
Figure B.5 Using IF-THEN-ELSE IF-ENDIF.
B.2.4. DO – FOREVER – ENDDO
The DO-FOREVER-ENDDO statement is used to repeat a loop forever. This kind of loop is commonly used in microcontroller applications where an operation or a number of operations are executed continuously. Fig. B.6 shows an example use of the DO-FOREVER-ENDDO statement.

Figure B.6 Using DO-FOREVER-ENDDO statement.
B.2.5. DO – ENDDO
The DO-ENDDO statement is used to create loops (or iterations) in programs. Every DO statement must be terminated with an ENDDO statement. It is permissible to use conditions after the DO statement to create conditional loops. An example DO-ENDDO loop is shown in Fig. B.7 where the LED is flashed 10 times with 2 seconds delay between each output. Another example DO-ENDDO loop is shown in Fig. B.8.

Figure B.7 Using DO-ENDDO statement.

Figure B.8 Another example of DO-ENDDO statement.
B.2.6. REPEAT – UNTIL
The REPEAT-UNTIL statement is similar to DO-ENDDO statement, but here the condition to terminate the loop is checked at the end and therefore the loop is executed at least once. Fig. B.9 shows an example REPEAT-UNTIL loop.
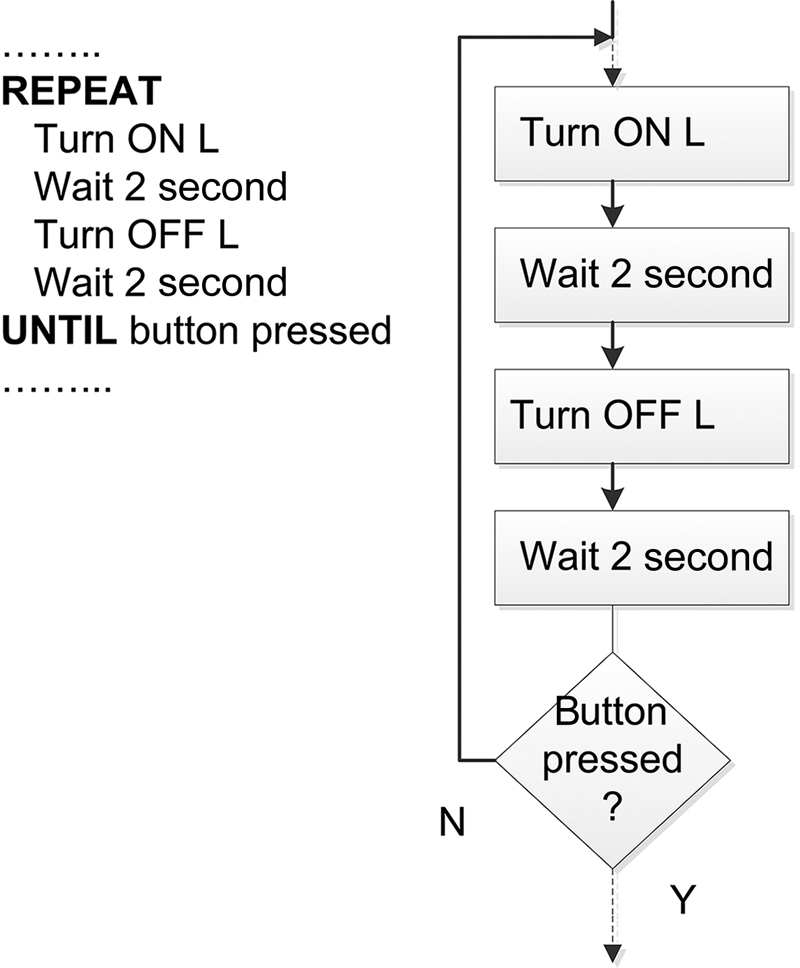
Figure B.9 Using REPEAT-UNTIL statement.
B.2.7. Subprograms
There are many ways that subprograms can be represented in PDLs and flowcharts. Since subprograms are independent program modules, they must start and finish with the BEGIN and END statements, respectively. We should also include the name of the subprogram after the BEGIN and END keywords. Fig. B.10 shows an example subprogram called DISPLAY. Both the PDL and the flowchart representation of the subprogram are shown in this figure.

Figure B.10 Subprogram DISPLAY.
B.2.8. Calling a subprogram
A subprogram can be called from the main program or from another subprogram. In PDL, a subprogram is called using the keyword CALL, followed by the name of the subprogram. In flowcharts, it is common practise to insert vertical lines at the two sides of the box where the subprogram is called. Fig. B.11 shows an example where subprogram DISPLAY is called from a program.
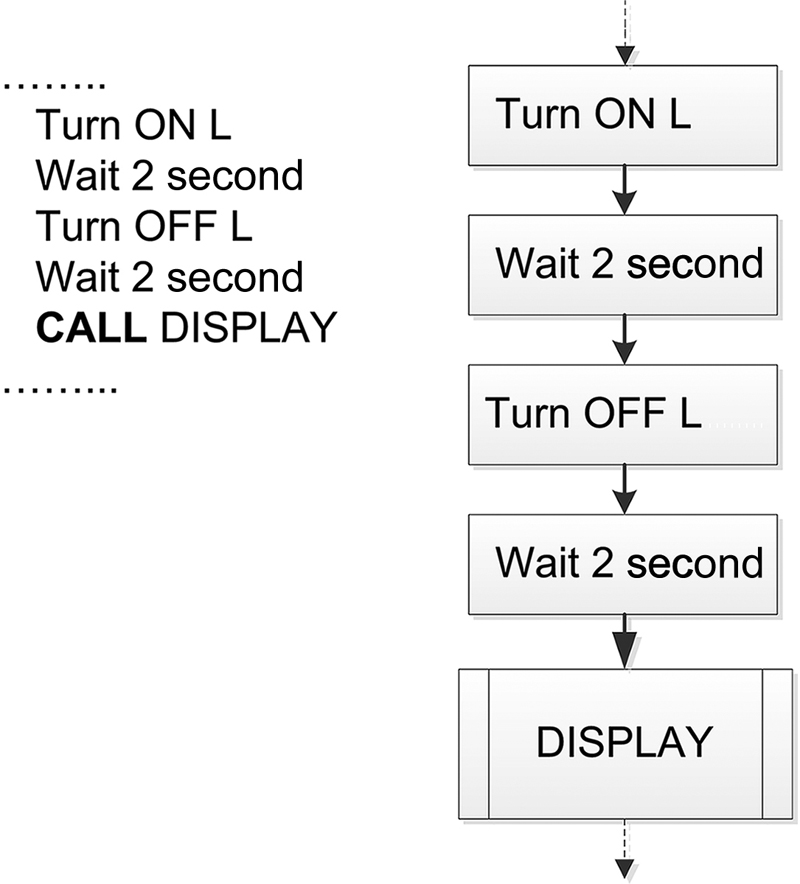
Figure B.11 Calling subprogram DISPLAY.
B.3. Examples
Some simple examples are given in this section to show how the PDLs and their equivalent flowcharts can be used in program development.
Example B.1
It is required to write a program to convert hexadecimal numbers “A” to “F” into decimal. Show the algorithm using a PDL and also draw the equivalent flowchart. Assume that the hexadecimal number to be converted is called HEX_NUM, and the output decimal number is called DEC_NUM.
Solution B.1
The required PDL is:
BEGIN
IF HEX_NUM = “A” THEN
DEC_NUM = 10
ELSE IF HEX_NUM = “B” THEN
DEC_NUM = 11
ELSE IF HEX_NUM = “C” THEN
DEC_NUM = 12
ELSE IF HEX_NUM = “D” THEN
DEC_NUM = 13
ELSE IF HEX_NUM = “E” THEN
DEC_NUM = 14
ELSE IF HEX_NUM = “F” THEN
DEC_NUM = 15
ENDIF
END
The required flowchart is shown in Fig. B.12. Notice that it is much easier to write the PDL statements than drawing the flowchart shapes and writing text inside them.
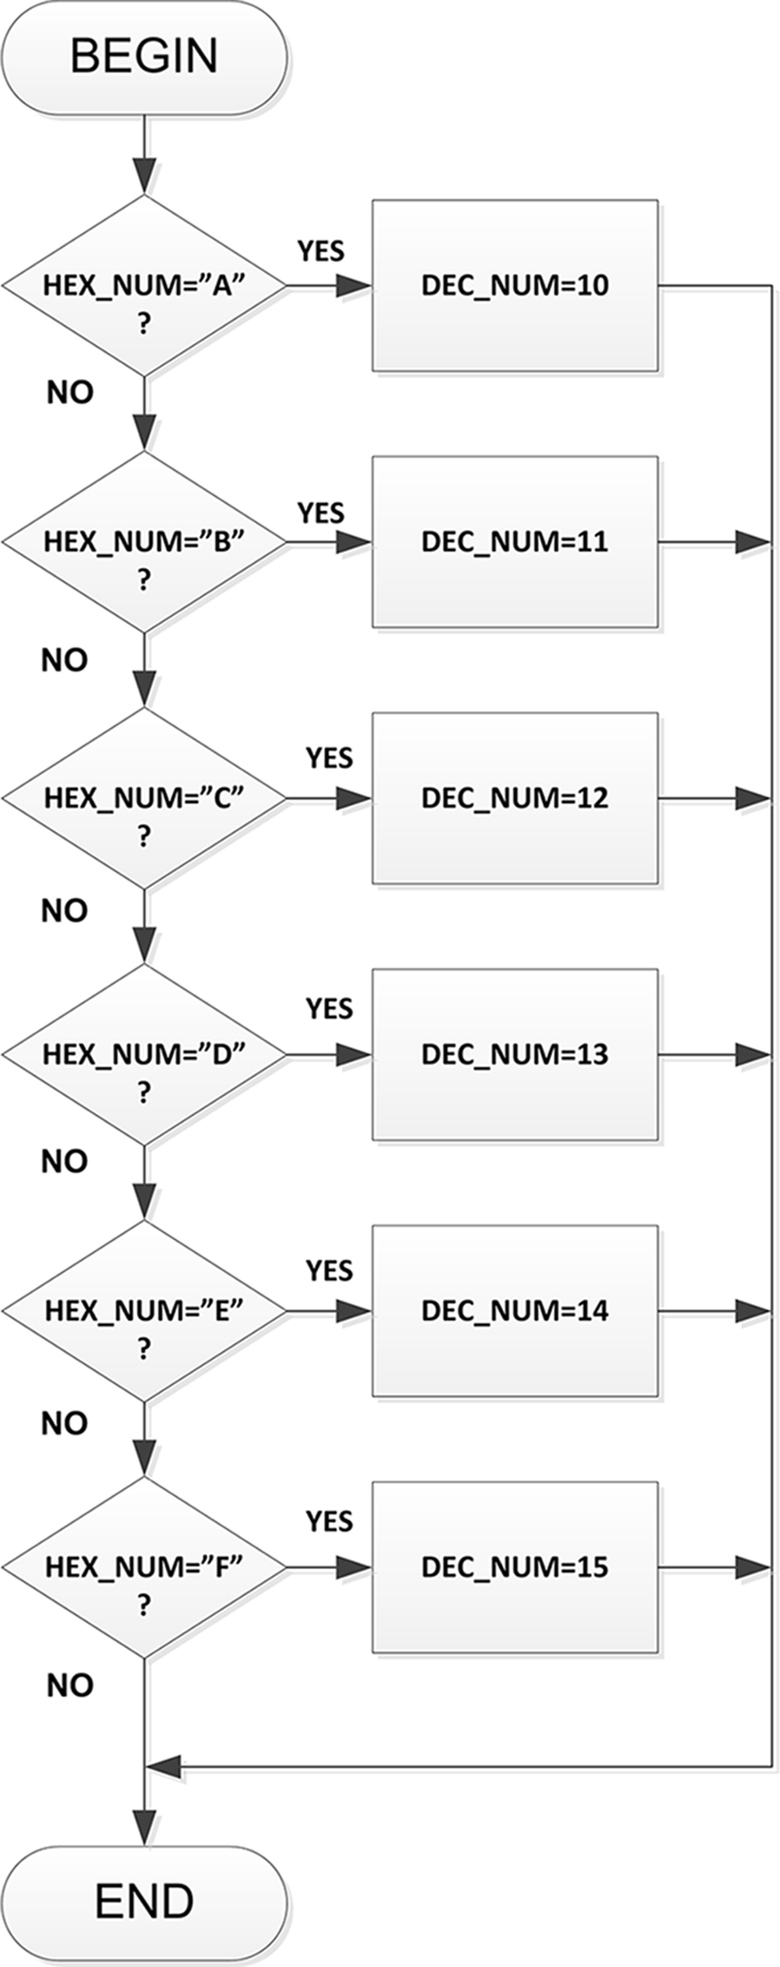
Figure B.12 Flowchart solution.
Example B.2
It is required to write a program to calculate the sum of integer numbers between 1 and 100. Show the required algorithm using a PDL and also draw the equivalent flowchart. Assume that the sum will be stored in variable called SUM.
Solution B.2
The required PDL is:
BEGIN
SUM = 0
I = 1
DO 100 TIMES
SUM = SUM + I
Increment I
ENDDO
END
The required flowchart is shown in Fig. B.13.
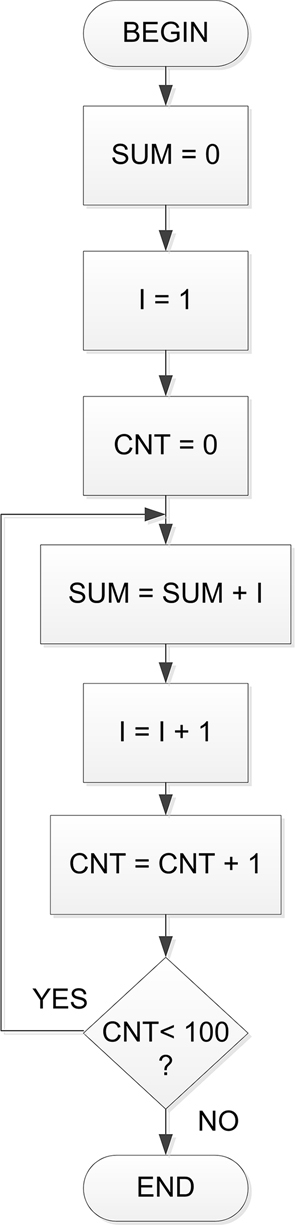
Figure B.13 Flowchart solution.
Example B.3
An LED is connected to a microcontroller output port. Additionally, a button is connected to one of the input ports. It is required to turn ON the LED when the button is pressed, and otherwise to turn OFF the LED. Show the required algorithm using a PDL and also draw the equivalent flowchart.
Solution B.3
The required PDL is:
BEGIN
DO FOREVER
IF Button is pressed THEN
Turn ON LED
ELSE
Turn OFF LED
ENDIF
ENDDO
END
The required flowchart is shown in Fig. B.14.

Figure B.14 Flowchart solution.
Example B.4
An analog pressure sensor is connected to one of the analog-to-digital (ADC) input ports of a microcontroller. Additionally, an LCD display is connected to the output ports. It is required to read the pressure every second and then display on the LCD. Show the required algorithm using a PDL and also draw the equivalent flowchart. Assume that the display routine is a subprogram called DISPLAY.
Solution B.4
The required PDL is:
BEGIN
DO FOREVER
Read Temperature from ADC port
CALL DISPLAY
Wait 1 second
ENDDO
END
BEGIN/DISPLAY
Display temperature on LCD
END/DISPLAY
The required flowchart is shown in Fig. B.15.
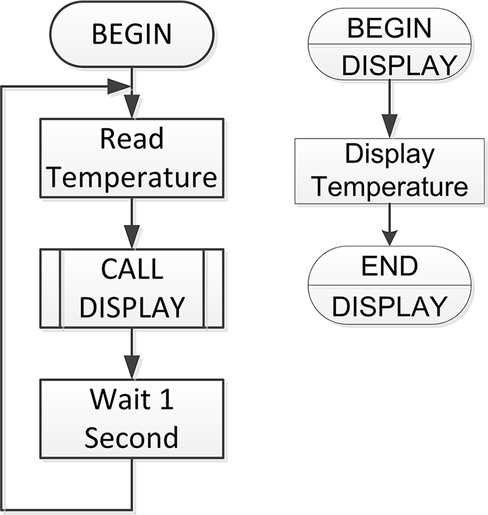
Figure B.15 Flowchart solution.
..................Content has been hidden....................
You can't read the all page of ebook, please click here login for view all page.