
10
Partial Responses and Single-Sideband Optical Modulation
Optical fiber communication systems have continuously evolved over the years. The increasing demand for a higher transmission capacity has driven the development of communication systems at ultra-high capacities and ultra-high bit rates. The fact that a 40 Gbps optical fiber communication system can have an extended reach and improved capacity makes it an attractive alternative to the 10 Gbps optical fiber communication system. System performance is further enhanced by employing various advanced modulation formats, such as duobinary (DB), return-to-zero differential phase shift keying (RZ-DPSK), and non-return-to-zero differential phase shift keying (NRZ-DPSK) [1, 2, 3, 4, 5, 6, 7, 8, 9 and 10]. Research and investigations have been carried out to determine the most appropriate and efficient formats that meet the current as well as future demand.
DB format, in the photonic domain, offers three-level coding, but, unlike electronic or wireless communication systems, the “−1” and “+1” are coded using the phase of the lightwave carrier, that is, either “0” or “π.” This coding would overcome the dispersion due to its single-sideband property, and the detection scheme is much simpler as direct detection technique can be employed. The single sideband can also be implemented using vestigial sideband modulation technique, that is, an optical filter (OF) can be inserted after the optical modulator to filter half of the band of the spectrum. Alternatively, the modulators can be conditioned with two Hilbert transform signals and hence the suppression of half of the band [11, 12 and 13].
The first part of this chapter presents a comprehensive modeling platform for duobinary modulation (DBM) format optical fiber transmission system. The modeling of the system is developed on the MATLAB® and Simulink® 7.0 or higher. Simulink has been chosen due to the availability of blocks, such as the communication blocksets and signal processing blocksets, which eases the process of implementation.
Further, it is demonstrated that the transmission of 40 Gbps alternating phase 0 and π DBM format with 33% and 50% pulse width is demonstrated with a CD tolerance of 850 ps/nm and at least 2 dB receiver sensitivity improvement as compared with that employing carrier-suppressed DPSK.
The second part of this chapter describes the transmission of optical multiplexed channels of 40 Gbps using vestigial single-sideband modulation format over a long-reach optical fiber transmission system. Thus, it is essential that an OF be designed to follow the optical modulator to filter half of the signal band. The effects on the Q factor of fibers dispersion, the passband and roll-off frequency of the OFs, and the channel spacing are described. The performance of the optical transmission using low and nonzero-dispersion fibers and/or dispersion compensation is then given. It has been demonstrated that a BER of 10−12 (without FEC) or better can be achieved across all channels, and that minimum degradation of the channels can be obtained under this modulation format. OFs are designed with asymmetric roll-off bands. Simulations of the transmission system are also given and compared for channel spacings of 20, 30, and 40 GHz. It is shown that the passband of 28 GHz and 20 dB cutoff band perform best for 40 GHz channel spacing.
All receptions employed in the systems described here are self-homodyne coherent types, as explained in Chapter 5.
10.1 Partial Responses: DBM Formats
10.1.1 Introduction
The demand for high-capacity long-haul telecommunication systems has increased over the recent years. To achieve high throughput of signals with minimum errors, different advanced modulation formats, such as ASK, PSK (coherent and differential in-coherent), and FSK, have been proposed, and comparisons are made to determine which modulation format would offer the best transmission performance. In countering performance degradation, modulation formats aim to narrow down the optical spectrum to enable close channel spacing in the network. They increase symbol duration, so that more uncompensated dispersion accumulates before intersymbol interference (ISI) becomes significant. Furthermore, this format is more resilient to fiber nonlinearities and optical signal distortion.
Modulation format is important in determining the performance of 40 Gbps optical fiber communication systems. DB and continuous phase modulation (CPM) are shown to offer high spectral efficiency [14,15]. DB modulation formats minimize ISI impairments in a controlled way instead of trying to eliminate it. It is possible to achieve a signaling rate of equal to the Nyquist rate of 2W symbols per second in a channel of bandwidth W Hz. Optical DB technique has received much attention due to its high dispersion tolerance and high-frequency utilization efficiency by means of spectral narrowing. DBM format is similar to the non-return-to-zero (NRZ) format, with inclusion of phase coding. The phase characteristics of DBM signals compensate for the group velocity dispersion by reducing the spectral component in conventional NRZ modulation. ISI is reduced, since bit patterns such as 101 are transmitted with the ones carrying the opposite phase. Therefore, if pulses spread out into the zero time slot, due to dispersion, they tend to cancel each other out. The recovering of signals at the receiver is relatively simple. Furthermore, direct detection receiver can be used to simplify and can be offered as a low cost solution. There are two types of DBM schemes, which are constant phase and alternating phase in blocks of logics “1s.”
This chapter presents the models for photonic transmission with optical channels operating under DBM format. This includes the development and implementation of the photonic transmitter, the optical fiber propagation, and the optoelectronic receiver. DBM encodes two-level electrical signal to three-level electrical signal before modulating the lightwave carrier. The transmitter of the Simulink model will consist of a DB encoder and a dual-drive Mach–Zehnder interferometric modulator (MZIM). A baseband modulation is first implemented in the DB encoder, which encodes the binary signal into three levels of signals—“1,” “0,” and “−1.” MZIM is an electro-optic modulator that converts the electrical signal to optical signal.
The DB or phase-shape binary modulation formats can be generated by modulating a dual-drive MZIM with the bias voltage located at the Vπ and the amplitude of the signals must be at 0 and 2Vπ. Recent works have shown that the driving voltages for the modulator can be reduced to generate variable-pulse-width DB optical signals. However, the pulse width of the DB-DPSK has not been thoroughly investigated under the alternating phase of the “1” coded bits. That means the “0,” “π,” “0,” “π” phases of consecutive “1” in contrary of conventional DB formats. We also present modeling performance of alternating-phase DB modulation with a full-width half mark (FWHM) ratio with respect to the bit period of 100%, 50%, and 33%, and compare with experimental transmission of carrier-suppressed DPSK over 50 km of SSMF and dispersion compensation. For the DB case, the transmission without dispersion compensation over the same SSMF length offers better performance for 50% FWHM DB modulation and slightly poorer for 33%. The transmission performance, the bit error rate versus receiver sensitivity, of these DB modulation formats are compared with the carrier-suppressed DPSK experimental transmission.
Section 10.2 of this chapter describes the fundamental aspects of the DBM format. It is followed by a description of each component of the 40 Gbps DBM photonic transmission system in Section 10.3. Section 10.4 describes the implementation of the Simulink model of the communication system. Next, Section 10.5 gives the simulated results. Finally, comparisons with theoretical analyses and other modulation formats are given.
10.1.2 DBM Formatter
Modulation format aims to modulate one or more field properties to suit system needs. There are four types of field properties, which are intensity, phase, polarization, and frequency. Symbols are constellated in one or more dimensions, in order to carry more information and to travel a further distance. Data modulation format is the information-carrying property of the optical field.
DBM format has become an attractive modulation format over the recent years, compared to other formats, such as NRZ and return-zero (RZ). This is due to the fact that it can overcome the fiber chromatic dispersion in high-capacity transmissions. The characteristics of the DBM format make it the preferred format.
DBM schemes can be described as correlative-level coding or partial-response-signaling schemes. Correlative coding schemes can be implemented by inserting ISI to the transmitted signal in a controlled manner.
A signaling rate equal to the Nyquist rate of 2W symbols per second in a channel of bandwidth W Hz can then be achieved. “Duo” in the word duobinary indicates the doubling of transmission capacity of a conventional binary system. DBM format is, in fact, NRZ modulation with an inclusion of phase coding. The one bits in the data input are phase modulated. For instance, for a bit pattern of 101, this data will be transmitted with the ones carrying opposite phase, 0 and π. If the pulse of the one bits spreads out to the zero time slot in between, they will cancel each other. This effect increases the dispersion tolerance, and allows the signal to be transmitted over a longer distance.
DB coding converts a two-level binary signal of 0’s and 1’s into a three-level signal of “−1,” “0,” and “+1.” This is done by, first, applying the binary sequence to a pulse-amplitude modulator to produce two-level short pulses of amplitudes −1 and +1, with −1 corresponding to 0 and +1 corresponding to 1. This sequence is, then, applied to a DB encoder to produce a three-level output of “−2,” “0,” and “2.”
As shown in Figure 10.1 input sequence, {ak} of uncorrelated two-level pulses is transformed into {ck}, which is a sequence of correlated three-level pulses. The correlation between adjacent pulses is equivalent to introducing ISI into the transmitted signal in an artificial manner. The DB encoder is simply a filter involving a single delay element and a summer, as shown in Figure 10.2. However, once errors are made, they tend to propagate through the output. This is because a decision made on the current input ak depends on the decision made on the previous input ak−1. Therefore, precoding is needed to avoid this error propagation phenomenon. Binary sequence, {bk}, is converted into another binary sequence, {dk}, by modulo-2 addition, exclusive OR of bk and dk−1, as shown in Figure 10.3.

FIGURE 10.1 Brief overview of duobinary signaling.

FIGURE 10.2 Duobinary encoder—the block at the left is represented by the signal flow diagram shown in the right.
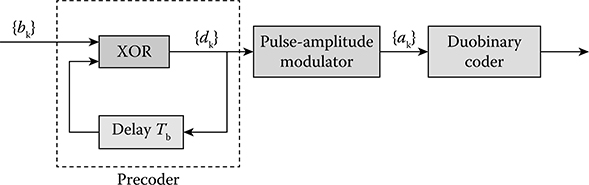
FIGURE 10.3 Duobinary modulation scheme with precoder.
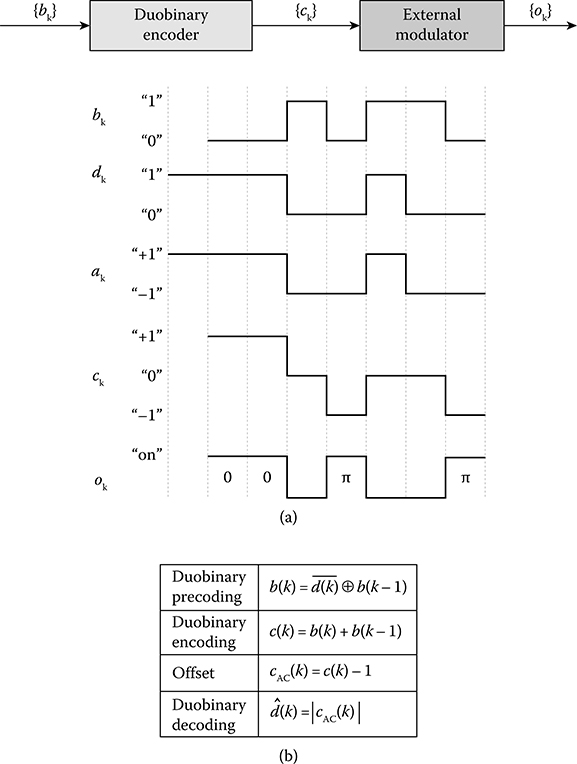
FIGURE 10.4 (a) Example of original binary signal (bk), precoded signal (dk), duobinary-encoded signal (ck), and optical duobinary signal (ok). (b) Summary of coding rule.
The three-level DB output, {ck}, is then modulated into a two-level optical signal by an external modulator. The most commonly used external modulator is the MZIM. The optical DB signal has two intensity levels, “on” and “off.” The “on” state signal can have one of two optical phases, 0 and π. The two “on” states correspond to the logic states “1” and “−1” of the DB-encoded signal, {ak}, and the “off” state corresponds to the logic state “0.” Figure 10.4a shows an example of the original binary signal, the DB-encoded signal, and optical DB signal, and then Figure 10.4b shows a summary of the coding rule.
10.1.3 40 Gbps DB Optical Fiber Transmission Systems
Ultra-long terrestrial networks, transmitting signals at a bit rate of 40 Gbps, has matured over recent years. Various advanced modulation schemes, such as RZ, NRZ, NRZ-DPSK, and RZ-DPSK, have been proposed to achieve extended reach and improved capacity of communication systems.
Figure 10.5 shows the typical DWDM optical fiber communication system. Signals are modulated at the transmitters and are multiplexed together at the wavelength multiplexer before transmitting them into the fiber. The fiber link is divided into a number of spans. Each span consists of an SSMF and a dispersion-compensating fiber (DCF). The EDFA is used to compensate for the optical power loss of the transmission span. At the end of the fiber, the signals are demultiplexed and detected at the receivers.
DBM format has become popular compared to other modulation formats because it extends the transmission distance as limited by fiber loss, without regenerative repeaters. It extends the dispersion limit without additional optical components, such as the DCF. Chromatic dispersion has become a main effect that limits the transmission distance. The optical three-level transmission can overcome this limitation since narrowband signals have higher tolerance to chromatic dispersion compared to broadband signals. Furthermore, DB optical fiber communication system can suppress stimulated Brillouin scattering (SBS).
The main modules of the communication system are the transmitter, optical fiber, and the optoelectronic receiver, as shown in Figure 10.6. The transmitter consists of the DB encoder and the MZIM. A series of 0’s and 1’s is modulated under the DBM scheme. These three-level electrical data are then used to modulate the laser source, producing a two-level optical signal. This modulated signal are transmitted along an optical fiber transmission link toward the electro-optic receiver. The signal will be detected using a photodetector, which converts the two-level optical signal back into an electrical signal. Optical amplification can be done at some point along this transmission link to minimize the effect of fiber loss.
10.1.4 Electro-Optic Duobinary Transmitter
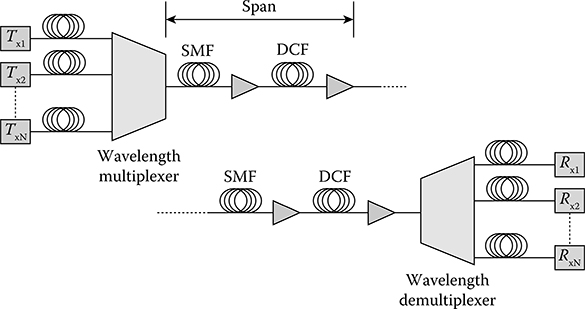
FIGURE 10.5 Ultra-long-haul fiber transmission.
A transmitter modulates and converts incoming electrical signals into the optical domain. Depending on the nature of the signal, the resulting modulated light may be turned on and off, or may vary linearly in intensity between the two levels. The output of the DB transmitter is the modulated lightwaves switched on and off at transitional instances of the input electrical signal. In general, a DBM transmitter is shown in Figure 10.7, consisting of a monochromatic laser source, a coder, and a photonic modulator. Binary data are encoded by a DB encoder. This resulting three-level electrical signal is converted into a two-level optical signal using the folding characteristic of an optical MZIM. It is then transmitted into the optical fiber.
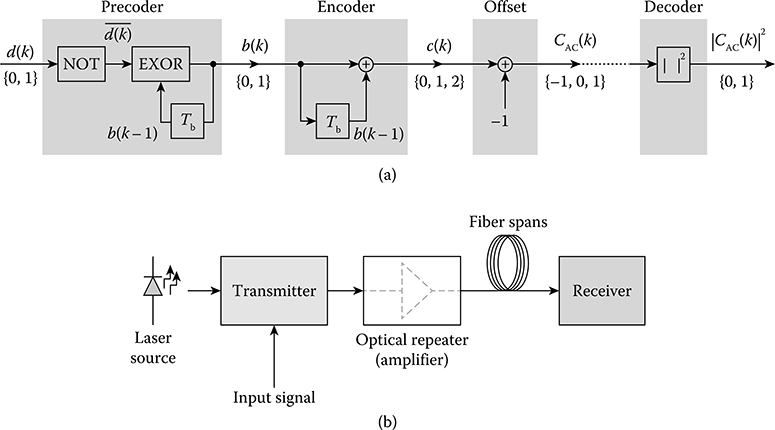
FIGURE 10.6 Main modules of a duobinary modulation optical communication system: (a) coder and decoder and (b) generic transmission system.
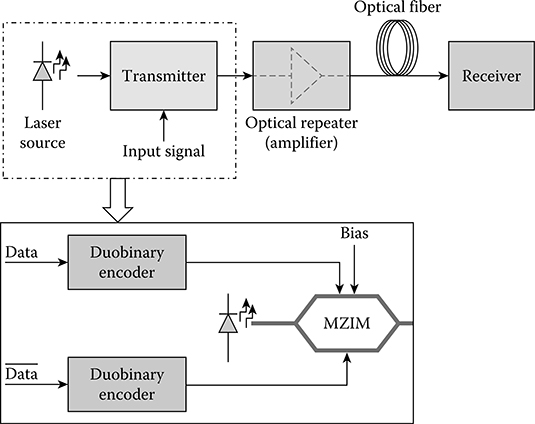
FIGURE 10.7 The transmitter of the 40 Gbps DBM photonic transmission system.
There are two types of DB transmitters. The conventional DB transmitter, as previously mentioned, includes a dual-drive MZIM driven by three-level electrical signals in a push–pull configuration. It is proposed that three-level signals may experience significant distortion in electrical amplifiers operating in saturation, leading to penalties for long word lengths. It may also cause the degradation of receiver sensitivity. For these reasons, a second type of DB transmitter has been proposed. This type of transmitter has the MZ modulator driven by only two-level electrical signals. The optical DB signal generated is the same as the DB transmitter type one, that is, constant phase in blocks of 1’s.
10.1.5 DB Encoder
The DB encoder encodes the binary signals, which is a sequence of 0’s to a three-level electrical signal. The DB signal is a fundamental correlative coding in partial response signaling. A DB encoder consists of a precoder and a DB coder. A precoder is used before DB coding to allow for easier recovery of binary data at the receiver, and to avoid error propagation. The precoder is a simple binary digital circuit that consists of an exclusive OR (XOR) and a one-bit delay feedback. The DB coder is a filter consisting of a single delay element and a summer.
Binary data input is precoded, with initialization of the one-bit delay to 0. The output of the DB precoder is, then, modulated by a pulse-amplitude modulator, to produce a two-level electrical signal with amplitude of −1 and 1. The DB signal is produced by adding the data delayed by one-bit period to the present data. This DB signal is a three-level electrical signal of −2, 0, and 2. Finally, it is converted to a level of −1, 0, and 1. The three-level is mapped into the optical domain by modulating both amplitude and phase. The “+1” and “−1” levels have the same optical intensity but opposite optical phase. The DB encoder structure is shown in Figure 10.8.
10.1.6 External Modulator
Although the electro-optic modulator has been described in Chapter 2, it is essential here to revisit the operation of the MZIM for DB operation. In an MZIM, the input optical carrier is split into two paths via a Y junction. This Y junction splits the input signal into Ei/√2 each. The resultant signal is
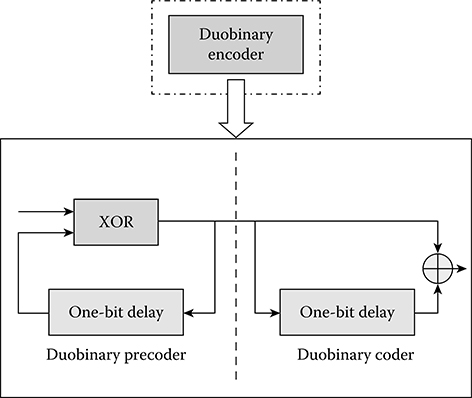
FIGURE 10.8 The DBM encoder of the 40 Gbps DBM photonic transmission system.
where Vπ is the voltage to provide a π phase shift of each phase modulator, and V(t) is the driving voltage. Note that, in this equation, the term ejωt (ω = optical angular frequency) indicating the optical wave phase is removed. The transfer relationship between the input and output of this MZIM is as shown in Figure 10.9. It is accompanied by a phase modulation of exp(jφ(t)) with φ(t) = πV(t). For V(t) from 0 to Vπ, Eo and Ei have the same phase, and as for V(t) from Vπ to 2Vπ, Eo and Ei have different phases.
MZIM can be single drive or dual drive. Single-drive x-cut LiNbO3 MZM has no phase modulation along with the amplitude modulation. It follows the transfer characteristics of Figure 10.9. Dual-drive x-cut LiNbO3 MZIM, on the contrary, has two paths phase modulated with opposite phase shifts in a push–pull operation. The Vπ in Figure 10.9 is reduced by half in this case. For dual-drive y-cut LiNbO3 MZIM, two paths are driven by complementary signal with V1 equals to –V2. The output electric of a dual-drive MZIM is
DB optical signal is generated by driving a dual-drive MZIM with push–pull operation, as shown in Figure 10.10.
One arm is driven by the DB signal and the second arm is driven by the inverted DB signal. Figure 10.11 [6] shows the operation of the MZIM. The output electric field Eo(t) can be expressed as
where Ei is the input electric field, Δϕ(t) is the phase difference between the lightwaves propagating in two optical waveguides, and ϕ0 is a constant when the MZIM is driven in a push–pull operation.
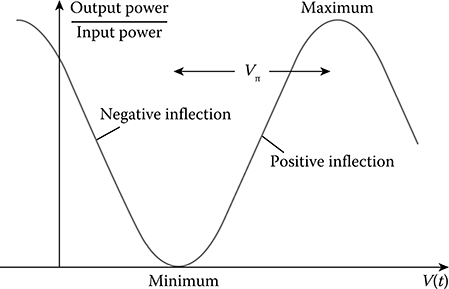
FIGURE 10.9 Input–output transfer characteristics of the MZIM.

FIGURE 10.10 Dual-drive MZIM.
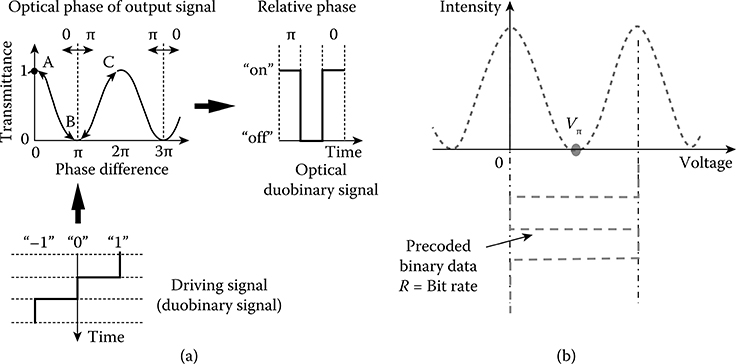
FIGURE 10.11 Driving operation of dual-drive MZM (a) duobinary signaling and (b) DPSK. (From T. Franck et al., IEEE Photon. Technol. Lett., Vol. 10, No. 4, pp. 597–599, 1998.)
At point B of Figure 10.11, the phase of the output optical signal is inverted. The optical DB signal is dependent on the biasing point of the driving signal, which is the electrical DB signal. By biasing at point B in Figure 10.11, “−1” and “+1” level of the electrical DB signal will correspond to the “on” state of the optical signal, whereas the “0” level will correspond to the “off” state. To achieve the effect of carrier suppressed, there must be a π phase different between the two arms.
10.1.7 DB Transmitters and Precoder
The transmitter model, generally, consists of the DB coder and the MZIM. The DB coder encodes the incoming binary sequence of 0’s and 1’s to DB electrical signal. This signal is, then, used to drive the arms of the dual-drive MZIM. One arm is driven by the DB signal, and the other arm is driven by the inverted DB signal. The Bernoulli binary generator generates a random sequence of binary electrical signals. It is set to generate the data at a rate of 40 Gbps. This signal is encoded by the DB encoder, which consists of a DB precoder and a DB coder. The first output of the encoder is shifted up by 1 to produce levels of “0,” “1,” and “2.” Figure 10.12 shows a conventional Simulink model of the transmitter for DB. This electrical DB signal is sent to the phase shift block, as shown in Figure 10.13, to represent these levels with a certain phase. This, in fact, represents the biasing point on the transmittance curve. For dual-drive MZIM, the driving signal is biased at Vπ/2. The second output of the DB encoder is the inversion of output 1. This output is used to modulate the second arm of MZIM. The output 2 signal is shifted down by −1, to bias at the point −Vπ/2 of the transmittance curve. MZIM is an amplitude modulator, accompanied by a shift of phase. This modulation is also called AM-PSK. This lightwave, which is the sine wave produced by the sine wave function, is modulated by the DB signal through the complex phase shift block. The input sine wave is shifted by the amount specified at the Ph input.
The DB coder consists of a precoder and a coder, as shown in Figure 10.14. The precoder is a differential coder, with an exclusive OR (XOR) gate and a one-bit delay feedback path. The addition of −0.5 and division by 2 function as the amplitude modulator, which shifts levels of the signal from “0” and “1” to “−1” and “+1.” The signal is, then, added to its one-bit delay to produce a three-level DB signal of level “−2,” “0,” and “+2,” followed by a conversion to a level of “−1,” “0,” and “+1.” The summation of the signal with its one-bit delay is the DB coder. For the second output, the output of the differential coder is inverted, before going through the same operation as Out1. Zero-order hold is placed before the output of the DB encoder functions to discretize the signals to have a fast-to-slow transition of signals. It holds and samples the signal before transmitting it out. If the signals are transmitted out without the zero-order hold, the transition to “0” level will be overseen. The signal will only have two levels, which are “−1” and “+1.”
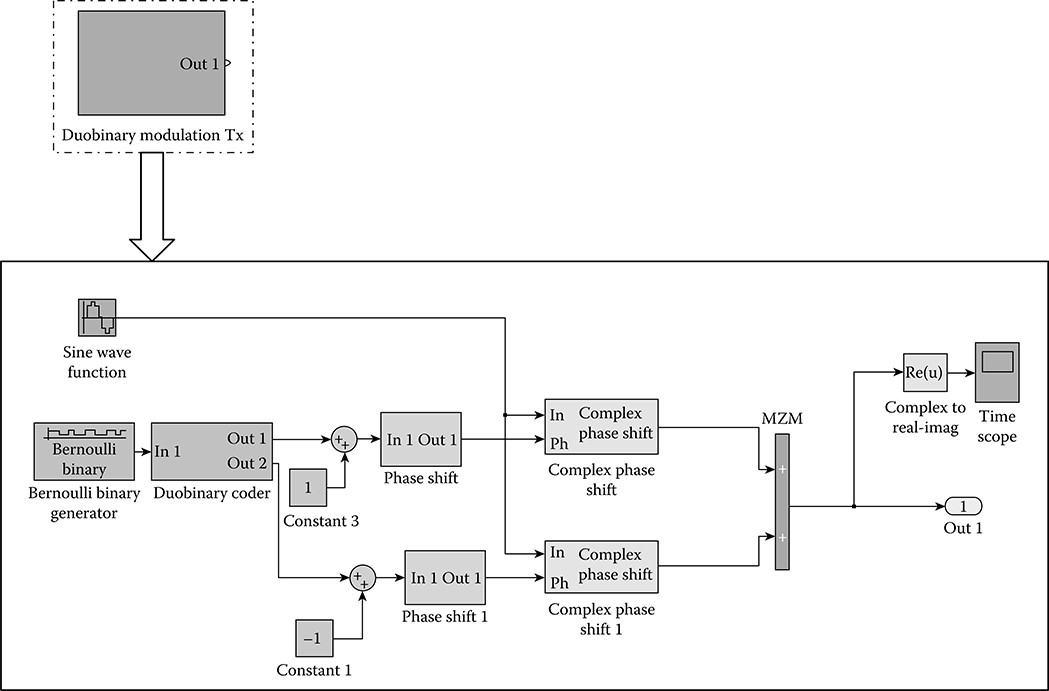
FIGURE 10.12 The conventional transmitter model of the 40 Gbps duobinary optical fiber communication system.
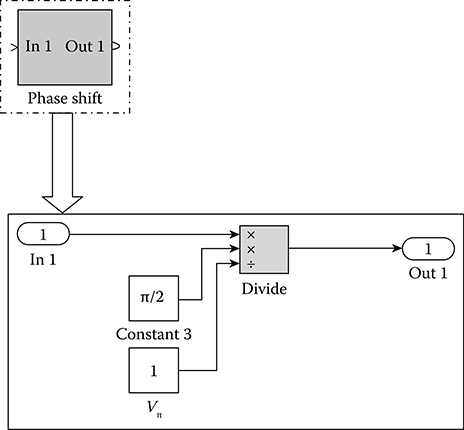
FIGURE 10.13 Phase shift block of the transmitter model.
10.1.8 Alternative Phase DB Transmitter
Two types of DB transmitter model are proposed. The conventional DB transmitter, as mentioned previously, uses a dual-drive Mach–Zehnder modulator driven by three-level DB electrical signals. The MZIM shown in Figures 10.15 and 10.16 is the DB transmitter type 2, and is usually driven by a two-level electrical signal. In some cases, this three-level driving signal may experience significant distortion in electrical amplifiers operating at saturation. This may lead to penalties for long word lengths. It may also occur that there will be a degradation of receiver sensitivity. Due to these uncertainties, an alternative DB transmitter, as shown in Figure 10.15 and 10.17, is proposed. This second type of DB transmitter has the MZIM driven by two-level electrical signals. It consists of a differential encoder, a one-bit period electrical time delay, and an MZ modulator. One arm of the dual-drive MZ modulator is driven with the signal from the original signal, whereas the other arm is driven by the inverted signal, delayed by a one-bit period. Both DB transmitters produce the same result, which is a constant phase in blocks of 1’s.
10.1.9 Fiber Propagation
As described in Chapter 3, the fiber propagation model models the linear and nonlinear dispersion effects that exist over the entire length of the optical fiber can be represented by the NLSE including the SPM, other nonlinear effects can also be included, given by
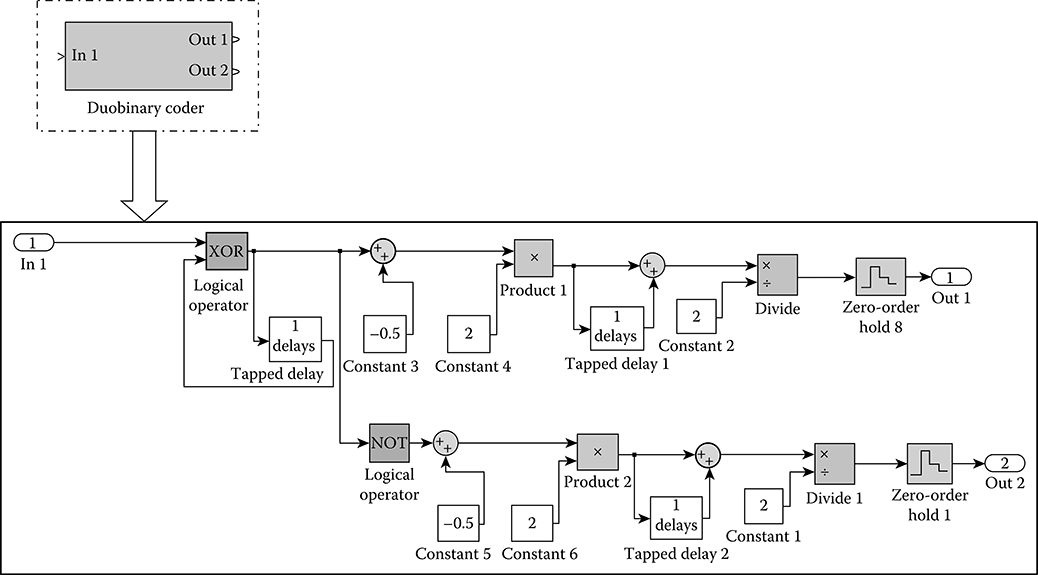
FIGURE 10.14 The duobinary coder of the transmitter model.
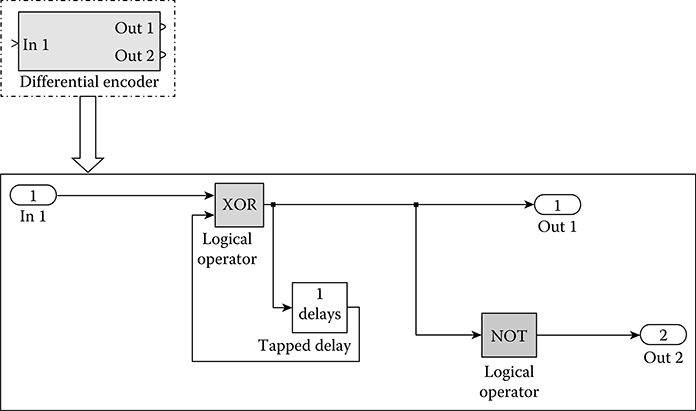
FIGURE 10.15 Duobinary modulation transmitter (type 2).
With β1 the lightwave group delay, β2 and β3 are the first-order and second-order group velocity dispersions, γ is the nonlinear coefficient, and A is the pulse envelope. NLSE can be solved by the split-step Fourier method (SSFM) that integrates two main steps of the split-step model, the nonlinear effects act alone in frequency domain and then the linear effects in the linear Fourier transform domain.
where L and N represent linear and nonlinear operators, respectively, which can be extracted from the NLSE.
The fiber propagation block, as shown in Figure 10.18, consists of a Gaussian filter, a gain factor, and the single-mode fiber (SMF) model. The SMF model is shown in Figure 10.19. This model is based on the SSF method. It splits the fiber into a number of small sections. All parameters needed for the SSF operations are concatenated into a matrix, before passing it to the MATLAB function. The MATLAB function block solves the NLSE using the SSFM. Linear operation is implemented in all steps. When the peak power is greater than the nonlinear (SPM) threshold, the nonlinear operator is activated. In this fiber propagation model, a buffer is incorporated at various locations along the propagation path. The buffer is used to redistribute the input samples to a new frame size—in this case, a larger frame size than that of the input. Buffering to a larger frame size yields an output with a slower frame rate than the input. The “Unbuffer” block unbuffers the frame-based input into a sample-based output. The buffer used in this model determines the number of bits sent into the fiber, which is the SMF block.
Probes are connected at two different points of the fiber propagation model. These probes determine the sampling time at these points. The sampling time of 2.5e−11 indicates down-sampling to baseband. At the baseband, the complex envelope of the signal is extracted and transmitted through the fiber, which is represented by the SMF block shown in Figure 10.18. However, the phase contents of the signal are maintained and are transmitted through the fiber. These phase components of the DB signal are important, because it increases the dispersion tolerance and, thus, allow the signal to travel a longer distance.
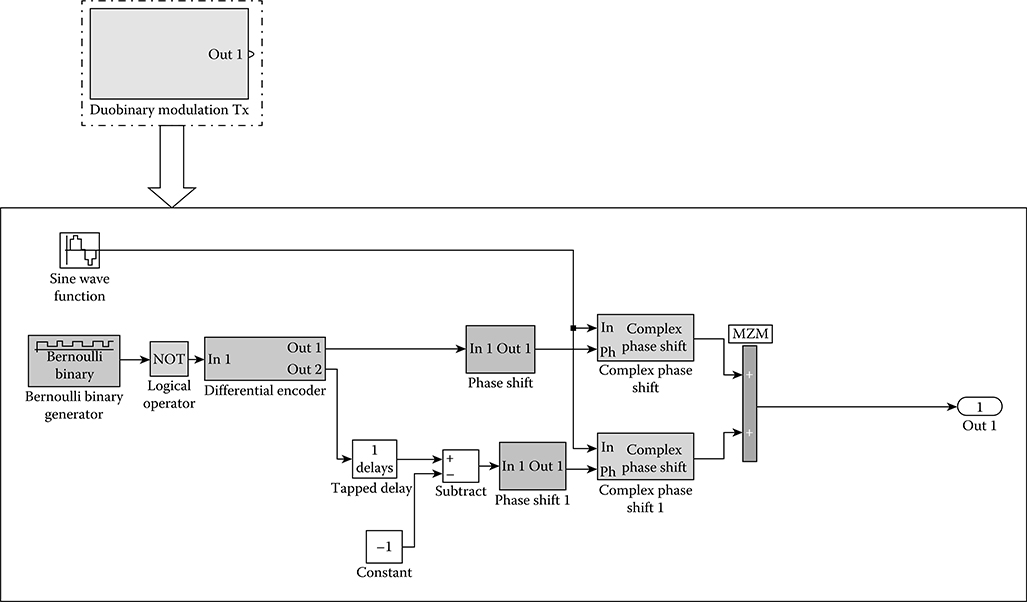
FIGURE 10.16 Simulink® model of MZIM.
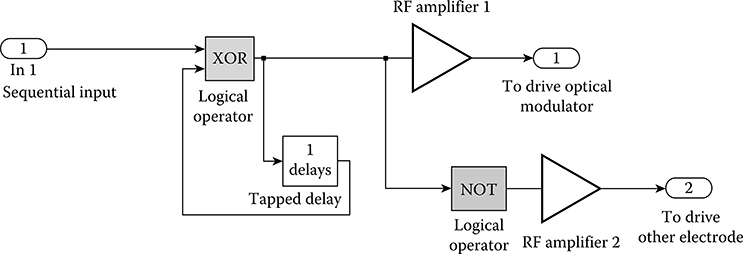
FIGURE 10.17 The differential encoder of Type 2 duobinary transmitter incorporating electrical RF amplifier for driving the MZIM optical modulator.
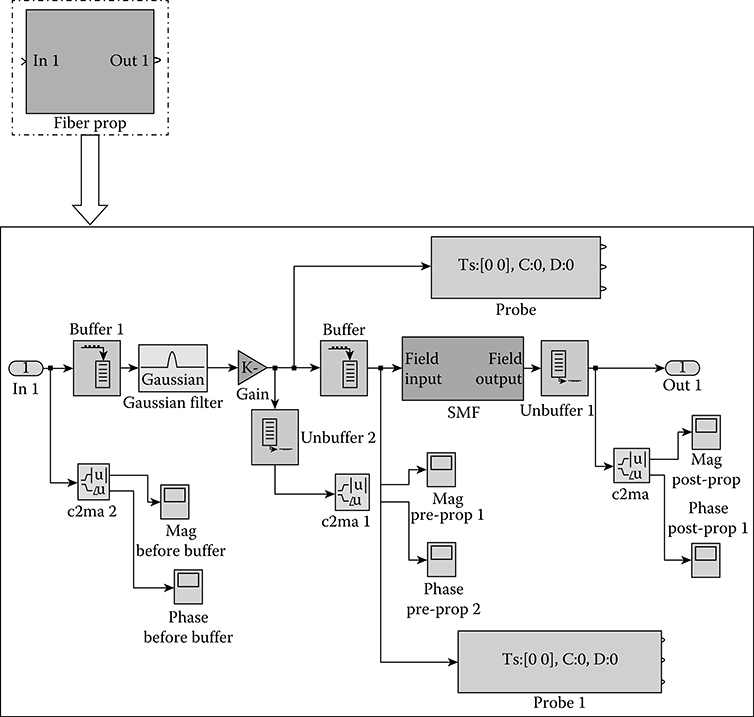
FIGURE 10.18 Fiber propagation model of the 40 Gbps duobinary optical fiber communication system.
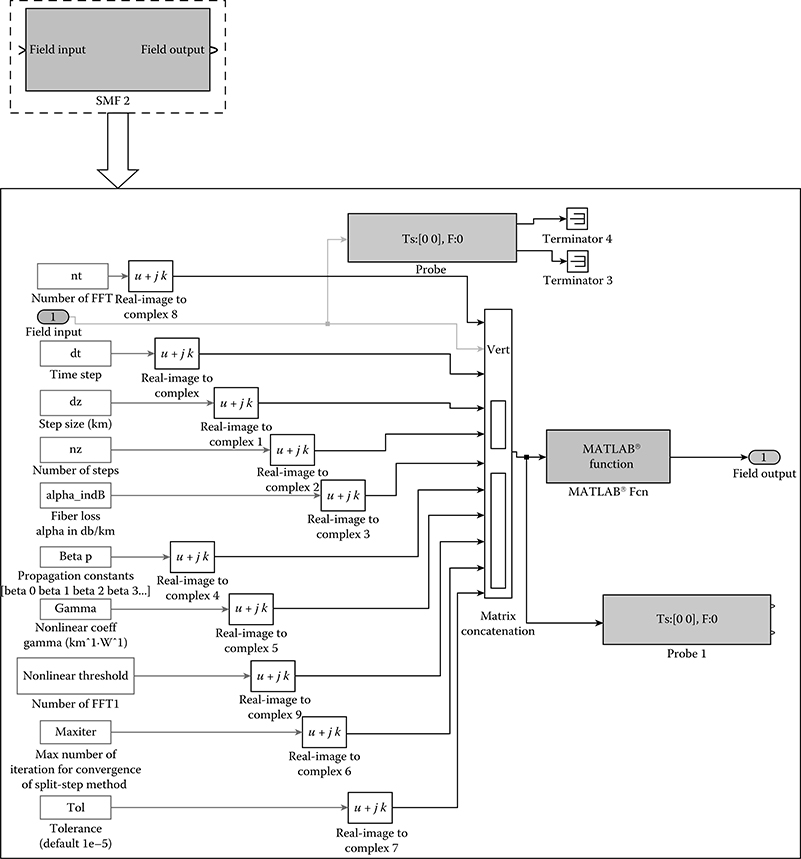
FIGURE 10.19 The SMF models using the SSFM.
10.2 DB Direct Detection Receiver
The receiver model of 40 Gbps DB optical fiber communication system consists of a Gaussian filter and scopes to observe the performance of the system (Figure 10.20). The receiver is a conventional direct detection type. Therefore, a demodulator or decoder is not needed. Power spectrum and eye diagram can be observed directly from this point. The Gaussian filter functions as a baseband filter. The absolute value of the incoming signal is taken because the DB receiver detects the intensity of the signal. The probe is used to determine the sampling time at that point. The “Demodsignals” block shown collects all the data at this point and saves it in the workspace. This data are used to plot the histogram, which is used to determine the Q factor and BER of the system.
Demodulation is needed at the receiver, depending on the modulation format used. For instance, the DPSK receiver consists of a Mach–Zehnder delay interferometer (MZDI), which demodulates the incoming signal before detecting it using a photodetector. MZDI lets two adjacent bits interfere with each other at its output port. This interference creates the presence, or absence, of power at the output port, depending on whether the interference is constructive or destructive with each other. The preceding bit in the DPSK signal acts as a phase reference for demodulating the current bit. The DI output ports are detected by the balanced detectors. The optical DB signals can be demodulated into a binary signal with an optical receiver of conventional direct detection type, as shown in Figure 10.21. A decoder is not required in this case. The received signal is directly detected by a photodiode operating as a square law detector. The optical DB signal consists of two states, “on” and “off.” The photodiode works by detecting the incoming intensity of the signal. The recovery of the original electrical signal can be done by simply inverting the signal detected at the photodiode. This inversion is done within the circuit shown as the decision circuit in Figure 10.20.
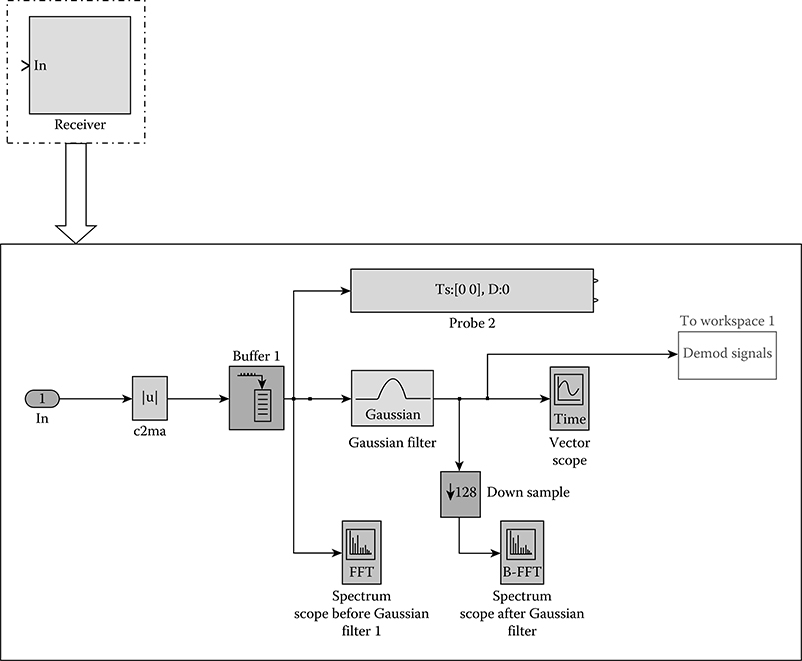
FIGURE 10.20 Direct detection optical receiver of the 40 Gbps duobinary optical fiber communication system.
The signal is observed at this point of the system. The most commonly used parameters to test and observe the performance of a system are the power spectrum, eye diagram, Q factor, BER, and the received optical power. The Q factor is the quality factor of the system, under the Gaussian noise distribution. It is determined by the mean voltage level and the standard deviation of the noise.
where μ1 is the mean voltage level of the “1” received, μ0 is the mean voltage level of “0” received, σ1 is the standard deviation of noise of the “1” received, and σ0 is the standard deviation of the noise of the “0” received.

FIGURE 10.21 The receiver of the 40 Gbps DB photonic transmission system. 40 Gbps DB transmission Simulink® model.
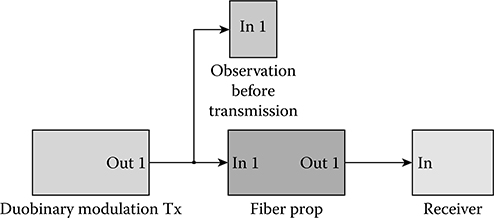
FIGURE 10.22 40 Gbps duobinary optical fiber communication system (Simulink® model).
The 40 Gbps DB optical fiber communication system can be implemented on the Simulink platform. Simulink has been chosen as the computer software for this development of the model because it consists of a variety of communication blocks that can assist in simplifying the process of implementing and improving this model. Figure 10.22 shows the overall system of the 40 Gbps DB optical fiber communication system. The main modules of this communication system are the DB transmitter, named as the DBM Tx, the fiber propagation, and the receiver. The DB transmitter, in general, consists of the DB encoder and the MZIM. The fiber propagation block introduces the linear and nonlinear dispersion effect that exists over the entire length of the optical fiber to the signal. The receiver is of direct detection type. Therefore, the output at the receiver is directly observed using scope, in the form of eye diagrams and power spectrum.
10.3 System Transmission and Performance
The overall performance of this 40 Gbps DB optical fiber communication system can be observed at the receiver of the system. The eye diagram and power spectrum are the parameters that are used to observe the performance of the system. Multiple debugging and testing processes have to be carried out to prove that the system is functioning as expected. Simulation using Simulink has vastly reduced the time and difficulties involved in these processes.
The first step of testing involved the testing of the transmitter. It is important to ensure that the DB optical signal is generated at the output of the transmitter. The DB encoder is critical in this case. Its output is checked using the time scope to ensure that the three-level electrical signal is produced. Power spectrum and eye diagram are connected at the output of the transmitter. These obtained results are compared with those obtained experimentally and theoretically to verify that the DB transmitter is generating the correct signals. A fiber propagation model is then connected to the output of the transmitter. The fiber propagation model will introduce the linear and nonlinear effects of fiber, depending on the distance the signal travels. The DB receiver, which is of conventional direct detection type, is connected after the fiber propagation. The signal is observed directly at the receiver. By observing the eye diagram at this point, the distance that the signal can propagate without severe distortion can be estimated. The testing is started with a fiber length of 1 km. The distance is increased until the point when significant distortion to the eye diagram can be observed, and the “eye” of the eye diagram has closed.
10.3.1 DB Encoder
The DB encoder is the first implemented model in this 40 Gbps DB optical fiber communication system for the generation of three-level DB electrical signals. Scopes are probing at various points of the DB encoder, as shown in Figure 10.14. All time scopes are set to the same range to allow for comparisons of the bits within the same range. The temporal sequences at the outputs of the encoder for driving the MZIM are shown in Figure 10.23. Scope 1 shows the data generated by the Bernoulli binary generator. Scopes 2–4 show the output at each arm. A bit “0” is encoded as “+2” or “−2,” while the bit “1” is encoded as 0. This agrees with the DB coding scheme. They also show a three-level electrical signal. Scope 4 is the inverted version of scope, as expected, due to the NOT gate applied to the second arm.
10.3.2 Transmitter
The transmitter includes the DB encoder and MZIM. After the output of the DB encoder is verified and checked to produce the correct signal, the levels of the signal are represented with a phase. This phase is used to shift the laser source, produced by the sine wave function. The testing of the implemented DB transmitter includes observing the eye diagram and power spectrum at the output. Time scopes are attached at various points of the transmitter to observe the signal at these points. Spectrum scopes are connected at the output of the transmitter, which is after the summation of both arms of MZIM and to each arm of the MZIM to observe the power spectrum at these arms. Some adjustments need to be made to the transmitter model in order to observe the power spectrum. The sine wave function is set to produce a wave of 200 GHz, rather than 193 THz. This is to enable the observation of the spectrum centered at a lower frequency, and better spectral resolution. The zero-order hold that functions to hold and sample the incoming signal is set to 1e−12, so that the x-axis of the spectrum scope is in the THz range. The obtained results, as shown in Figure 10.24, reflect the results expected from experiments and theories. The power spectrum for a 5 Gbps DB optical fiber communication system is shown in Figure 10.25a [6]. This is used to verify the power spectrum obtained from the Simulink model. Spectrum (c) of Figure 10.26 corresponds to the Spectrum Scope in Figure 10.18. The obtained spectrum reflects on that in Figure 10.24a, with the shape approximately the same. The bandwidth of the obtained spectrum corresponds to the data rate, as in Figure 10.25a. The spectrums obtained are centered at 200 GHz, which is the carrier frequency of the model. Spectrum (c) is carrier suppressed, while the other two spectrums are not. This is as expected from the DBM format. Due to the π-phase difference in the two arms of MZIM, the output is expected to have its carrier suppressed.
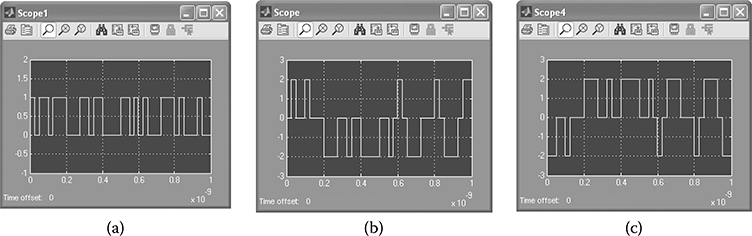
FIGURE 10.23 DB encoder outputs: (a) Bernoulli binary sequence, and (b, c) DB electrical sequences for driving the electrodes of the MZIM.
Further verification of the DB transmitter Simulink model is carried out by monitoring the eye diagram at the output of the transmitter. The observation prior to the transmission block in the overall system, shown in Figure 10.27, is used to observe the eye diagram before transmission into the fiber. The eye diagram obtained, as shown in Figure 10.28, has an “open eye” with an amplitude of 0.6. It reflects the one in Figure 10.25. For a range of 100 ps, four “eyes” are obtained, giving one “eye” 25 ps. This proves that the eye diagram is correct, since the data rate is 40 Gbps, which equals 1 bit every 25 ps.
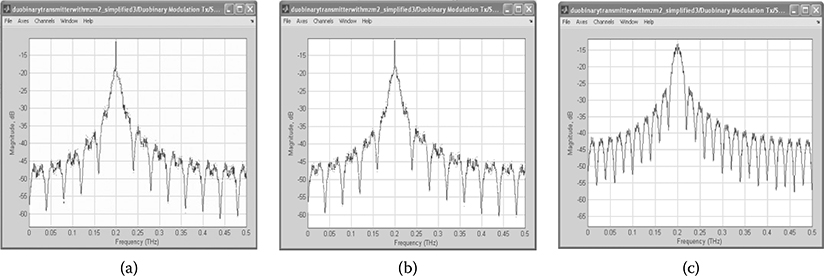
FIGURE 10.24 (a, b) Power spectrum obtained from each arm of the MZIM and (c) the output of duobinary transmitter.
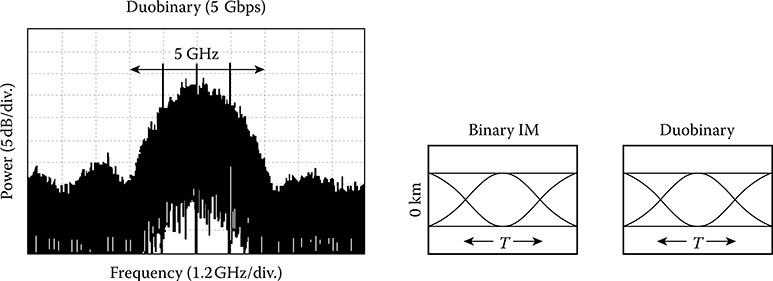
FIGURE 10.25 DB power spectrum and eye diagram for 5 Gbps duobinary optical fiber communication system. (Extracted from T. Franck et al., IEEE Photon. Technol. Lett., Vol. 10, No. 4, pp. 597–599, 1998.)
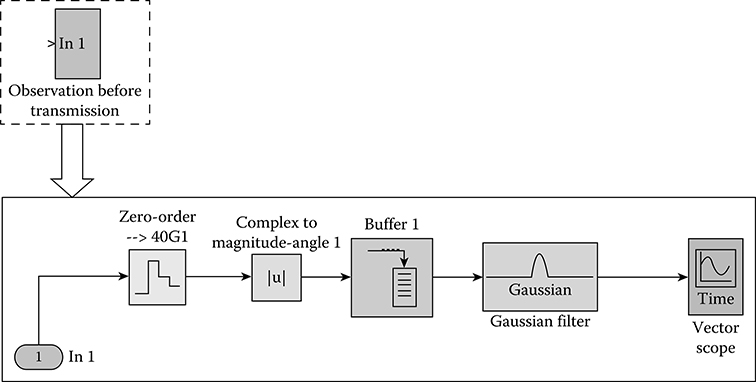
FIGURE 10.26 Signal and eye diagram monitored before the transmission block of the 40 Gbps duobinary optical fiber communication system.
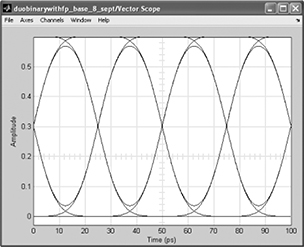
FIGURE 10.27 Eye diagram obtained before propagation block.
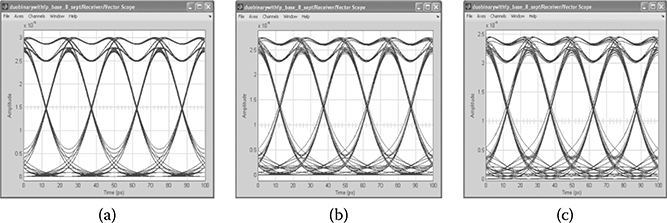
FIGURE 10.28 Duobinary eye diagram for (a) 1 km, (b) 5 km, and (c) 10 km.
10.3.3 Transmission Performance
The overall performance is observed at the receiver of the 40 Gbps DB optical fiber communication system. The eye diagram and power spectrum are observed by the spectrum scope and vector scope attached inside the receiver. Eye diagrams show the distortion and attenuation of signals at various lengths of the fiber. When the “eye” of the eye diagram closes, the signal is severely distorted and dispersed, and, thus, recovering of the signal will be impossible. The eye diagram can also be used to calculate the received optical power. The Q factor and BER can be obtained by plotting the histogram of the received signal, followed by some calculations to obtain the mean voltage level and the standard deviation of noise.
The eye diagrams of various lengths of the fiber are obtained. It can be observed from Figures 10.28, 10.29 and 10.30 that, as the length of the fiber increases, so do the dispersion and noise. The “eye” of the eye diagram closes eventually. DB signals are expected to be able to travel up to 200 km without the “eye” closing completely. This has been proved by the model. It can be observed that, at the length of 250 km, as shown in Figure 10.30b, the “eye” of the eye diagram is yet to be fully closed. Dispersion effects can be observed, and they progressively increase with the distance of the fiber.
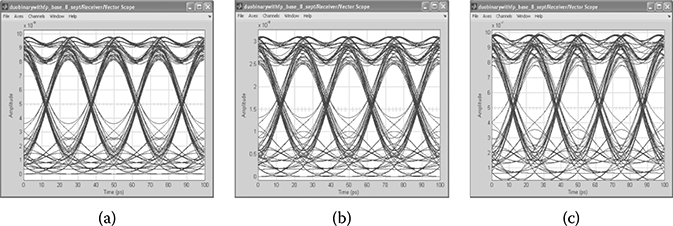
FIGURE 10.29 Duobinary eye diagram for (a) 50 km, (b) 100 km, and (c) 150 km.
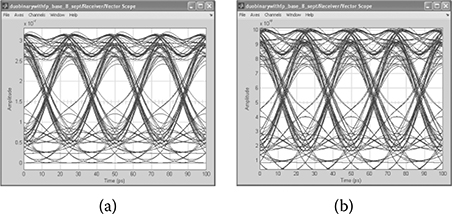
FIGURE 10.30 Duobinary eye diagram for (a) 100 km and (b) 150 km.
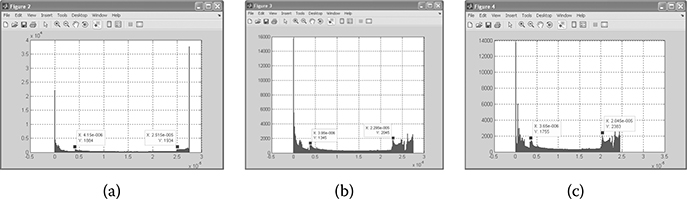
FIGURE 10.31 The histogram obtained from data demod signals for (a) 1 km, (b) 5 km and (c) 10 km.
Data obtained from the demodsignals block, shown in Figure 10.31, are used to plot the histogram that determines the Q factor and BER. Q factor is the quality factor of the system. From the Q factor, the BER can be calculated. It is expected that, for a BER of 10−9, the Q factor is approximately 6. The histograms for 1 and 10 km are shown in Figure 10.32. The two points on the histogram are compared with the histogram at the receiver to obtain the mean value, μ0 and μ1, and the standard deviation of noise, σ0, and the BER, or bit error rate, can be calculated from the Q factor found. Figure 10.32 shows the plot of BER versus distance. It can be observed that, as the distance of propagation of the signal increases, so does the bit error rate. This is as expected, since the linear and nonlinear effects of the fiber introduce noise and errors to the transmitting signal. Figure 10.33 is the plot of BER versus receiver sensitivity. The BER is plotted against the receiver sensitivity for the range from −23 dBm to −20 dBm. Experimental results of the transmissions of the CSRZ-ASK and RZ-ASK formats are also included for system over 328 km SSMF and DCM modules, completely dispersion compensated with five EDFA modules integrated.
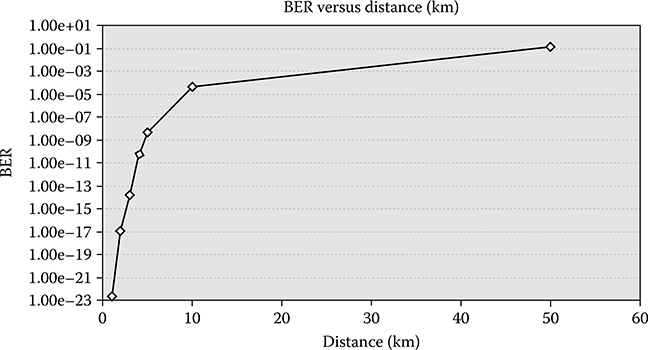
FIGURE 10.32 Plot of BER versus distance (km) of SSMF.
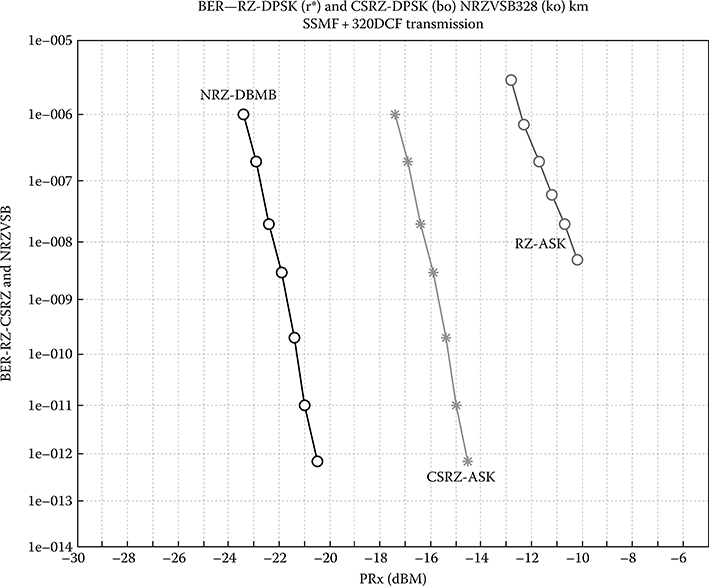
FIGURE 10.33 BER versus receiver sensitivity (dBm) of simulated NRZ-DBM (black o), and experimental CSRZ-ASK, RZ-ASK for transmission system of 328 km of dispersion-compensated optically amplified SSMF spans.
10.3.4 Alternating-Phase and Variable-Pulse-Width DB: Experimental Setup and Transmission Performance
10.3.4.1 Transmission Setup
A transmission system is arranged as shown in Figure 10.34a, consisting of 50 km of SSMF and the associated compensating module; a DPSK transmitter (SHF-5300); optical booster and preamplifiers; wavelength multiplexer and demultiplexer; an MZDI; an optical balanced receiver SHF-5008; a clock recovery module; and an error analyzer SHF-EA 44A. A typical eye diagram obtained for 40 Gbps CSRZ-DPSK modulation format recovered after transmission is shown in Figure 10.34b. This test bed is also used to investigate the transmission of DWDM channels of various modulation formats. Hence, the wavelength mux and demux are included here. The BER versus the receiver sensitivity for the CSRZ-DPSK is shown in Figure 10.35. The curves for DB modulation with alternating phase of the “1” intensity coded pulses are also obtained by simulation, as given in the next section.
DB optical transmission can be experimentally determined via a simulation whose platform can be implemented on MATLAB and Simulink for several modulation formats, especially the phase-modulated optical transmission. A typical system arrangement of optical transmitter using a dual-drive MZIM for generation of DPSK and alternating-phase DB modulation for simulation is shown in Figure 10.36. The fiber propagation model follows the well-known split-step Fourier method, with provisions for switching between linear and nonlinear power level propagation, so as to minimize the computing time.
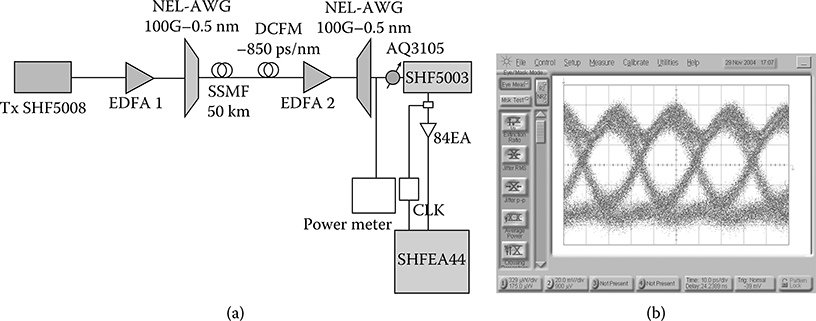
FIGURE 10.34 System test bed for CSRZ-DPSK transmission over 50 km SSMF, balanced receiver
The FWHM of the DB modulation format can be generated by setting the amplitude of the swing voltage levels applied to the dual electrodes of the MZIM. The biasing condition of the MZIM can be varied between the minimum and maximum transmission and the quadrature points of the transfer characteristics of the modulator to obtain carrier suppression and alternating-phase properties of the modulated lightwaves. RZ formats and suppression of the carrier can also be generated by using another dual-drive MZIM biased at minimum transmission and a half-bit-rate frequency synthesizer. Our Simulink models have been extensively tested, and the system performance agrees well between experiments and modeling. Figure 10.35 shows the agreement between the BER versus the receiver sensitivity for CSRZ-DPSK modulation format, obtained both in experiment and by simulation. Noises of optical amplifiers have also been taken into account in both cases. We select the CSRZDPSK format to compare with alternating-phase DB modulation because it has been proven in practice to offer superior performance as compared with RZ-DPSK and NRZ-DPSK. The MZIM is modulated and biased, such that the width of the DB-modulated pulses can be altered with ease.
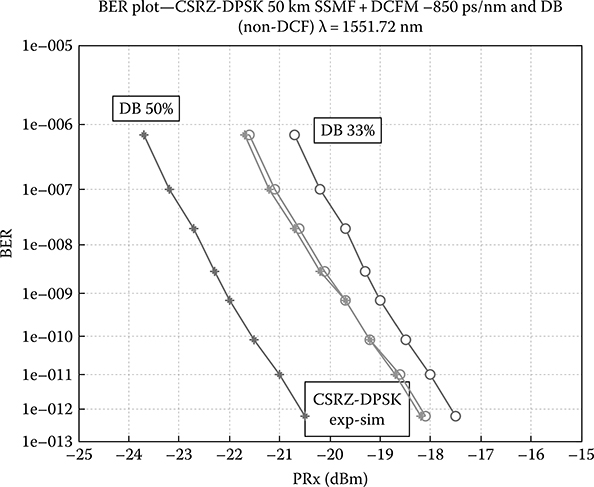
FIGURE 10.35 BER versus receiver sensitivity for 50 km transmission: CSRZ-DPSK transmission with complete compensation (dark gray curve) and 50 and 33% FWHM alternating phase DB modulation (light gray curves).
Simulation results are obtained for alternating-phase DB with an FWHM of 50% and 33% of the bit period for 40 Gbps, as shown by the light gray curves in Figure 10.35. An optical Gaussian filter type is also used at the output of the transmitter prior to transmission. We observe almost 2 dB better receiver sensitivity of the 50% FWHM alternating-phase DB formats as compared to the CSRZ-DPSK. However, the 33% FWHM DB case proves to be 1 dB less sensitive. This indicates the effectiveness of the DBM. It is noted again that the 50 km SSMF without compensation is used for 40 Gbps DB transmission. A typical eye diagram obtained at the output of the balanced receiver for 33% FWHM DB is shown in Figure 10.36b. The simulation is conducted with 256 random bit patterns and several frames sufficient for measurement of the Q factor without resorting to the Monte Carlo technique. We also assume a Gaussian distribution of the ISI and phase noises. This assumption may have suffered 0.5–1 dB penalty as compared with the chi-square distribution for phase error in DPSK transmission [16,17].
The DBM with alternating phase and control of the FWHM of the pulse sequence offer 2 dB improvement as compared to that of CSRZ-DPSK. The 50% FWHM with a Gaussian profile allows the possibility of lower bandwidth demand on the optical modulators [2]. Still, this format offers better performance due to the reduction of the signal bandwidth.
10.3.4.2 Test Bed for Variable-Pulse-Width Alternating-Phase DBM Optical Transmission
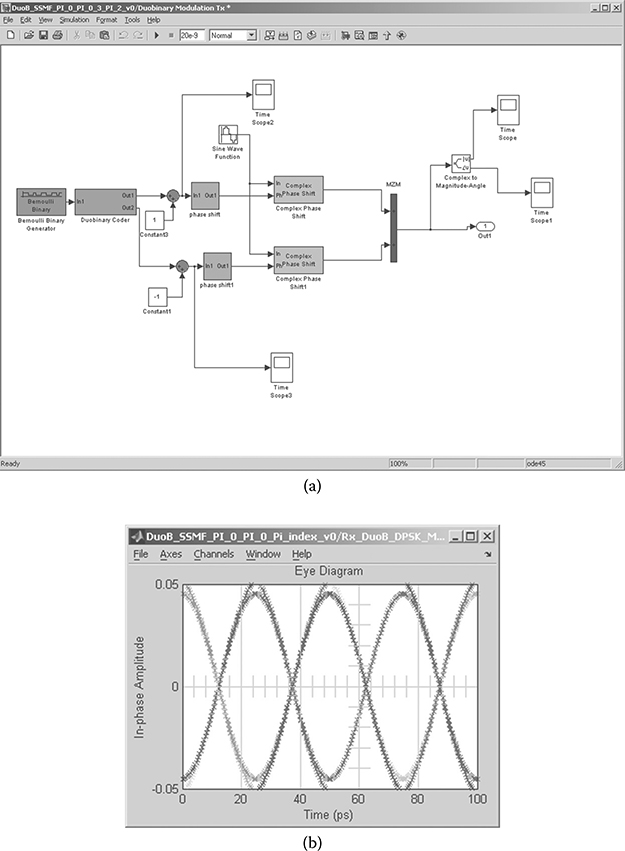
FIGURE 10.36 (a) Optical transmitter Simulink® model for generation of alternating-phase duobinary modulation format and (b) nondispersion-compensating balanced received eye diagram for DB 33% FWHM.
In this section, we investigate the transmission performance of alternating-phase DBM of an FWHM ratio with respect to the bit period of 100%, 50%, and 33%, and compare with experimental transmission of carrier-suppressed DPSK over 50 km of standard single-mode fiber (SSMF) and ispersion compensation. For the DB case, the transmission without dispersion compensation over the same SSMF length offers better performance for 50% FWHM DB modulation and slightly poorer performance for 33%. The transmission performance, the BER versus receiver sensitivity, of these DB modulation formats are compared with the carrier-suppressed DPSK experimental transmission.
These transmission performances are compared with the noncompensating 50 km SSMF transmission of DBM with pulse widths of 33% and 50%. The later format offers at least 2 dB improvement in terms of the BER and receiver sensitivity over that of CSRZ-DPSK. The 50% and 33% FWHM DB modulation schemes offer simpler driving circuitry for the optical modulators due to its lower swing voltage levels applied to the electrodes of the dual-drive interferometric modulator. This is very important when the bit rate is in the multi-GHz region. Furthermore, the 50% and 33% pulse width and Gaussian profile will further reduce the demand on the bandwidth of optical modulators—that is, a 30 GHz or lower transmittance bandwidth can be used. A Simulink model has also been developed for simulation of the transmission performance of the DBM formats. Simple driving conditions can be achieved, and its effectiveness demonstrated.
We describe a generic simulation platform on MATLAB and Simulink for several modulation formats, especially the phase-modulated and partial-response optical transmission as shown in Figure 10.37. It consists of two DB transmitters, a fiber transmission model, and a direct detection optoelectronic receiver. A typical system arrangement of optical transmitter using a dual-drive Mach–Zehnder interferometric modulator for the generation of DPSK and alternating-phase DB modulation for simulation is shown in Figures 10.38 and 10.39. The fiber propagation model follows the well-known split-step Fourier method with provision for switching between linear and nonlinear power level propagation so as to minimize the computing time.
The pulse FWHM of the DB modulation format can be generated by setting the amplitude of the swing voltage levels applied to the dual electrodes of the MZIM. The biasing condition of the MZIM can be varied between minimum and maximum transmission and the quadrature points of the transfer characteristics of the modulator to obtain carrier suppression and alternating-phase properties of the modulated lightwaves. RZ formats and suppression of the carrier can also be generated by using another dual-drive MZIM biased at minimum transmission points of both sides of the voltage-optical intensity transfer curve of MZIM. This is the pulse carver that would be required to generate variable-pulse-width optical “clock pulses” before feeding into the data modulator (Figures 10.40, 10.41 and 10.42).
We note also that half-bit-rate frequency synthesizer is used as a driving source applied to the two electrodes for generation of RZ periodic pulse sequence. The optical spectrum of a lightwave of 50% RZ DB modulated signals, as shown in Figure 10.43, confirms the estimation of the modulation technique.
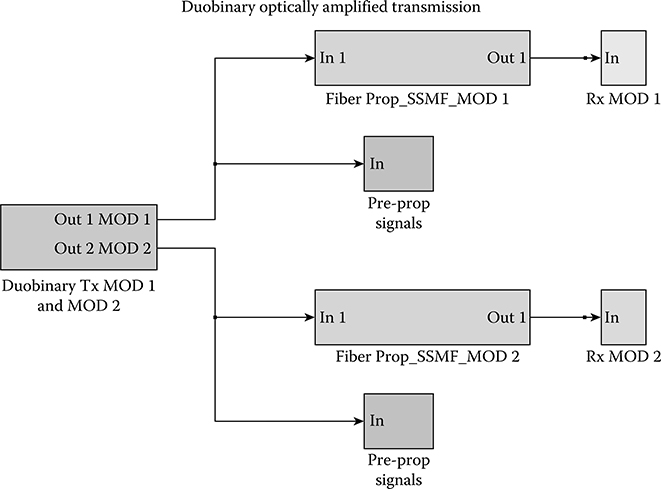
FIGURE 10.37 Generic simulation model for duobinary variable-pulse-width transmission. The transmitter is shown in the far left, consisting of two subsystem transmitters—one is the NRZ duobinary, and the other a different variable-pulse-width duobinary format for comparison. Each span consists of a transmission fiber (SSMF) in association with a dispersion-compensating fiber and two in-line amplifiers (see Figure 10.41). Cascaded spans are identical with 100 km SSMF and 100 km DCF (negative dispersion factor and matched slope) and 20 dB gain plus 5 dB NF EDFAs.
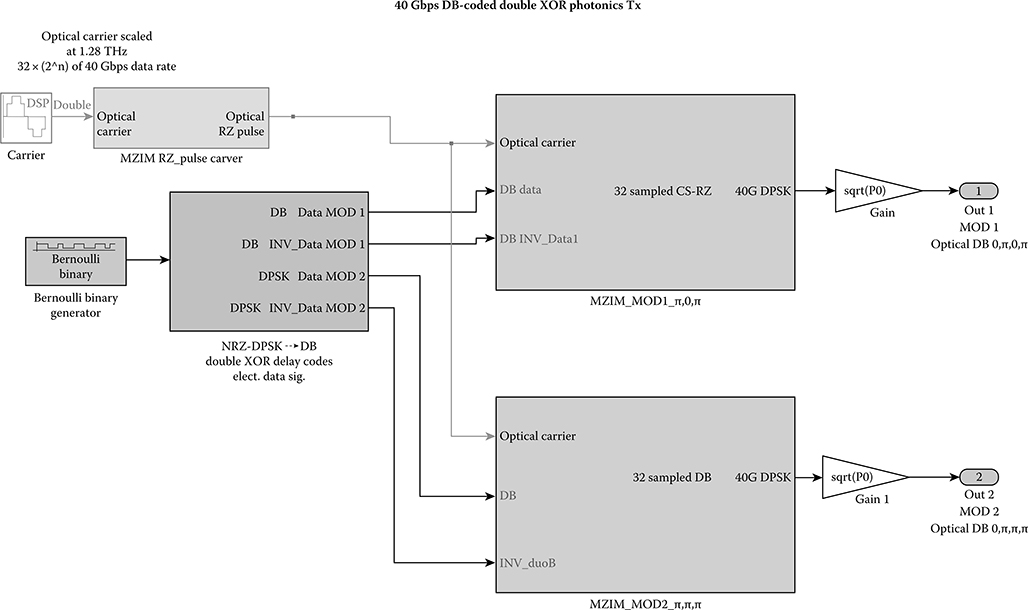
FIGURE 10.38 MATLAB® and Simulink® model showing the pulse carver or optical “clock sources” and the data dual-drive MZIM for generating of variable-pulse-width RZ-DB optical transmitter.
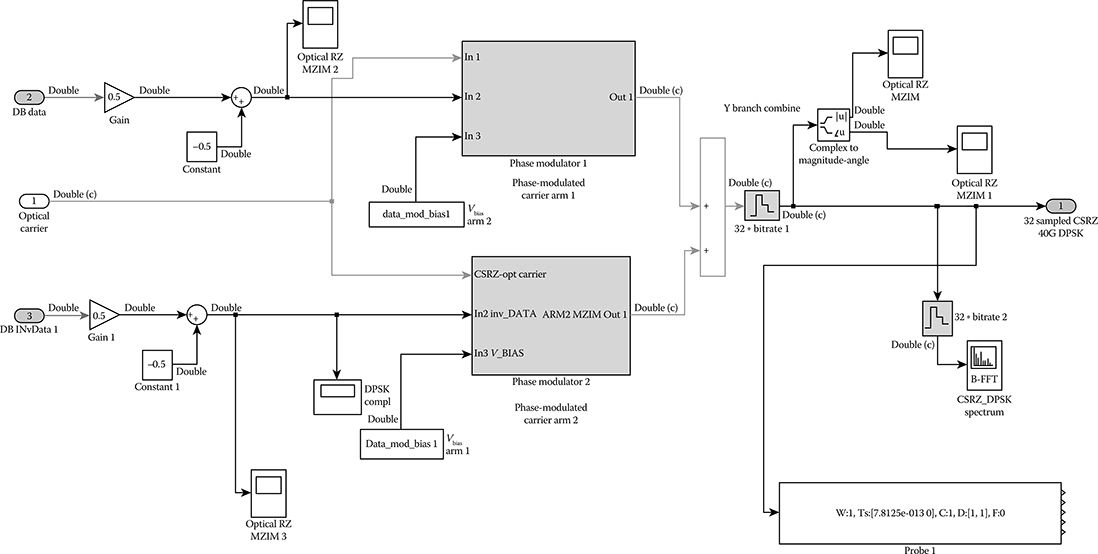
FIGURE 10.39 Electrical filter inserted before modulating the data optical modulator. Electrical filter can be Gaussian or raised-cosine type, or a Bessel filter of the fifth order can be inserted to reduce the required transmitting signal bandwidth.
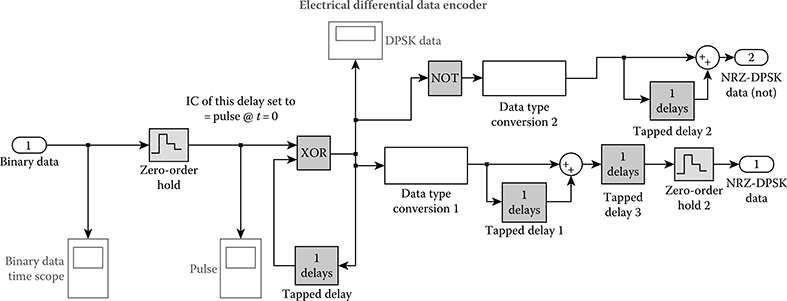
FIGURE 10.40 Simulink® simulation model of the data encoder for duobinary format using differential encoding scheme of DPSK. The differential signals can be delayed or nondelayed and then added with its inverted version to generate three-level electrical signals to two-level signals for driving the data modulator electrodes.
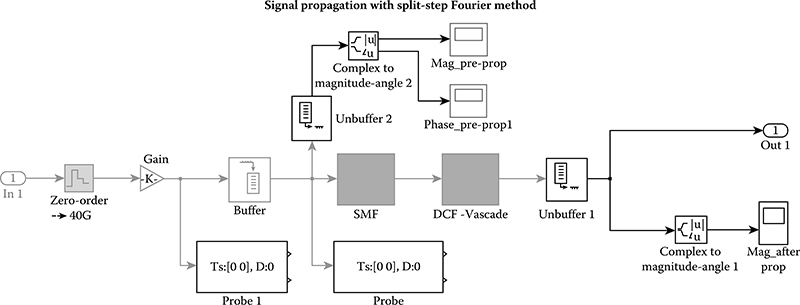
FIGURE 10.41 Simulink® simulation model for the propagation of duobinary modulated carrier over dispersion-compensated transmission link.
The Simulink models have been extensively tested, and the system performance agrees well between experiments and modeling. Later in the chapter, Figure 10.47 shows the agreement between the BER versus the receiver sensitivity for CSRZ-DPSK modulation format obtained both in experiment and by simulation. Noises of optical amplifiers have also been taken into account in both cases. We select CSRZ-DPSK format to compare with alternating-phase DB modulation because it has been proven in practice to offer superior performance as compared with RZ-DPSK and NRZ-DPSK. The MZIM is modulated and biased, such that the width of the DB-modulated pulses can be altered.
Simulation results are obtained for alternating-phase DB with an FWHM of 50% and 33% of the bit period for 40 Gbps, as shown by the light gray curves indicated in Figure 10.47 (see later in the chapter). An optical Gaussian filter type is also used at the output of the transmitter prior to transmission. We observe almost 2 dB better receiver sensitivity of the 50% FWHM alternating-phase DB formats as compared to CSRZ-DPSK [7]. However, the 33% FWHM DB case offers 1 dB less sensitive. A single photodetector can be used to recover DB modulated lightwave signals (Figure 10.44). The simulation is conducted with 256 random bit patterns and several frames sufficient for the measurement of the Q factor without resorting to the Monte Carlo technique. We also assume a Gaussian distribution of the ISI and phase noises. This assumption may have suffered 0.5–1 dB penalty as compared with the chi-square distribution for phase error in DPSK transmission [5].
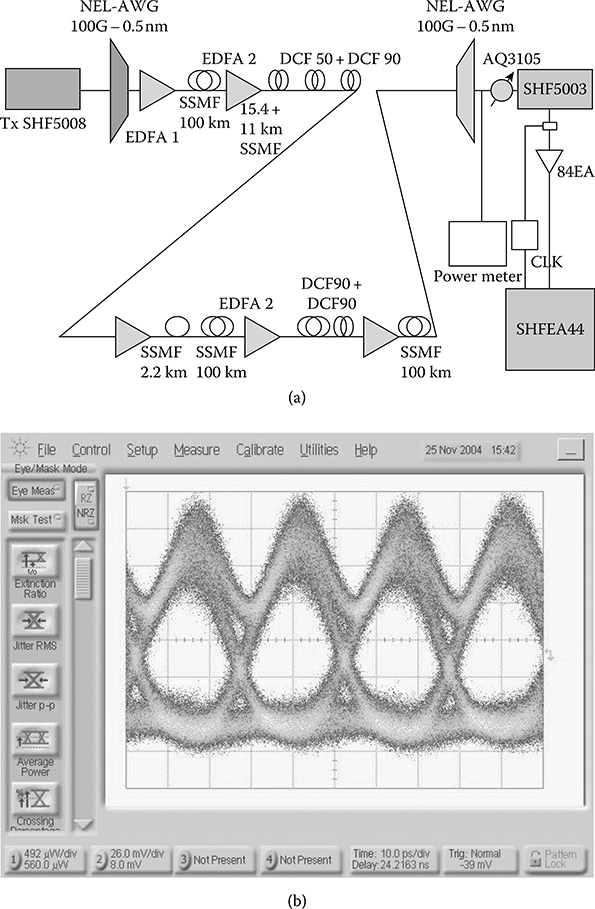
FIGURE 10.42 Experimental and simulated transmission systems: (a) system setup consisting of multispans of total 328 km SSMF plus 320 km DCF and associated optical amplifiers EDFAs, optical receivers employing self-homodyne balanced receiver; modulation formats including CSRZ-DPSK, NRZ-DPSK, and RZ-DPSK and duobinary and (b) received eye diagram of CSRZ-DPSK with 34 ps/nm residual dispersion.
10.3.4.3 CSRZ-DPSK Experimental Transmission Platform and Transmission Performance
A transmission system is arranged as shown in Figure 10.43, consisting of 50 km of SSMF and the associated compensating module; a DPSK transmitter (SHF-5300); optical booster and preamplifiers; wavelength multiplexer and demultiplexer; an MZDI; an optical balanced receiver SHF-5008; a clock recovery module; and an error analyzer SHF-EA 44A. A typical eye diagram obtained for 40 Gbps CSRZ-DPSK modulation format recovered after transmission is shown in Figure 10.44. This test bed is also used to investigate the transmission of DWDM channels of various modulation formats. Hence, the wavelength mux and demux are included here. The BER versus the receiver sensitivity for the CSRZ-DPSK and DB of different RZ pulse width is shown later in the chapter in Figure 10.47. The curves for DB modulation with alternating phase of the “1” intensity coded pulses are also obtained by simulation.
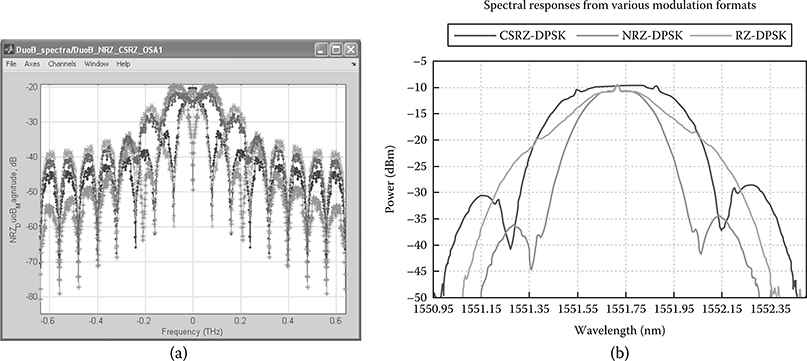
FIGURE 10.43 (a) Optical spectrum as monitored at the output of the 40 Gbps duobinary transmitter with formats NRZ (dotted-black), CSRZ 67% pulse width (gray +), 50% RZ (light gray dot), and RZ 33% (mid gray*). All normalized with respect to the optical carrier, which is set at 192.52 THz; and (b) spectra of CSRZDPSK, NRZ-DPSK, and RZ-DPSK modulation formats obtained by experiment.
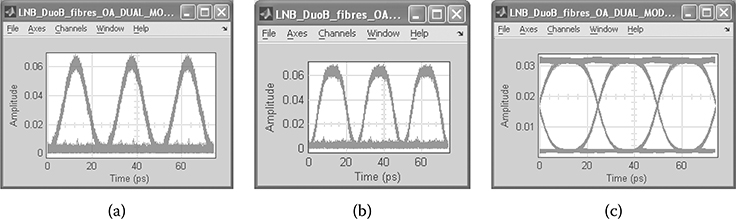
FIGURE 10.44 Received eyes after (three spans) 320 km SSMF fiber fully compensated including two in-line optical amplifiers (20 dB gain and 5 dB noise figure) transmission: (a) DB 33% FWHM and (b, c) 50% duobinary.
The DB simulation setup is structured similar to the experimental setup for DB formats in contrast to CSRZ-DPSK transmission over 320 km SSMF optical fiber transmission multispan links. Although the modulators employed in the SHF-5008 optical transmitter are of single drive, the simulated modulators are of dual-driven type, and the signaling and coding blocks are described in the previous section. The receiver model is simple as direct detection receiver circuitry is used, including a wideband photodetector and microwave amplifier. A Besssel fifth-order or Gaussian (80% or DB signal bandwidth) electrical filter can also be incorporated to minimize the noise contribution.
The optical spectra of DPSK signals under different pulse widths and pulse carver operations are shown in Figure 10.43b, while Figure 10.43a shows the simulation spectra of their counterparts under DB-coded scheme. The spectra are centered at the optical carrier frequency. The gray curve (+) shows clearly the suppression of the carrier, while the other DB schemes show minimum carrier suppression but substantial signal power levels that indicate the specific characteristics of the di-phase modulation, especially when the data modulator is biased such that the phase difference between the two arms of the MZIM is π.
Figure 10.36 shows the simulated eye diagrams at the receiver (after the photodetector including electronic amplifier noises) of the DB-coded sequence of NRZ (c), 50% RZ (b), and 33% RZ (a). Gaussian electrical filtering has been applied to the NRZ DB, and none applied to the other RZ formats of the scheme. No electrical filtering is used at the transmitter. The bit rate is 40 Gbps.
The effects of electrical filtering at the transmitter on the received eye diagrams are shown in Figure 10.45a through d. A 30% bit rate (BT = 0.3) electrical Gaussian filter bandwidth would still sustain the eye opening after 320 km transmission with and without filtering effects (Figure 10.45a and b)—that is, the decision sampling time must be very accurate to be error free even under fully compensated transmission. A 50% BT would be, as observed under simulation, much more tolerable to the sampling error. Figure 10.45c and d shows that such filtering effects would not exist if a raised-cosine electrical filter with a 0.5 roll-off factor for 40 Gbps CSRZ 67% DB format transmission over 320 km consisting of three-spans of optically amplified and fully DC-compensated -SSMF 100 km length.

FIGURE 10.45 Received eyes after (~three spans) 320 km SSMF fiber fully compensated including two in-line optical amplifiers (20 dB gain and 5 dB noise figure) 40 Gbps transmission. (a) CSRZ 67% duobinary with the integration of Gaussian electrical filter with 30% bit rate; (b) same as (a) but without filtering at the receiver; and (c) CSRZ 67% duobinary with raised-cosine filtering at transmitter and (d) no filter at the receiver.
Fully compensated eye diagrams, after transmission over the 320 km optically amplified multispan SSMF transmission link, are shown later in the chapter in Figure 10.47a, and the dispersion tolerance versus the BER is shown in Figure 10.47b. It is observed that the dispersion tolerance is similar for variable-pulse-width DB signals. The 33% and 50% RZ-modified DB formats shown indicate error-free transmission with a residual distance of about 6 km DB format, while we could experimentally obtain error-free status only after 3 km SSMF residual dispersion for CSRZ 67% DPSK format.
Experimentally and under simulation, the launched power is adjusted, and the BER versus receiver sensitivity is obtained later in the chapter in Figure 10.47. Also included in this figure is the performance curve of the CSRZ-DPSK transmission. The BER curves indicate that 50% RZ and 67% NRZ DB formats outperform the CSRZ-DPSK by at least 2 dB. Although these DB performance curves are from simulation, we expect that the comparison with those of experimental CSRZ-DPSK would not be much different, as we have taken into account the electronic noise and the signal-dependent shot noises in the models of the photodetector. In both experimental and modeling cases, it is reasonable to assume that the polarization-mode dispersion effects are negligible. We expect that the 33% RZ DB performance would fall between these two formats. We have not had sufficient time to conduct detailed transmission results for this format, and these results will be reported in the near future.
It is noted that the model exactly represents the photonic behavior of lightwave-modulated modulation formats, that is, the square law direct detection incorporating the equivalent electronic noises of a 40 GHz receiver. Both signal-dependent shot noise and equivalent electronic noise current are modeled. The bandwidth of the receiver is adjusted according to the effective bandwidth of the modulation scheme. This allows us to justify the comparison of practical implementation of the direct detection and balanced receivers. The pulse sequence at the receiver is integrated, and an average power is obtained. Then its equivalent quantum shot noise is calculated over the electronic amplifier bandwidth. The equivalent electronic noise current at the input of the electronic amplifier is then added to these signal-dependent noises, and a signal-to-noise ratio is obtained. Thus, the received optical power can be derived and plotted with respect to the BER obtained from processing the eye diagram obtained after each transmission. The simulation duration is set long enough, so that the number of pulses transmitted and received is sufficiently high. Although we understand that the noise statistics of the phase-modulated optical transmission is asymmetrical and may follow a Maxwellian distribution, it is assumed in this chapter that the noise statistics follow a Gaussian distribution. This assumption would suffer only about 0.5–1.0 dB difference from the true distribution.
The DBM with alternating phase and control of the FWHM of the pulse sequence offer a 5 dB improvement as compared to that of the CSRZ-DPSK obtained experimentally. For the simulated DB 50% pulse format, a 1.2 dB improvement on receiver sensitivity is achieved as compared with CSRZ-DPSK. Equivalent noise current at the receiver of 2.5 pA/(Hz)1/2 is used, which is compatible to that of a commercial 50 GHz DPSK optical receiver. The bandwidth of the receiver is adjusted to be narrower for 67% DB case, and hence less noises for both the quantum-signal-dependent shot noise and total equivalent electronic noise power. The 40 Gbps DB signals in the time domain and its spectrum are shown in Figure 10.46 using a filter of 17 GHz in the transmitter. The 3 dB bandwidth shows clearly the single-sideband and embedded carrier. The 50% FWHM with a Gaussian profile allows the possibility of lower bandwidth demand on the optical modulators [2]. Still, this format offers better performance due to the reduction of the signal bandwidth. All the performance curves shown in Figure 10.47 are obtained when the modulation and carrier power are operating under the linear region, with the nonlinear threshold set at a power that would create a total phase change of 0.1π. A 4.2 dB improvement of 67%, as compared with 50% DB, is due to the reduction of the electronic and quantum shot noise at the receiver.
10.3.5 Remarks
The effectiveness of DBM formats has been demonstrated over the transmission by simulation. MATLAB and Simulink models are employed for this simulation platform. The system performance is error free, with receiver sensitivity of −60 dBm without receiver electronic noise. The nondispersion compensation transmission can reach 9−10 km for 40 Gbps, equivalent to 150 km for 10 Gbps. The Simulink model is successfully developed. We have also demonstrated both experimentally and in modeling the CSRZ-DPSK transmission. These transmission performances are compared with the noncompensating 50 km SSMF transmission of DBM with a pulse width of 33% and 50%. The later format offers at least 2 dB improvement in terms of the BER and receiver sensitivity over that of CSRZ-DPSK. The 50% and 33% FWHM DB modulation schemes offer simpler driving circuitry for the optical modulators due to its lower swing voltage levels applied to the electrodes of the dual-drive MZIM. This is very important when the bit rate is in the multi-GHz region. Furthermore, the 50% and 33% pulse width and Gaussian profile will further reduce the demand on the bandwidth of optical modulators—that is, a 30 GHz or lower MZIM can be used. A Simulink model has also been developed for simulation of the transmission performance of the DBM formats. Simple driving conditions can be achieved, and its effectiveness demonstrated.
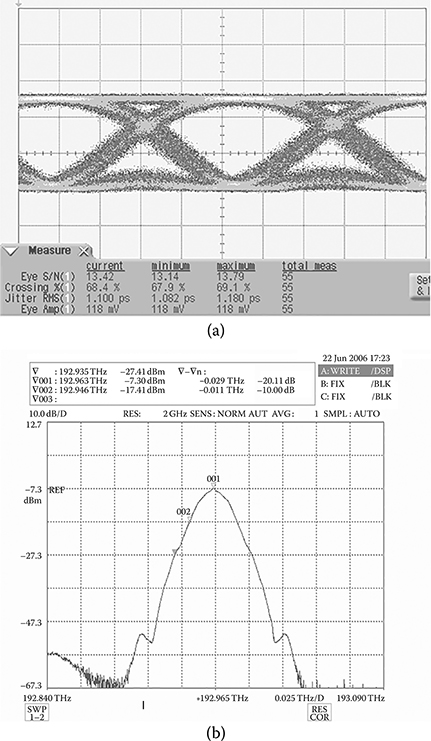
FIGURE 10.46 Duobinary signals: (a) eye diagram and (b) measured optical spectrum. (Courtesy of SHF Ltd., Berlin, Germany.)
We have demonstrated, both experimentally and in modeling, the CSRZ-DPSK and DB transmissions. These transmission performances are compared with noncompensating 50 km SSMF transmission of DBM with pulse width of 50% and 67% (NRZ). The later formats with 50% and 67% pulse width, offer at least 5 dB and 1.2 dB improvement, respectively, in terms of the BER and receiver sensitivity over that of CSRZ-DPSK. The 67%, 50%, and 33% FWHM DB modulation schemes offer simpler driving circuitry for the optical modulators due to its lower swing voltage levels applied to the electrodes of the dual-drive MZIM. Simpler and narrower bandwidth of the electronic amplifier for 67% DB case would also improve the receiver sensitivity. We thus expect that 33% DB would worst than the case of CSRZ-DPSK, and hence no simulation is conducted for this scenario. This is very important when the bit rate is in the multi-GHz region. Furthermore, the 67% and 50% pulse widths and Gaussian profile will further reduce the demand on the bandwidth of optical modulators—that is, a 30 GHz or lower MZIM can be used. Simulink models have also been developed for simulation of the transmission performance of the DBM formats. The balanced receivers are modeled exactly as a real practical subsystem. This allows a fair comparison with the transmission performance of the CSRZ-DPSK formats. Simple driving conditions can be achieved, and its effectiveness demonstrated.
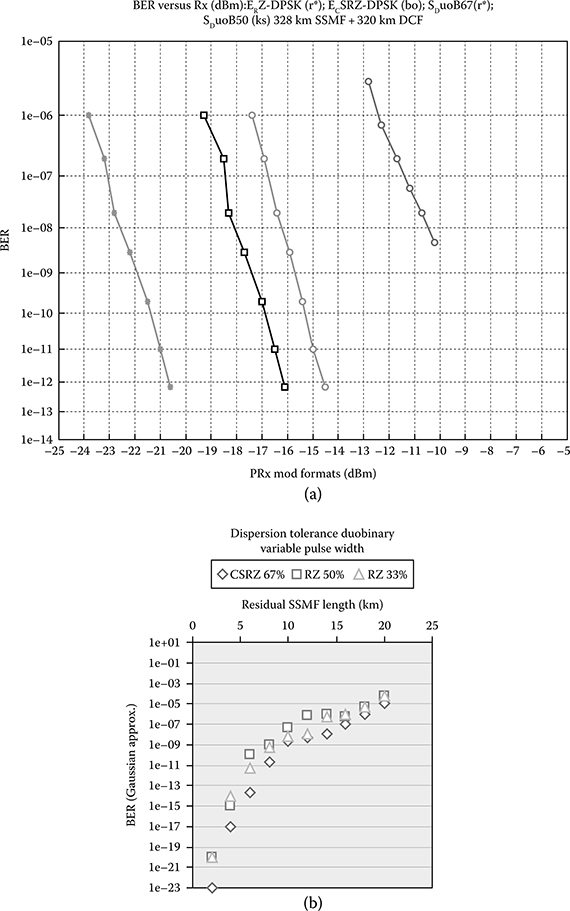
FIGURE 10.47 (a) BER versus receiver power for 320 km SSMF and 320 km (effective negative 320 km SSMF) DCF transmission: “o” middle curve: experimental CSRZ-DPSK transmission with complete compensation; “o” far right: experimental RZ-DPSK; “*” curve: simulated duobinary 67%; “▢” square curve: simulated duobinary 50% FWHM alternating phase modulation. Note: 67% improves over 50% duobinary by 4.2 dB. (b) Simulated dispersion tolerance for 40 Gbps duobinary 67% (diamond) and 50% (square) and 33% (triangular) FWHM-BER versus residual equivalent-SSMF length. Launched power 0 dBm at the output of transmitter and input to the fiber transmission line.
Although we have not conducted the transmission of DB format pulse sequences of variable pulse width over the multispan optically amplified distance in the power threshold region at which the self-phase modulation effects may occur. It is expected that the CSRZ 67%, RZ 33%, and RZ 50% DB format would outperform their DPSK counterparts. It is also expected that the RZ 33% DB would suffer much less nonlinear distortion effects than its 50% and 67% RZ counterparts. These performances will be reported in the future. Similarly, the effects of the electrical filtering at the transmitter will also be investigated.
10.4 DWDM VSB Modulation-Format Optical transmission
This section presents the transmission of optical multiplexed channels of 40 Gbps using vestigial single-sideband modulation format over a long-reach optical fiber transmission system. The effects on the Q factor of fiber dispersion, the passband and roll-ff frequency of the OFs, and the channel spacing are described. The performance of the optical transmission using low and nonzero-dispersion fibers or/and dispersion compensation is presented. It has been demonstrated that a BER of 10−12 or better can be achieved across all channels, and that minimum degradation of the channels can be obtained under this modulation format. OFs are designed with asymmetric roll-off bands. Simulations of the transmission system are also given and compared for channel spacing of 20, 30, and 40 GHz. It is shown that the passband of 28 GHz and 20 dB cutoff band performs best for 40 GHz channel spacing.
Even though optical communications have been extensively developed for ultra-high-capacity transport networks, the demand for high-speed communication systems over ultra-long-reach and ultra-long-haul offering greater capacity is expected to offer challenges for further technical development for bandwidth-efficient networking. The global Internet traffic has been growing rapidly, typically doubling the backbone traffic each year. This drives a requirement for higher channel speeds per Internet port. As Internet backbone routers are currently moving to 40 Gbps, 100 Gbps and even higher in the Tbps with flexible spectrum as the core long-haul networks. It is foreseen that if the information economy continues its growth unabated, then efficient transmission techniques for increasing the bit rates may be required in the near future.
The most common modulation formats for 40 Gbps optical systems are RZ, NRZ, and CSRZ, which can also be integrated with differential PSK coding [18, 19, 20, 21 and 22]. The vestigial sideband (VSB) RZ modulation format can also be considered as the appropriate choice for Tbps long-haul optical transmission systems due to its half-band property, and hence are highly tolerant to dispersion and nonlinearity. On the contrary, VSB with NRZ could provide higher spectral efficiency than the VSB-RZ format since NRZ occupies only half of the RZ bandwidth and requires a lower peak transmit power in order to maintain the same energy per bit. This would offer the same BER as the RZ format.
This chapter/section gives a numerical simulation of the VSB-NRZ modulation format for long-haul optical fiber transmission systems and the effects of the OFs on its transmission performance. The OFs used for eliminating the unwanted optical sideband are critical in the generation of the desired format. The design of such filters is given so as to alter the passbands and roll-off bands of the filters to investigate their effects on the transmission system performance. Furthermore, the channel spacing of the multiplexed channels is also important and plays a major factor in the specification of OFs. Simulation is presented for eight channels DWDM of 40 GHz channel spacing optical fiber transmission systems. The channels are transmitted at 40 Gbps over a dispersion-managed 100 km span. The effects of these filters on back-to-back transmission and dispersion tolerance are the principal objectives of this work.
This section is thus structured as follows. Section 10.4.2 gives an overview of the simulation design and the transmission system. Sections 10.2.3 and 10.2.4 describe the optical transmitter and modulation format coding. The properties of the OF passband and the signal spectra of the VSB channels are also given. Section 10.4.5 presents the details of the design of the VSB filters and the DWDM, multiplexing, and demultiplexing. Section 10.2.6 discusses the roles of the group velocity dispersion (GVD) factor of the transmission and DCFs. Section 10.2.7 gives the evaluation of the transmission performance using the received eye diagram and the Q factor and the effects of several factors on the BER. Finally, concluding remarks are given.
10.4.1 Transmission System
The schematic diagram of the optical transmission employing the VSB modulation format is shown in Figure 10.48. An optical source operating in the continuous mode is launched into an external optical modulator that is modulating the lightwave carrier via a random bit pattern generator and associate microwave power amplifiers. The external modulator, an X-cut LiNbO3 MZ intensity modulator, is used to offer chirp-free modulated output. For 40 Gbps, the stabilization and linearity of the external modulator is critical. Normally, two modulators would be used, one for generating the required NRZ format, and the other for either carrier suppression or phase modulation, if required, depending on the transmission format.
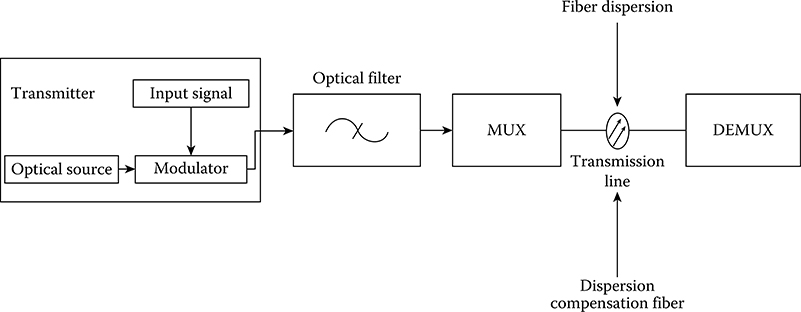
FIGURE 10.48 Schematic of the modeled VSB transmission system.
NRZ data format are used in this simulation. The VSB modulation technique is used and generated by the use of an OF that filters the unwanted sideband of the information channel. After the filtering, a number of optical VSB channels can be multiplexed and then transmitted through a number of optically amplified dispersion-managed fiber spans. Each optically amplified dispersion-compensating in-line unit would consist of an in-line optical amplifier followed by a dispersion-compensating module, and then another optical amplification booster that would then enhance the total average optical power for transmission to the next span. Eye diagrams are obtained, and the BER can be deduced. For example, the back-to-back eye diagram is observed when dispersion compensation fibers are used with appropriate dispersion slope for equalization. Naturally, at the end of the transmission line, the multiplexed channels are separated via a demultiplexer. The principal objective of this chapter is to study the effects of the OF on the VSB system performance, and thus we do not include optical amplification noises in our modeling in the preamplifiers and booster amplifiers located at each transmission span. Both RZ and NRZ formats can be used. The main advantage of the NRZ format is that it occupies half of the RZ format’s bandwidth. VSB modulation allows a small amount of the unwanted sideband existing at the output of the modulator. This depends on the roll of passband of the filter. Instead of eliminating the entire second sideband, such as in the case of SSB, the VSB modulation suppresses most of, but not completely, the second sideband. Using this technique, the difficulty in generating a very sharp cutoff can be overcome. The VSB modulation can be implemented with OFs to eliminate most of the second sideband. The spectrum of a VSB signal can be obtained as [23]
where E is the magnitude of the optical field envelope, ωc is the optical carrier radial frequency, and ω1 and ω2 are the arbitrary radial frequencies of the signals. The signal can be demodulated by multiplying with 4cos(ωct) and applying the low-pass OF, leading to
The basic characteristics of a VSB OF is illustrated in Figure 10.49. We note that the roll-off bands and passbands are asymmetric.
10.4.2 VSB Filtering and DWDM Channels
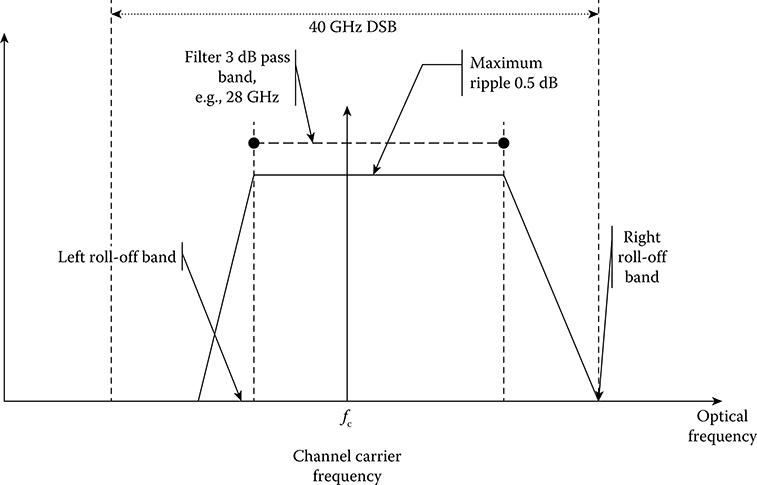
FIGURE 10.49 Spectral property of the VSB modulation format as compared to that of DSB (double sideband): and details of optical VSB filter passbands and roll-off bands.
To achieve the VSB-modulation-formatted signals, OF is implemented. In this chapter, a number of low-pass elliptic filters (LPEF) are chosen because this filter type offers the steepest transition region between the passband and stopband without stability problems. The elliptic filter is a combination of the Chebyshev Type I and Chebyshev Type II, and exhibit some amplitude response ripples in the passband and stopband. The main advantage of the elliptic filter is that the width of the transition band is minimized for a finite ripple limit in the passband and a minimum attenuation in the stopband. Furthermore, these filters can be implemented using planar circuit technology [24]. The spectral response of the optical LPEF of the order N is given by [24]
where EN2(ω) is the Chebyshev rational function and can be determined from the specified ripple characteristics. Similarly, the s-domain transfer function of the LPEF of order N can be obtained as
where s = jω, for odd N, and for even N. The definitions of all the bands of the filters can be referred to in Figure 10.49. Figure 10.50 illustrates a typical response of the LPEF. The carrier wavelength of 1550 nm is used as the center wavelength corresponding to the optical frequency of 193.41 THz. The characteristic of the elliptic filter is designed with the following properties: passband ripple = 0.5 dB or less; minimum stopband attenuation = 10 dB; passband region = 28 GHz; stopband = 2 GHz; and 20 dB cutoff band = 10 GHz and 20 GHz for the left and right sides, respectively. The filter spectral characteristics are illustrated in Figures 10.50 and 10.51. The eight multiplexed signals at the output of an LPEF filter are plotted in Figure 10.52. This type of OFs can be implemented by using fibers Bragg gratings or multistage silica-on-silicon planar integrated MZDI. We note that the MZDI can also be considered as an al-pass (all-zero) filter that would offer no resonant peaks, and hence its group delay is almost constant and thus no dispersion would be introduced by these OFs. In this work, we would take into account the dispersion characteristics deduced from the group delay of the design filter, and this would be compensated for by the dispersion-compensating module.
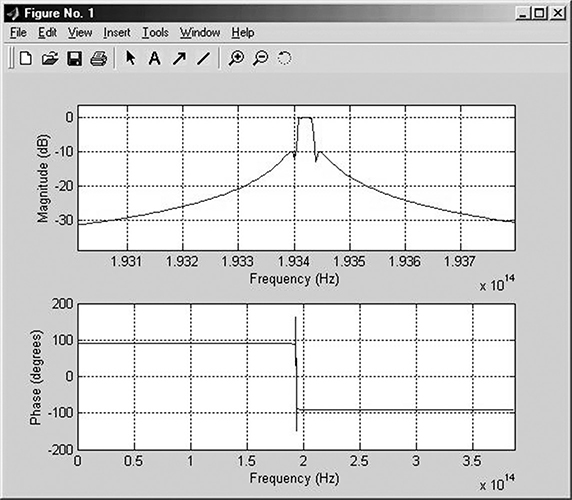
FIGURE 10.50 Frequency responses of the elliptic filter including the amplitude (upper curve) and phase (lower graph).
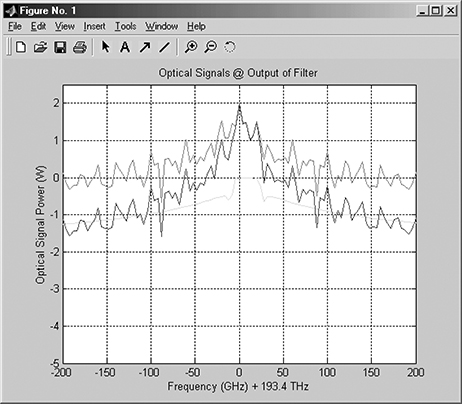
FIGURE 10.51 Filter characteristics (bottom) and signal spectra before filtering (most upper) and after filtering (middle curve). The filter frequency response is also included and indicated as the bottom graph.
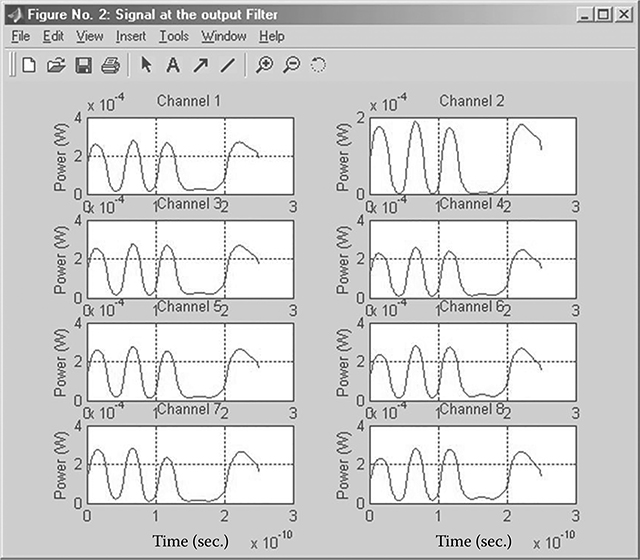
FIGURE 10.52 Signals of the DWDM channels at the output of the VSB filters.
The optical transmission system is simulated for eight wavelength channels in which the 1550 nm wavelength is taken as the center wavelength and the frequency spacing of 20, 30, and 40 GHz wavelength grid, and so on. For simplicity, we use 1550 nm as the center wavelength rather than the exact ITU spectral grid. After filtering out the unwanted sideband, the multichannels are then multiplexed and then propagated through the single-mode low nonzero dispersion-shifted fibers (NZ-DSFs). The multiplexing is based on the wavelength division multiplexing (WDM) technique in which multiple optical carriers at different wavelengths are modulated using independent electrical bit streams and then transmitted over the same fibers. Our design employs variable channel spacing of 20–40 GHz. The signal spectra in the frequency and the time domain at the output of the multiplexer are depicted in Figure 10.53. We observe that there are some ripples in the temporal signals. It is believed that these ripples appearing at the output of the multiplexer are due to the crosstalks generated in multichannel transmission. At the output of the LPEF, the ripple is negligible as the channels are filtered independently to each other.
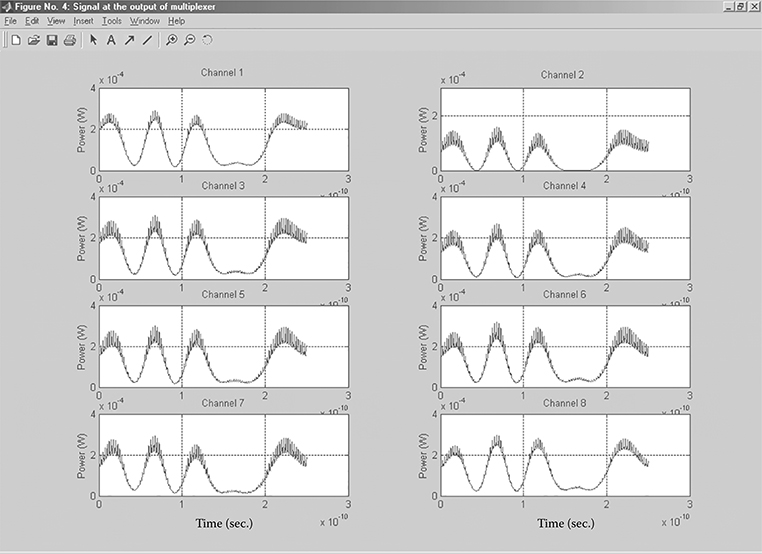
FIGURE 10.53 Time-domain signals of the channels at the outputs of the optical multiplexer.
10.4.3 Transmission Dispersion and Compensation Fibers
SMFs, standard or NZ-DSF types, are naturally chosen as the transmission media in this simulation. This section briefly describes the design of the fibers so that their dispersion properties can be specified accurately instead of using the data provided by fiber manufacturers. Due to chromatic dispersion, the GVD is frequency dependent. Consequently, different spectral components of the pulse travel at different velocities and cause pulse dispersion that limits the performance of SMFs. Fiber dispersion consists of two components: material dispersion and waveguide dispersion. The transmission fibers and the matched DCFs as described in Ref. [25] with matched dispersion factors and dispersion slopes for complete compensation of the channels across the signal spectral band. A brief summary of the design can be explained as follows.
For the transmission fiber, the material M(λ) and DW(λ) waveguide dispersion factors can be calculated by using
The waveguide-dependent factor can be approximated by when the V parameter limited in range of 1.3–2.6 micro-meters for SSMF whose waveguide and dispersion factors have been given in Chapter 2 as
Hence, the total dispersion fibers is given by
In order to obtain nonzero low total dispersion of the SMMF and the DCF over a wide wavelength range, techniques for design of dispersion-flattened fibers are gain considered here, thus the repeat of a number of equations given earlier in Chapter 2. An optimized large-effective-area fiber with pure silica material for the cladding is designed for the transmission medium since it gives the best dispersion slope for matching with those of the dispersion compensation module. The Sellmeier constants for pure silica fibers are: G1 = 0.696750 and λ1 = 0.069066e−6; G2 = 0.408218 and λ2 = 0.115662e−6; and G3 = 0.890815 and λ3 = 9.9900559e−6. The refractive index of pure silica can be expressed as
with c1 = 1.45084, c2 = −0.00343 μm−2, and c3 = 0.00292 μm2, and hence the refractive index [n(λ)] for pure silica fiber is 1.45. For DCF these coefficients would be changed accordingly, even the index profile so that the wave guide and dispersion factors can meet the criteria for compensation over the whole spectral window of the multichannels. We have designed the transmission and dispersion-compensating optical fibers with a specific dispersion factor of 17 ps/nm/km and a dispersion slope of 0.3 ps/(nm2·km) for transmitting several channels. The dispersion and dispersion slope values of the dispersion-compensating fiber are designed with a factor of five times those of the transmission fiber, with a residual dispersion of about 1.5 ps/nm/km for the highest and lowest wavelength channels. These fiber parameters are used in this simulation: fibers radius a = 1.6 μm; relative refractive index difference Δ = 0.0339. The dispersion factors of the centered channel (only channel 5 is illustrated) are indicated in Figure 10.54.
The pulse broadening after transmitting through a fiber of length L can be expressed as
where D(λ) is the fiber’s spectral dispersion (ps/(nm·km)); σλ is the signal bandwidth when the laser linewidth is much smaller than that of the VSB signals; and L is the fiber’s transmission distance. Figure 10.54 shows the signals at the output of the demultiplexer for each channel (channels 1 through 8) without dispersion compensation.
From Figure 10.54, the simulation results show that over a 100 km span transmission line, the eye of the transmitted data closes completely, as expected, due to fiber dispersion. It is observed that the eye is still open at a BER of about 10−9 after 16 km designed fiber transmission. This is a significant improvement over the NRZ format.
We now turn to the DCFs. Since the GVD limits the system performance, it is essential to implement a DCF. The condition of dispersion compensation can be expressed as
where D1 is dispersion factor of the transmission section (ps/(nm·km)); L1 is the transmission distance (km); D2 is the dispersion compensation distance (ps/(nm·km)); L2 is the dispersion compensation distance (km); and Γ is the dispersion factor contributed by the VSB OF. Obviously, Equation 10.10 shows that the DCF must have its GVD negative at 1550 nm to compensate for the positive dispersion of the transmission fibers and the OF. The parameters of the DCF can be optimized for minimum nonlinear self-phase-modulation effect with: fiber radius a = 1.7 μm; relative refractive index difference Δ = 0.0243. Figure 10.55 shows the transmitted data at the end of the dispersion-managed system with a dispersion compensation for channel 5 (of the eight channels). This shows the effectiveness of dispersion compensation fibers in the improvement of the BER because the received eye diagram is quite close to its original pattern as obtained at the output of the transmitter. The residual ripple of the compensated pulses clearly shows the effects of the filter passband on the time-domain pulses. These ripples contribute the penalty on the eye closure, and hence the Q factor. An optical multiplexer then combines the modulated lightwaves to the transmitting fibers. At the receiver, the channels are separated into different signals by an optical demultiplexer. Figure 10.54 gives the simulation results of transmitted signals at the output of the multiplexer without dispersion compensation, while Figure 10.55 shows the transmitted signals at the output of multiplexers with DCF in cascade with the transmission fibers. We note that the optical amplifiers at the input and booster amplifiers at the output are not included in this simulation.
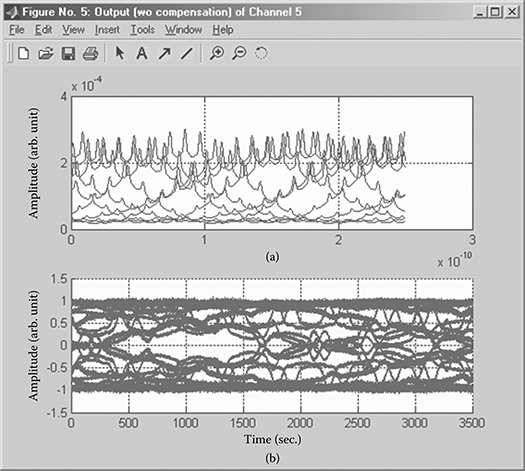
FIGURE 10.54 Signal outputs at the end of transmission fibers without dispersion compensation of the centered channel 5 at 1550 nm, with DT = 2.7455e−6 ps/(nm · km): (a) time sequence and (b) eye diagram.
10.4.4 Transmission Performance
The eye diagram is used to deduce the Q factor and hence the system BER. The random digital optical pulse sequence suffers distortion by noise, pulse broadening and timing jitter errors introduced in the optically amplified fiber link. Assuming that the probability density function of “1”and “0” are equal and Gaussian, the eye diagram can be used to estimate the Q factor by
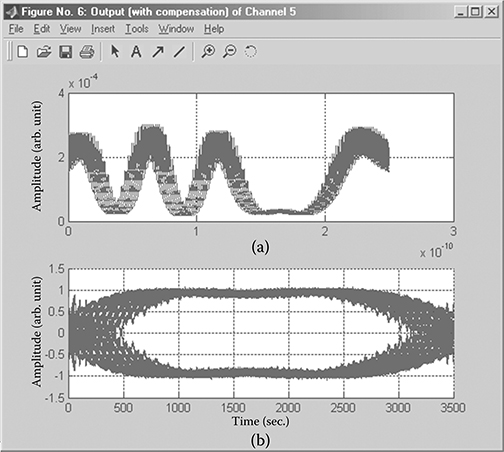
FIGURE 10.55 Signal outputs at the end of the transmission line with dispersion compensation of the center channel—channel 5 at 1550 nm with DCF dispersion factor of −2.7918e−6 ps/(nm · km): (a) temporal sequence and (b) eye diagram.
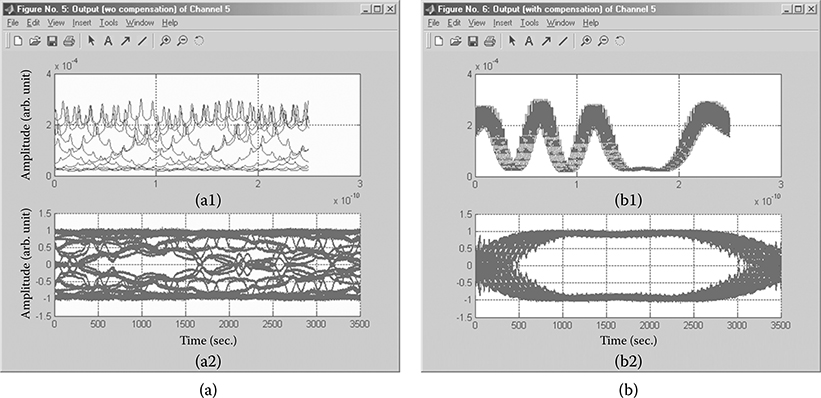
FIGURE 10.56 Signals received after transmission: (a) without dispersion compensation and (b) with dispersion compensation. (a1) and (b1) are the temporal sequence, and (a2) and (b2) are the corresponding eye diagrams.
where μ1 and μ0 are the means of the current at the output of the photodetector of the decision circuitry of the receiver at the sampling instant, respectively, for symbols “1” and “0.” While σ1 and σ0 are the standard deviations of the current at the decision circuit input at the sampling instant, for the symbols “1” and “0”, respectively.
Figure 10.56a and b shows the eye diagram of the transmitted pulse random sequence at 1550 nm (channel 5) with 40 GHz channel spacing, which depicts the eye diagram at the end of the transmission line without and with dispersion compensation fibers, respectively. The eye diagram of data with dispersion compensation is wide open compared to that without dispersion compensation. The wide-open eye diagram shows that the system performance is good, since the error has been compensated.
10.4.4.1 Effects of Channel Spacing on Q Factor
The capacity of the WDM system depends on how close channels can be packed into the wavelength domain. The minimum channel spacing is limited by interchannel crosstalk. The typical value of channel spacing should exceed four times that of the bit rate. The Q factor is obtained for each channel at the output of the multiplexer and at the output of the demultiplexer, at the end of the 16 channels DWDM over the transmission distance with a residual dispersion equivalent to 10km SSMF as depicted in Figure 10.57. The Q factor at the output of the demultiplexer decreases significantly for a channel spacing of 20–30 GHz. While the Q factor for 40 GHz channel spacing decreases only slightly. This indicates the resilience of the VSB modulation format to the chromatic dispersion.
10.4.4.2 Effects of GVD on Q Factor
The effects of GVD on transmitted channels with and without dispersion compensation fibers are evaluated with the Q factor as the reference performance parameter. Dispersion compensation fibers play an important role in optical transmission, since the GVD limits the transmission performance. By adding dispersion compensation fibers that have the opposite sign of the GVD, the effect of GVD can be considerably reduced. Figure 10.58 shows the dispersion tolerance of the transmission system—the DCF has significantly improved the Q factor at the receiver to an equivalent BER close to an error-free 10−9 at a bit rate of 40 Gbps. Shown also in this figure is the dispersion tolerance of RZ-DQPSK of 20 GBaud/s. The performance of the two modulation formats is very closely similar. However, the VSB format may offer the advantage of a simplified transmitter with additional OF rather than another parallel transmitter arm for generation of the quadrature constellation in addition to the in-phase components [20].
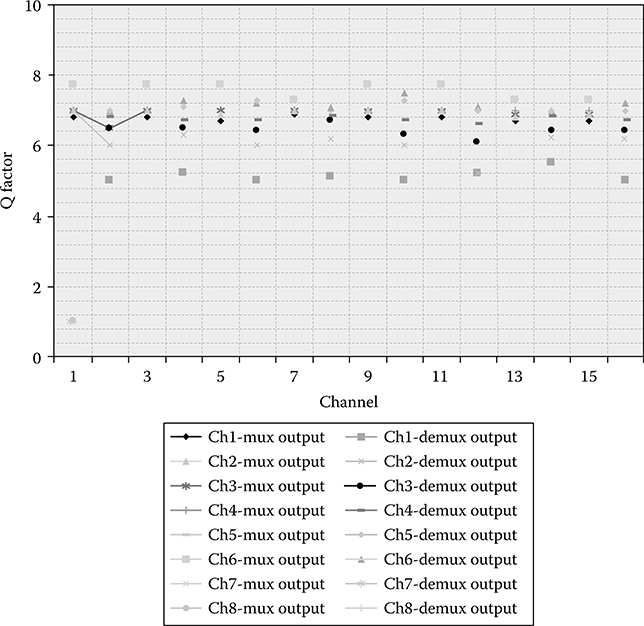
FIGURE 10.57 Q factor for the multiplexed channels 1–16 at the output of the optical mux (before transmission) as a function of the Channel number over the C band. The Q factor (or eye diagram-eye opening quality) is monitored at the output of demux (after transmission distance). Horizontal axis—channel number.
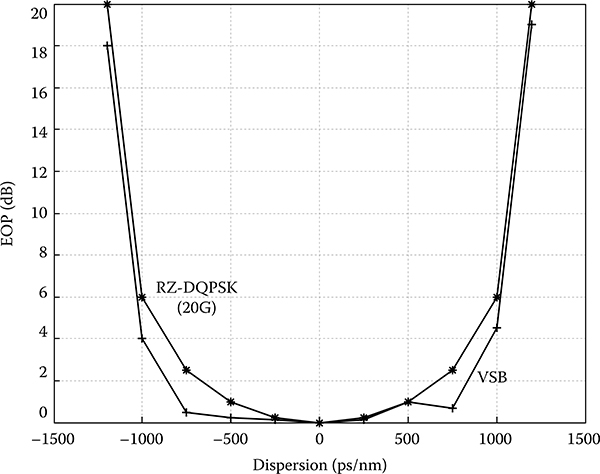
FIGURE 10.58 Dispersion tolerance of VSB format at 40 Gbps (+) transmission as compared with 20 GBaud/s RZ-DQPSK (*). Eye-opening penalty version dispersion factor at BER of 1e−9 of channel 5.
10.4.4.3 Effects of Filter Passband on the Q Factor
The effect of VSB filtering on the Q factor and its dispersion tolerance can be examined by varying the passband characteristic of the VSB filter and measuring the Q factor for each lightwave channel at the output of the demultiplexer, as shown in Figure 10.59. It is clear that, for the 40 Gbps NRZ data format, the system penalty is one unit of the Q factor, which is equivalent to one decade of BER or about 10 dBQ when the passband of the OF is extended from 20 to 24 GHz. This penalty could be due to the cutoff of the signal band by the roll-off band of the OF with more than half of the bandwidth eliminated. For 28 GHz passband, the Q factor increases considerably to 7.8, or BER = 10−15—that is, error-free transmission when the sampling is at the center of the eye. This shows that the performance of the VSB modulation format is better than double-sideband (DSB) modulation, since the VSB format eliminates most but not all of the redundant sideband.
When DCFs and pure gain optical amplifiers are incorporated in front and after the DCF is used, the transmission distance can be extended to 15 spans with a BER of 10−12 for all 16 wavelength channels.
Figure 10.60 shows the BER versus the receiver sensitivity of the VSB experiment simulation and measured experimental values of transmission using CSRZ-DPSK [25]. We observe that the OFs with a raised-cosine shape and that of the Chebyshev type would offer nearly the same transmission performance of BER versus receiver sensitivity and about 2 dB at a BER of 10−9 poorer than the CSRZ modulation format. This is reasonable due to the slow roll-off of the cutoff band of the filter. The advantage of the VSB modulation format of the simpler transmitter structure can compensate for this penalty.
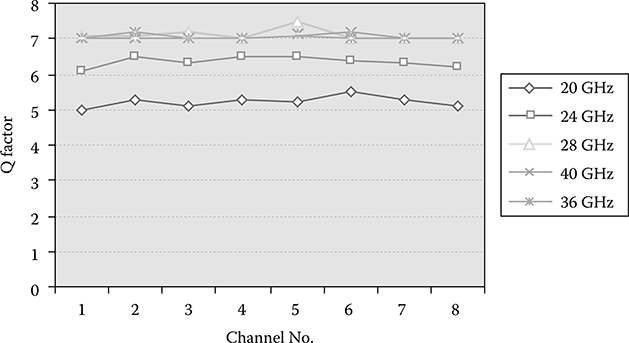
FIGURE 10.59 Variation of the Q factor as a function of the VSB filter frequency passband.
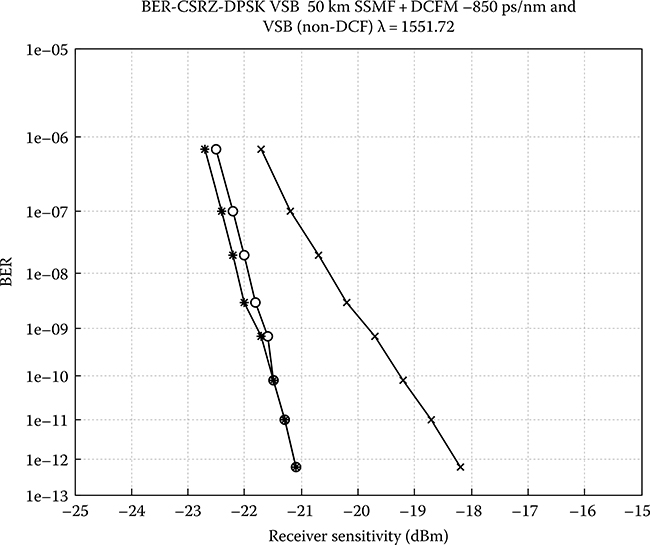
FIGURE 10.60 VSB experiment simulation and CSRZ-DPSK experimental values. (o) VSB with Chebyshevtype optical filter; (*) VSB raised-cosine optical filter having the same cutoff passband as that of the Chebyshev filter; (+) CSRZ-DPSK (experiment).
10.5 Single-Sideband Modulation
10.5.1 Hilbert Transform SSB MZ Modulator Simulation
The Hilbert transform of signal m(t) is defined to be the RF signal whose frequency components are all phase shifted by π/2 radians (Figures 10.61 and 10.62).* Therefore
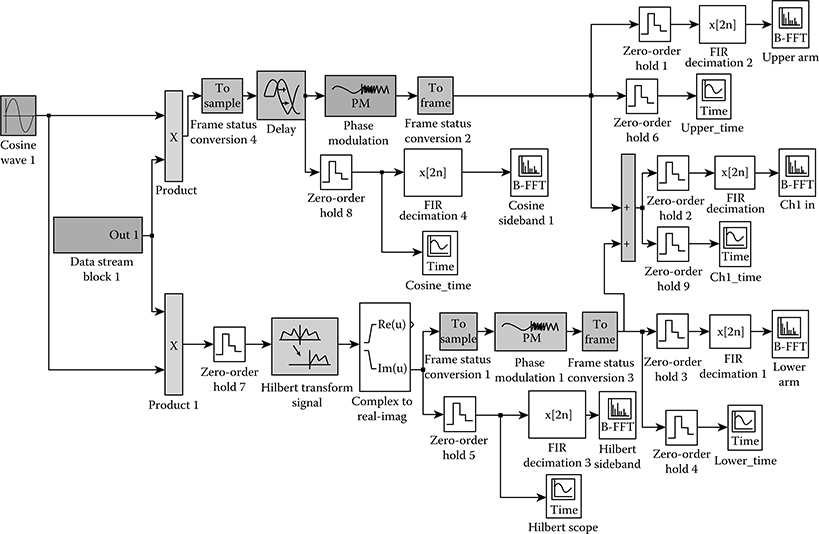
FIGURE 10.61 SSB Hilbert transform phase shift modulator.
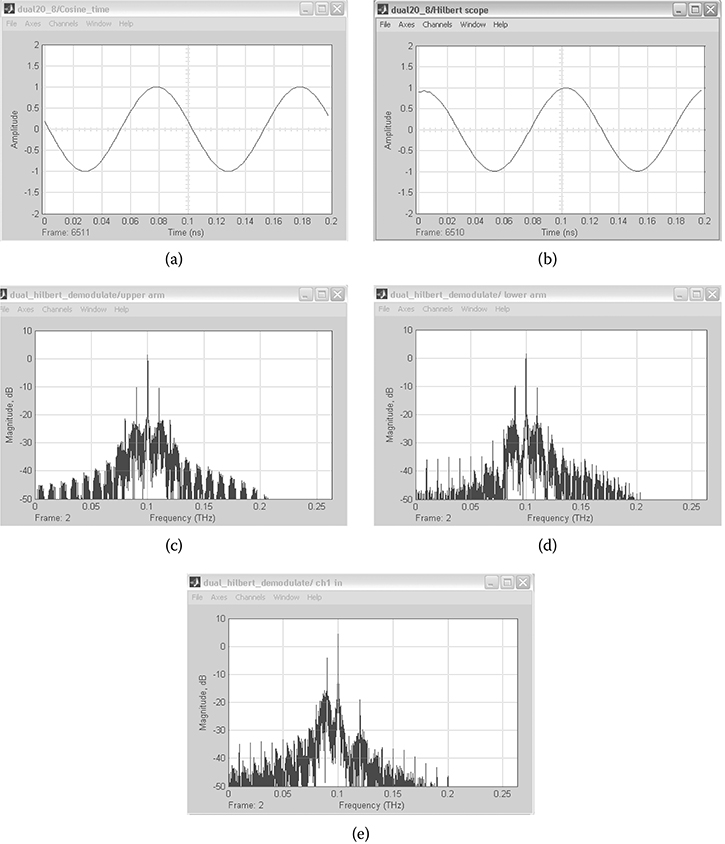
FIGURE 10.62 (a) Input RF signal time scope (cosine signal) and (b) Hilbert transform the input RF signal H{x(t)} = Acos(2π fot − π/2) = Asin(2π fot). (c) upper arm of dual-electrode MZ modulator with delay 10 ns in Hilbert transform phase shift system; (d) lower arm of dual-electrode MZ modulator with Hilbert transform phase shift θ = π/2; and (e) dual-electrode MZ modulator single-sideband system spectrum result with lower SB cancels out.
Taking the Fourier transform, we have
10.5.2 SSB Demodulator Simulation
The modulated signal is
The demodulated signal is (Figures 10.63 and 10.64)
The low-pass filter is used to filter high-frequency components in the signal. The only component left is the modulating signal (10 Gbps [binary ∗ cosine signal]) after demodulation. It is required to multiply the demodulated signal by in-phase cosine signal and also there is high-frequency signal, so that LPF is required to filter the high-frequency components in the signal.
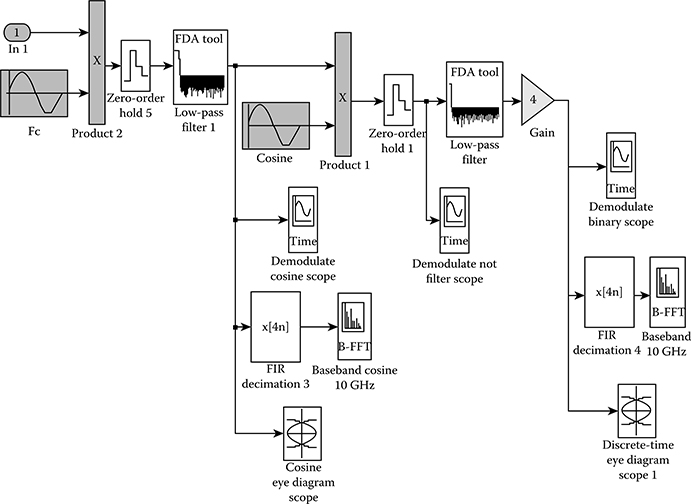
FIGURE 10.63 Single-sideband demodulator platform.
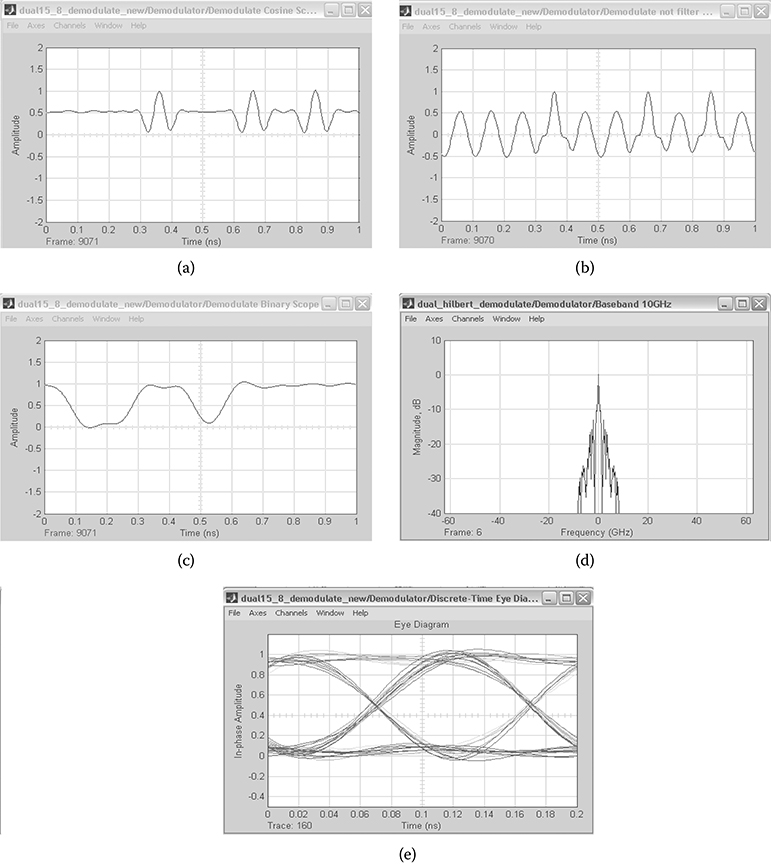
FIGURE 10.64 (a) Demodulated Fc signal time scope; (b) demodulate cosine signal time scope before low-pass filter (c) demodulated signal time scope after low-pass filter, and (d) demodulated signal spectrum. (e) demodulated signal eye diagram NRZ-SSB with Q = 8 and BER = 10−15.
10.6 Concluding Remarks
We have presented the simulation results of 40 Gbps DWDM optical transmission systems with NRZ-VSB modulation format. The effects of filtering on the Q factor with respect to fiber dispersion and compensation, channel spectral spacing, and the effects of symmetry and asymmetry of the filter pass and cutoff bands are examined. We can draw the following conclusions:
The Q factor at the output of the demultiplexer decreases significantly for channel spacing of 20–30 GHz due to noise and crosstalk interference. However, the Q factor decreases slightly for 40 GHz channel spacing. A BER of 10−12 can be achieved over all channels with this channel spacing. For dense and superdense WDM optical transmission, the demands on the roll-off, cutoff, and passband of VSB OFs are high.
Fiber dispersion can reduce the system performance dramatically. Using dispersion compensation fibers along the transmission line will improve the system performance significantly. Specific designed fibers with deterministic dispersion are used.
The 20 and 24 GHz passband OFs give low performance. The low performance could be caused by the unstable system since about half of the bandwidth is eliminated. While, for 28 GHz passband, the Q factor is considerably improved to 7.5. Thus, the performance of VSB modulation format is comparable and marginally enhanced as compared to that of the double-sideband NRZ-amplitude shift keying modulation format since the VSB format eliminates most, but not all, of the redundant sideband.
Several types of OFs are examined, and the sharp roll-off band is expected to contribute to the improvement of the VSB transmission. However, the roll-off band must be at least 20 dB below the power level of the center of the spectrum of the signal and carrier frequency to avoid the pulse ripples.
The all-zero all-pass OFs can be designed and implemented in planar lightwave circuit technology to substitute for the two-poles elliptic filters to eliminate the filter contribution to the total dispersion of the transmission system.
Nonlinear effects such as the self-phase modulation, cross-phase modulation, Raman scattering, and patterning effects are not considered in this chapter.
References
1. S. K. Kim, J. Lee, and J. Jeong, Transmission performance of 10-Gbps optical DB transmission systems considering adjustable chirp of non-ideal LiNbO3 MZIMs due to applied voltage ratio and filter bandwidth, IEEE J. Lightwave Technol., Vol. 19, No. 4, pp. 465–470, 2004.
2. H. Gnauk and P. J. Winzer, Optical phase-shift-keyed transmission, IEEE J. Lightwave Technol., Vol. 23, No. 1, pp. 115–118, 2004.
3. S. Zhang, Advanced Optical Modulation Formats in High Speed Lightwave System, Lawrence, KS: University of Kansas, pp. 17–32, 2004.
4. K. Yonenaga, S. Kuwano, S. Norimatsu, and N. Shibata, Optical DB transmission system with no receiver sensitivity degradation, Electron. Lett., Vol. 31, No. 4, pp. 302–304, 1995.
5. K. Yonenage and S. Kuwano, Dispersion-tolerant optical transmission system using DB transmitter and binary receiver, IEEE J. Lightwave Technol., Vol. 15, No. 8, pp. 1530–1537, 1997.
6. T. Franck, P. B. Hansen, T. N. Nielsem, and L. Eskildson, DB transmitter with lower intersymbol interference, IEEE Photon. Technol. Lett., Vol. 10, No. 4, pp. 597–599, 1998.
7. F. Elrefaie, R. E. Wagner, D. A. Atlas, and D. G. Daut, Chromatic dispersion limitations in coherent lightwave transmission system, IEEE J. Lightwave Technol., Vol. 6, No. 5, pp. 704–709, 1988.
8. T. Ono, Y. Yuno, K. Fukuchi, T. Ito, H. Yamazaki, M. Yamaguchi, and K. Emura, Characteristics of optical DB signals in terabit/s capacity, high-spectral efficiency WDM systems, IEEE J. Lightwave Technol., Vol. 16, No. 5, p. 7, 1998.
9. Y. Miyamoto, M. Yoneyama, T. Otsuji, K. Yonenaga, and N. Shimizu, 40 G-bits/s TDM transmission technologies based on ultra-high-speed IC’s, IEEE J. Solid-State Circuits, Vol. 34, No. 9, pp. 1246–1253, 1999.
10. O. Sinkin, J. Zweck, and C. R. Menyuk, Comparative study of pulse interactions in optical fiber transmission systems with different modulation formats, Opt. Express, Vol. 9, No. 7, pp. 339–352, 2001.
11. M. Yoneyama, K. Yonenaga, Y. Kisaka, and Y. Miyamoto, Differential precoder IC modules for 20- and 40-Gbits/s optical DB transmission system, IEEE Trans. Microwave Theory Tech., Vol. 47, No. 12, pp. 2263–2270, 1999.
12. K. P. Ho and J. M. Kahn, Spectrum of externally modulated optical signals, IEEE J. Lightwave Technol., Vol. 22, No. 2, pp. 658–663, 2004.
13. S. Haykin, Communication Systems, 4th ed., John Wiley & Sons, New York, USA, 2001.
14. S. Ramachandran, B. Mikkelsen, L. C. Cowsar, M. F. Yan, G. Raybon, L. Boivin, and M. Fishteyn, All-fiber grating-based higher order mode dispersion compensator for broad-band compensation and 1000-km transmission at 40 Gb/s, IEEE Photon. Technol. Lett., Vol. 13, No. 6, pp. 632–634, 2001.
15. Y. Kim, J. Lee, Y. Kim, and J. Jeong, Evaluation of transmission performance in cost-effective optical duobinary transmission utilizing modulator’s bandwidth or low-pass filter implemented by a single capacitor, Opt. Fib. Technol., Vol. 10, No. 4, pp. 312–324, 2004.
16. D. Boivin, M. Hanna, and J. R. Barry, Reduced-bandwidth duobinary differential continuous-phase Modulation format for optical communications, Photonics Technology Letters, IEEE Photon. Technol. Lett., Vol. 17, No. 6, pp. 1331–1333, 2005.
17. K. P. Ho, Phase-Modulated Optical Communications Systems, Berlin, Germany: Springer Verlag, p. 212, 2005.
18. N. S. Bergano et al., Chirped return to zero formats for ultra-long-haul fibers communications, in 2004 IEEE Workshop on Advanced Modulation Formats, San Francisco, CA, 2004.
19. T. Ohm, Comparison of different DQPSK transmitters with NRZ and RZ impulse shaping, in IEEE Workshop on Advanced Modulation Formats, San Francisco, CA, 2004.
20. M. Serbay et al., Comparison of six different RZ-DQPSK transmitter set-ups regarding their tolerance towards fibers impairment in 8x40 Gbps WDM-systems, in IEEE Workshop on Advanced Modulation Formats, San Francisco, CA, 2004.
21. Y. Zhu et al., Highly spectral efficient transmission with CSRZ-DQPSK, in IEEE Workshop on Advanced Modulation Formats, San Francisco, CA, 2004.
22. T. Tokle et al., Transmission of RZ-DQPSK over 6500 km with 0.66 bits/Hz spectral efficiency, in IEEE Workshop on Advanced Modulation Formats, San Francisco, CA, 2004.
23. R. E. Ziemer, W. H. Tranter, and D. R. Fannin, Signal and Systems: Continuous and Discrete, New York: Macmillan, 1989.
24. L. N. Binh et al., Photonic Signal Processing—Part II.2: Tuneable Photonic Filters using Cascaded All-Pole Micro-Rings and All-Zero Interferometers, Technical Report code MECSE-12-2005, Clayton: Monash University, 2005.
25. L. N. Binh, T. L. Huynh, K.Y. Chin, and D. Sharma, Design of dispersion flattened and compensating fibers for dispersion-managed optical communications systems, Int. J. Wireless Opt. Commun., Vol. 1, pp. 1–21, 2004.
*Hilbert transform single sideband, Digital and Analog Communication Systems, 6th edition, p. 312.