
13
DSP-Based Coherent Optical Transmission Systems
13.1 Introduction
In Chapter 6, a generic flowchart of the digital signal process (DSP) was introduced (see Figure 6.1). This diagram is now reintroduced here in which the clock/timing recovered signals feeding back into the sampling unit of the analog-to-digital convertor (ADC) so as to obtain the correct timing for sampling the incoming data sequence for processing in the DSP. Any errors made at this stage of the timing will result in high deviation of the bit error rate (BER) in the symbol decoder shown in Figure 13.1. It is also noted that the vertical polarized (V-pol) and horizontal polarized (H-pol) channels are detected, and their in-phase (I-) and quadrature (Q-) components are produced in the electrical domain with signal voltage conditioned for the conversion to digital domain by the ADC.
The processing of the sampled sequence from the received optical data and photodetected electronic signals passing through the ADC relies on the timing recovery from the sampled events of the sequence. The flowing stages of the blocks given in Figure 13.1 may be changed or altered accordingly, depending on the modulation formats and pulse shaping, for example, the Nyquist pulse shapes in Nyquist superchannel transmission systems.
This chapter describes the processing algorithms which are associated within the optical reception subsystems of coherent optical transmission systems over highly dispersive optical transmission lines consisting of multispan optically amplified non-DCM SSMF. First, the quadrature phase shift keying (QPSK) homodyne scheme is examined, and then the 16QAM, incorporating both polarized channels multiplexed in the optical domain, and hence the term PDM-QPSK or PDM-16QAM. We then expand the study for superchannel transmission systems in which several subchannels are closely spaced in the spectral region, so as to increase the spectral efficiency such that the total effective bit rate must reach at least 1 Tbps. Due to the overlapping of adjacent channels, there are possibilities that modifications of the processing algorithms are to be made.
Furthermore, the nonlinearity impairments on transmitted subchannels could degrade the system performance, and the application of back propagation techniques described in Chapter 3 must be combined with linear and nonlinear equalization schemes in order to effectively combat performance degrading.
13.2 Quadrature Phase Shift Keying Systems
13.2.1 Carrier Phase Recovery
Homodyne coherent reception requires a perfect match of the frequency of the signal carrier and the local oscillator (LO). Any frequency difference will lead to phase noise of the detected signals. This is the largest hurdle for the first optical coherent system initiated in the mid-1980s. In DSP-based coherent reception systems, the recovery of the carrier phases and hence the frequency is critical to achieving the most sensitive reception with maximum performance in the BER, or evaluation of the probability of error. This section illustrates the recovery of the phase of the carrier of the received QPSK and 16QAM optical transmitted signals. How would the DSP algorithms perform under the physical impairment effects on the recovery of the phase of the carrier?
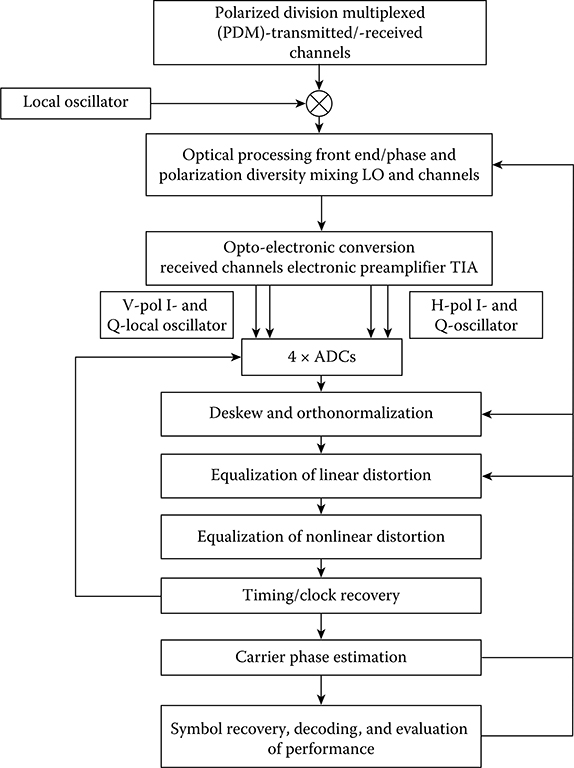
FIGURE 13.1 Flow of functionalities of DSP processing in a coherent optical receiver of a coherent transmission system. A modified diagram from Figure 5.22 (Chapter 5), with feedback path diverted to ADC block.
13.2.2 112G QPSK Coherent Transmission Systems
Currently, several equipment manufacturers are striving to provide commercial advanced optical transmission systems at 100 Gbps, employing coherent detection techniques for long-haul backbone networks and metro networks as well. It has been well known since the 1980s that single-mode optical fibers can support such transmissions due to the preservation of the guided modes and its polarized modes of the weakly guiding linearly polarized (LP) electromagnetic waves [1]. Naturally, both transmitters and receivers must satisfy the coherency conditions of narrow-linewidth sources and coherent mixing with an LO, an external cavity laser (ECL), to recover both the phase and amplitude of the detected lightwaves. Both polarized modes of the LP modes can be stable over long distance so far in order to provide the polarization division multiplexed (PDM) channels, even with polarization-mode dispersion (PMD) effects. All linear distortions due to PMD and chromatic dispersion (CD) can be equalized in the DSP domain employing algorithms in the real-time processors provided in Chapter 6.
It is thus very important to ensure that these subsystems are performing the coherent detection and transmitting functions. This section thus presents a summary of the transmission testsconducted for optical channels under back-to-back (B2B) and long-haul systems employing of QPSK PDM. The symbol rate of the transmission system is 28 GSy/s and the modulation format is PDM-CSRZ-QPSK. It is noted that the differential QPSK (DQPSK) encoder and the bit pattern generator are provided.
The transmission system is arranged as shown in Figure 13.2. The CSRZ-QPSK transmitter consists of a CSRZ optical modulator that is biased at the minimum transmission point of the transfer characteristics of the MZIM driven by sinusoidal signals whose frequency is half of the symbol rate or 14 GHz for 28 GSy/s. A wavelength-division multiplexing (WDM) mux (multiplexer) is employed to multiplex other wavelength channels located within the C-band (1530–1565 nm). An optical amplifier (EDFA type) is employed at the front end of the receiver, so that noises can be superimposed on the optical signals to obtain the OSNR. The DSP signals in the digital domain are carried out off-line, and the BER is obtained.
The transmitter consists of an ECL, an encore type, a polarization splitter coupled with a 45°-aligned ECL beam, two separate CSRZ external LiNbO3 modulators, and two I–Q optical modulators. The linewidth of the ECL is specified at about 100 KHz and, with external modulators, we can see that the spectrum of the output-modulated lightwaves is dominated by the spectrum of the baseband modulation signals. However, we observed that the laser frequency is oscillating at about 300 MHz due to the integration of a vibrating grating so as to achieve stability of the optical frequency.
The receivers employed in this system are of two types. One is a commercialized type, Agilent N 4391, in association with an Agilent external LO, and the other one is a TIA type, including a photodetector pair connected back-to-back (B2B) in a push–pull manner and then a broadband transimpedance amplifier (TIA). In addition to the electronic reception part, a π/2 hybrid coupler, including a polarization splitter, π/2 phase shift and polarization combiner that mixed the signal polarized beams and those of the LO (an ECL type identical to the one used in the transmitter), is employed as the optical mixing subsystem at the front end of the receiver. The mixed polarized beams (I–Q signals in the optical domain) are then detected by balanced receivers. I–Q signals in the electrical domain are sampled and stored in a real-time oscilloscope (Tektronix 7200). The sampled I–Q signals are then processed off-line using the algorithms provided in the scope or self-developed algorithms, such as the evaluation of error vector magnitude (EVM) described earlier for Q factor and thence BER.
Both the transmitter and the receiver are functioning with the required OSNR for the B2B of about 15 dB at a BER of 2e−3. It is noted that the estimation of the amplitude and phase of the received constellation is quite close to the received signal power and noise contributed by the balanced receiver with a small difference, owing to the contribution of the quantum shot noise contributed by the power of the LO. The estimation technique was described in Chapter 4. Figure 13.3 shows the BER versus OSNR for B2B QPSK PDM channels. As shown in Figure 13.4, the variation of BER as a function of the signal energy over noise power per bit, for 4QAM or QPSK coherent then the SNR is expected at about 8 dB for BER of 1e−3. Experimental processing of such a scheme in B2B configuration shows an OSNR of about 15.6 dB. This is due to the 3 dB split by the polarized channels, and then additional noises are contributed by the receiver, and hence about 15.6 dB OSNR is required. The forward error coding (FEC) is set at 1e−3. The receiver is the Agilent type, as mentioned earlier.
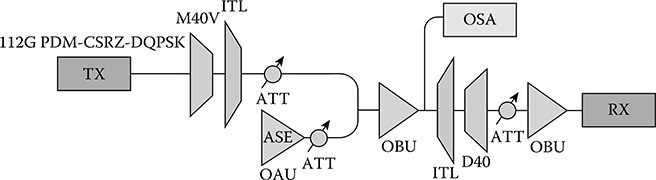
FIGURE 13.2 Setup of the PDM-QPSK optical transmission system. Tx = transmitter, PDM = polarization division multiplexing, ITL = interleaved transmission line, CSRZ = carrier suppressed return-to-zero, OSA = optical spectrum analyzer, Rx = receiver, OBU = optical boosting unit, D40 = optical demux type 40, Att = attenuator, OAU = optical amplifier unit, and ASE = amplification stimulated emission (noise).
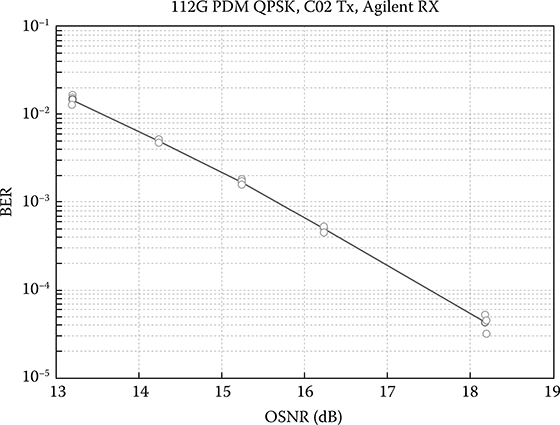
FIGURE 13.3 B2B OSNR versus BER performance with Agilent Rx in 112 Gbps PDM-CSRZ-DQPSK system.
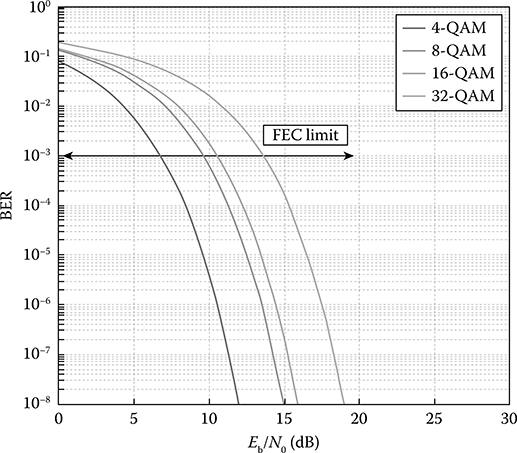
FIGURE 13.4 Theoretical BER versus SNR for different-level QAM schemes obtained by BER tool.m of MATLAB®.
A brief analysis of the noises at the receiver can be as follows. The noise is dominated by the quantum shot noise generated by the power of the LO, which is about at least ten times greater than that of the signals. Thus, the quantum shot noises generated at the output of the photodetector is
The bandwidth of the electronic preamplifier of 31 GHz is taken into account. This shot noise current, due to the LO imposed on the PD pair, is compatible with that of the electronic noise of the electronic receiver, given that the noise spectral density equivalent at the input of the electronic amplifier of the U2t balanced receiver is specified at , that is
Thus, any variation in the LO would affect this shot noise in the receiver. It is thus noted that, with the transimpedance of the electronic preamplifier estimated at 150 Ω, a dBm difference in the LO would contribute to a change of the voltage noise level of about 0.9 mV in the signal constellation obtained at the output of the ADC. A further note is that the noise contributed by the electronic front end of the ADC has not been taken into account. We note that differential TIA offers at least ten times higher transimpedance of around 3000 Ω over the 30 GHz mid-band. These TIAs offer much higher sensitivities as compared to the single-input TIA type [2,3].
13.2.3 I-Q Imbalance Estimation Results
There are imbalances due to the propagation of the polarized channels and the I and Q components. They must be compensated in order to minimize the error. The I–Q imbalance of the Agilent BalRx and U2t BalRx is less than 2 degrees, which might be negligible for the system, as shown in Figure 13.5. This imbalance must be compensated for in the DSP domain.
13.2.4 Skew Estimation
In addition to the imbalance of the I and Q due to optical coupling and electronic propagation in high-frequency cables, there are propagation delay time differences between these components that must be compensated. The skew estimation obtained over a number of data sets is shown in Figure 13.6.
Abnormal skew variation from time to time was also observed, which should not happen if there is no modification of the hardware. Considering the skew variation that happened with the Agilent receiver, which only has a very short RF cable and a tight connection, there is a higher probability that the skew happened inside the Tektronix oscilloscope than at the optical or the electrical connection outside.
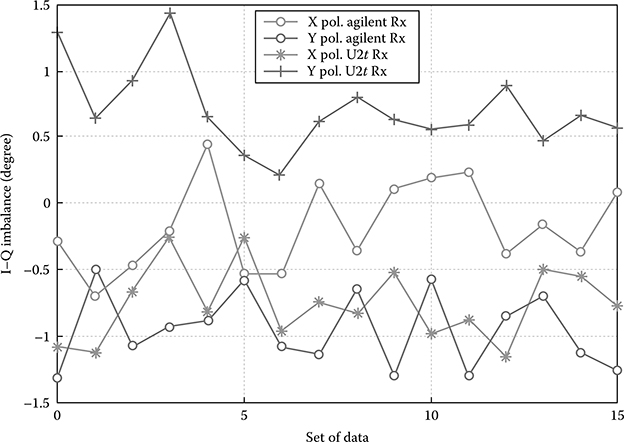
FIGURE 13.5 I-Q imbalance estimation results for both Rx. Note maximum imbalance phase of ±1.5°.
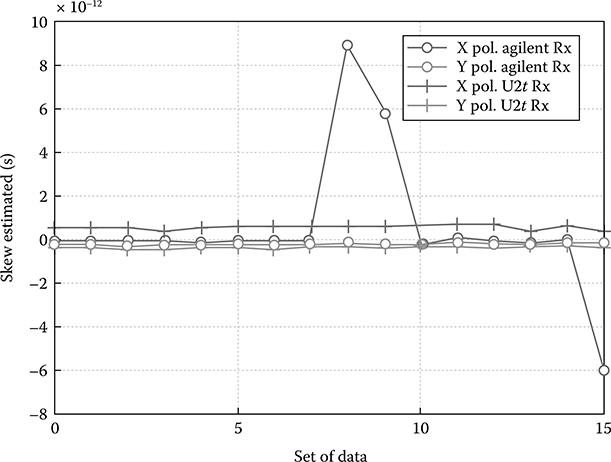
FIGURE 13.6 Skew estimation results for both types of Rx.
Figure 13.7 shows the BER versus OSNR when the skew and imbalance between I and Q components of the QPSK transmitter are compensated. The OSNR of DQPSK is improved by about 0.3~0.4 dB at 1e–3 BER, when compared with the result without I–Q imbalance and skew compensation, as shown in the constellation obtained in Figure 13.8. In the time domain, the required OSNR of DQPSK at a BER of 1e−3 is about 14.7 dB, improved by 0.1 dB. The required OSNR at 1e–3 BER of QPSK is about 14.7 dB, which is about the common performance of the state-of-the-art for QPSK. For a BER = 1e−3, an imbalanced CMRR = −10 dB would create a penalty of 0.2 dB in the OSNR for the Agilent receiver, and an improvement of 0.7 dB for a commercial balanced receiver employed in the Rx subsystems.
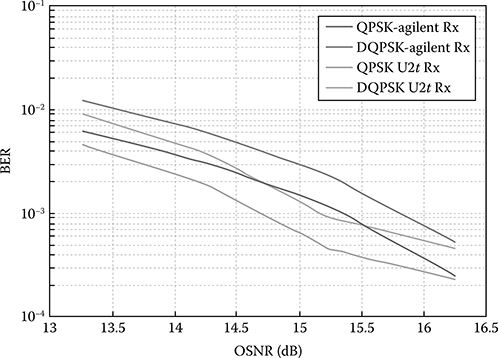
FIGURE 13.7 OSNR versus BER for two types of integrated coherent receiver after compensating I–Q imbalance and skew.

FIGURE 13.8 Constellation after (a) PMD module and after (b) CPE algorithm module.
Figure 13.9 shows the structure of the ECL incorporating a reflection mirror that is vibrating at a slow frequency of around 300 MHz. A control circuit would be included to indicate the electronic control of the vibration and cooling of the laser, so as to achieve stability and elimination of Brillouin scattering effects.
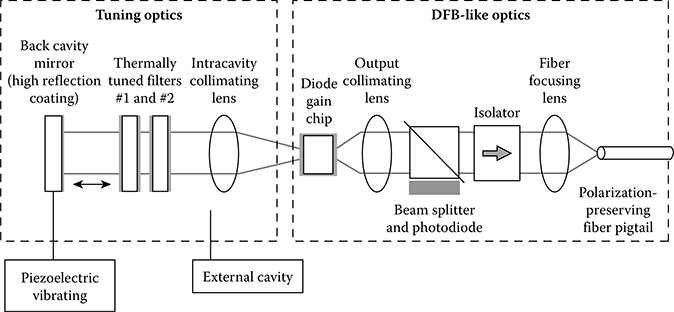
FIGURE 13.9 External cavity structure of the laser with the back mirror vibration in the external cavity structure.
13.2.5 Fractionally Spaced Equalization of CD and PMD
Ip and Kahn [5] has employed the fractionally spaced equalization scheme with MSE (mean square error) to evaluate its effectiveness of PDM-ASK (amplitude shift keying) with NRZ (non-return-to-zero) or RZ (return-to-zero) pulse-shaping transmission system. Their simulation results are displayed in Figure 13.10 [5] for the maximum allowable CD (normalized in ratio with respect to the dispersion parameter of the single-mode fiber [SMF], as defined in Chapter 2) versus the number of equalizer taps N for a 2 dB power penalty at a launched OSNR of 20 dB per symbol for ASK-RZ and ASK-NRZ pulse shapes, using a Bessel antialiasing filter with a sampling rate of 1/T = M/KTs; Ts = symbol_period, with M/K as the fractional ratio, as shown in Figure 13.10 for a fractional ratio of (a) M/K = 1, (b) 1.5, (c) 2, and (d), (e), and (f) using a Butterworth antialiasing filter. The sampling antialiasing filter is employed to ensure that artificial fold back to the spectrum is avoided. The filter structures Bessel and Butterworth give much similar performance for fractional spaced equalizers, but less tap for the Bessel filtering case when an equally spaced equalizer is used (see Figure 13.10a and d).
13.2.6 Linear and Nonlinear Equalization, and Back Propagation Compensation of Linear and Nonlinear Phase Distortion
Ip and Kahn [6] first developed and applied back propagation, as given in Chapter 2, to equalize the distortion owing to nonlinear impairment of optical channel transmission through single-mode optical fibers. The back propagation algorithm is simply a reverse-phase rotation at the end of each span of the multispan link. The rotating phase is equivalent to the phase exerted on the signals in the frequency domain with a square of the frequency dependence. Thus, this back propagation is efficient in the aspect that the whole span can be compensated so as to minimize the numerical processes, hence requiring less processing time and central processing unit time of the digital signal processor.
Figure 13.11 [6] shows the equalized constellations of a 21.4 GSy/s QPSK modulation scheme system after transmission through 25 × 80 km non-DCF spans under the equalization using (a) linear compensation only, (b) nonlinear equalization, and (c) using combined back propagation and linear equalization. Obviously, the back propagation contributes to the improvement of the performance of the system.
Figure 13.12 shows the phase errors of the constellation states at the receiver versus a launched power of 25 × 80 km multispan QPSK 21.4 GSy/s transmission system. The results extracted from Ref. [6] show the performance of back propagation phase rotation per span for 21.4 Gbps 50% RZ-QPSK, transmitted over 25 × 80 km spans of SMF with five ROADMs (reconfigurable optical add–drop module), with 10% CD under-compensation. The algorithm is processed off-line of received sampled data after 25 × 80 km SSMF propagation via the use of the nonlinear Schrödinger equation (NLSE) and the coherent reception technique described in Chapter 4. It is desired that the higher the launched power, the better the OSNR that can be employed for longer-distance transmission. Hence, fractional space ratios of 3 and 4 can offer higher launched power and thus they are the preferred equalization scheme as compared with the equal space whose sampling and symbol rate are the same. The ROADM is used to equalize the power of the channel under consideration as compared with other dense wavelength division multiplexing (DWDM) channels.
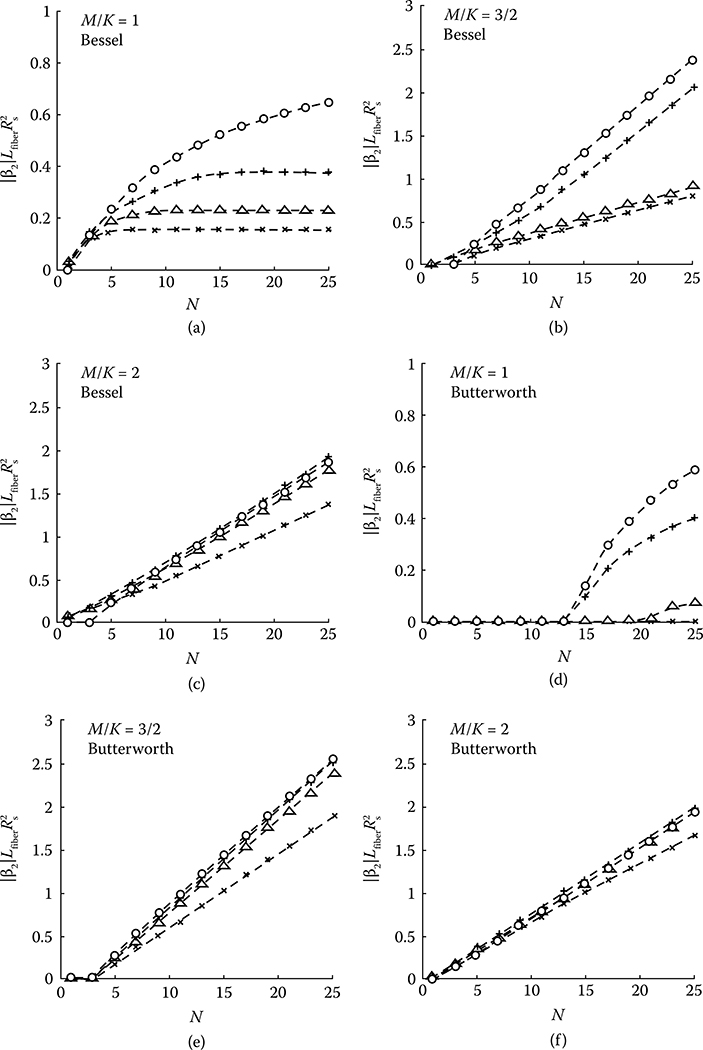
FIGURE 13.10 Maximum allowable CD versus the number of equalizer taps N for a 2 dB power penalty at an input SNR of 20 dB per symbol for RZ and NRZ pulse shapes, using a Bessel antialiasing filter; “Δ” denotes transmission using NRZ pulses; “x” denotes 33% RZ; “Δ” denotes 50% RZ; and “+” denotes 67% RZ, by fractional spaced equalizer (FSE) and sampling rate Rs = 1/T = M/KTs; Ts = symbol_period, where M/K is the fractional ratio) (a) M/K = 1, (b) 1.5, (c) 2, (d), (e), and (f) using a Butterworth antialiasing filter (Adopted from E. Ip and J. M. Kahn, IEEE J. Lightwave Technol., Vol. 25, No. 8, p. 2033, 2007, with permission). The modulation scheme is ASK with NRZ and RZ pulse shaping. N = number of taps of the equalizer.
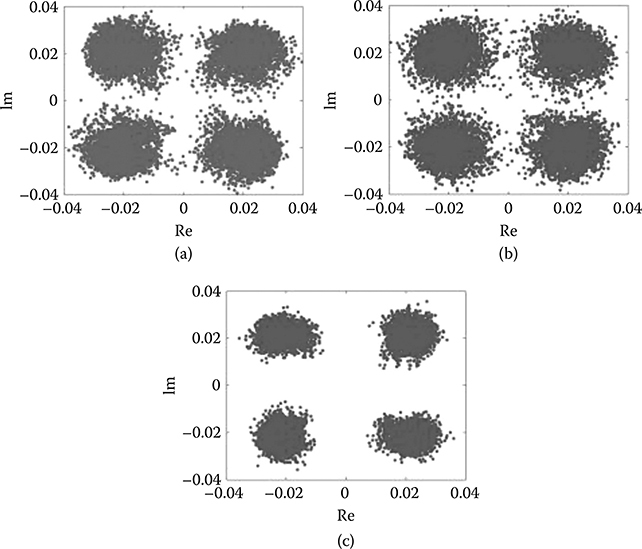
FIGURE 13.11 Constellation of QPSK scheme as monitored at (a) with linear CD equalization only, (b) nonlinear phase noise compensation, and (c) after back propagation processing combined with linear equalization. (Simulation results extracted from E. Ip and J. M. Kahn, IEEE J. Lightwave Technol., Vol. 26, No. 20, p. 3416, 2008.)

FIGURE 13.12 Phase errors at the receiver versus launched power or 25 × 80 km multispan QPSK at 21.4 GSy/s. Performance of back propagation phase rotation per span for 21.4 Gbps 50% RZ-QPSK transmitted over 25 × 80 km spans of SMF with five ROADMs, with 10% CD under-compensation using fractionally spaced equalizer with M/K factor of 1.5 to 4. (Simulation results extracted from E. Ip and J. M. Kahn, IEEE J. Lightwave Technol., Vol. 26, No. 20, p. 3416, 2008. With permission.)
13.3 16QAM Systems
Consider the 16QAM received symbol signal whose phase Φ denotes the phase offset. The symbol dk denotes the magnitude of the QAM symbols, and nk denotes the noises superimposed on the symbol at the sampled instant. The received symbols can be written as
Using the maximum-likelihood sequence estimator (MLSE), the phase of the symbol can be estimated as
or effectively one would take the summation of the contribution of all states of the 16QAM on the considered symbol measured as the geometrical distance on a natural logarithmic scale with the noise contribution of a standard deviation σ.
The frequency offset estimation for 16QAM can be conducted by partitioning the 16QAM constellation into a number of basic QPSK constellations, as shown in Figure 13.13 [4]. There are two QPSK constellations in the 16QAM whose symbols can be extracted from the received sampled data set. They are then employed to estimate the phase of the carrier, as described in the previous section on carrier phase estimation for QPSK-modulated transmission systems. At first, a selection of the innermost QPSK constellation is done and this is classified as class I symbols. Then an estimation of the frequency offset of the 16QAM transmitted symbols can be derived from this constellation. Thence, an frequency offset (FO) compensation algorithm is conducted. Thence, the phase recovery of all 16QAM symbols can be derived. Further confirmation of the difference of carrier phase recovery or estimation can be conducted with the constellation of class I, as indicated in Figure 13.13a.
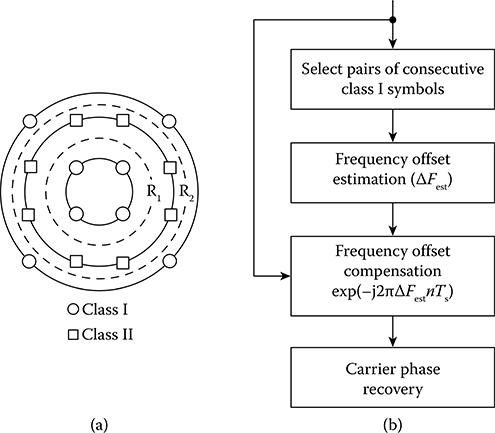
FIGURE 13.13 Processing of 16QAM for carrier phase estimation (From I. Fatadin and S. J. Savory, IEEE Photon. Technol. Lett., Vol. 23, No. 17, pp. 1246–1248, 2001.); (a) constellation of 16QAM and (b) processing for carrier phase recovery with classes I and II of circulator subconstellation.
Carrier phase recovery based on the Viterbi-Viterbi algorithm on the class I QPSK subconstellation of the 16QAM may not be sufficient, and hence a modified scheme has been reported by Fatadin et al. in Ref. [7]. Further refining of this estimation of the carrier phase for 16QAM by partition and rotating is done, in order to match certain symbol points to those of class I constellation of the 16QAM. The procedures are as shown in the flow diagram of Figure 13.14.
Conduct the partition into different classes of constellation and then rotate class 2 symbols with an angle, either clockwise or anticlockwise of ±θrot = π/4 − tan−1 (1/3). In order to avoid opposite rotation with respect to the real direction, the estimation of the error in the rate of changes of the phase variation or frequency estimation can be found by the use of the fourth power of the argument of the angles of two consecutive symbols, given by
to check their quadratic mean. Then select the closer symbol, and then apply the standard Viterbi-Viterbi procedure. Louchet et al. [8] also employed a similar method and have confirmed the effectiveness of such a scheme. The effects on the constellation of the 16QAM due to different physical phenomena are shown in Figure 13.15 [4]. Clearly, the FO would generate the phase noises in (a), influencing both (i) the I and Q components by the CD of small amounts (so as to see the constellation noises), and (ii) the delay of the polarized components on the I and Q components. These distortions of the constellation allow practical engineers to assess the validity of algorithms that are normally separate and independent and implemented in a serial mode. This is in contrast to the constellations illustrated for QPSK as shown in Figure 13.8. Figure 13.16 also shows the realtime signals that result from the beating of the two sinusoidal waves of FO beating in a real-time oscilloscope.
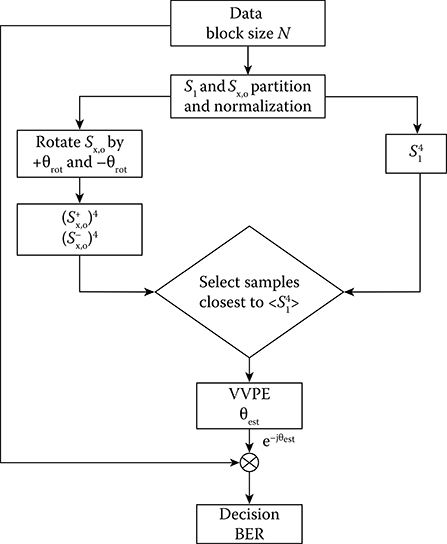
FIGURE 13.14 Flow chart of the refined carrier phase recovery algorithm of 16QAM by rotation of class I and class II subconstellations.

FIGURE 13.15 16QAM constellation under influence; (a) phase rotation due to FO of 1 MHz and no amplitude distortion, (b) residual CD impairment, (c) DGD of PMD effect, and (d) total phase noises effect (From I. Fatadin and S. J. Savory, IEEE Photon. Technol. Lett., Vol. 23, No. 17, pp. 1246–1248, 2001.)
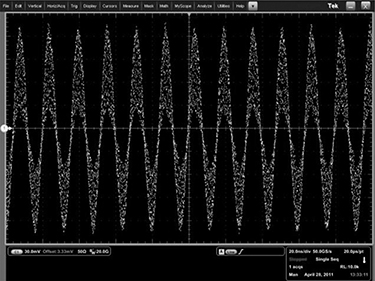
FIGURE 13.16 Beating signals of the two mixed lasers as observed by real-time sampling oscilloscope.
Noe et al. [9] has simulated the carrier phase recovery for QPSK with polarization division-multiplexed (PDM) channels under constant modulus algorithm (CMA) and decision-directed (DD) feedback with and without modification in which the error detected in each stage would be updated. The transmission system under consideration is a back-to-back (BTB) connection in which white Gaussian noises and phase noises are superimposed on the signals, then the BER is measured with the variation of the signal average optical power. For an OSNR of 11 dB, the CMA with modification offers a BER of 1e−3, while it is 4e−2 for a CMA without modification. This indicates that the updating of the matrix coefficients is very critical to recover the original data sequence. The modified CMA was also recognized to be valid for 16QAM.
13.4 Terabits/Second Superchannel Transmission Systems
13.4.1 Overview
PDM-QPSK has been exploited as 100 Gbps long-haul-transmission commercial systems, the optimum technologies for 400 Gigabit Ethernet (GE) and/or Terabit Ethernet (TE) transmission for next-generation optical networking, and they have now attracted significant interest for deploying ultra-high-capacity systems over the global Internet backbone networks. Furthermore intense research on Tbps capacity transmission systems has also attracted interests from several research groups, especially when the bit rates reach several 100 Gbps. The development of hardware platforms for 1 to N Tbps is critical for proving the design concept. The Tbps level can be considered as a superchannel that is defined as an optical channel comprising a number of subrate subchannels whose spectra would be the narrowest allowable. Thus, in order to achieve efficient spectral efficiency, phase shaping is required, and one of the most efficient techniques is the Nyquist pulse shaping. Thus, Nyquist-QPSK can be considered as one of the most effective formats for the delivery of high spectral efficiency that is effective in coherent transmission and reception as well as for equalization at both transmitting and reception ends.
Thus, in this section, we describe in detail the design and experimental platform for delivery of Tbps speeds using Nyquist-QPSK at a symbol rate of 28–32 GSa/s and ten subcarriers. The generation of subcarriers has been demonstrated using either recirculating frequency shifting (RFS) or nonlinear driving of an I–Q modulator to create five subcarriers per main carrier, and thus two main carriers are required. Nyquist pulse shaping is used for effectively packing multiplexed channels whose carriers are generated by the comb generation technique. Digital-to-analog converters (DACs) with sampling rates varying from 56 G to 64 GS/s is used for generating the Nyquist pulse shape, including the equalization of the transfer functions of the DAC and optical modulators.
13.4.2 Nyquist Pulse and Spectra
The raised-cosine filter is an implementation of a low-pass Nyquist filter, that is, one that has the property of vestigial symmetry. This means that its spectrum exhibits odd symmetry about 1/2Ts, where Ts is the symbol period. Its frequency-domain representation is a “brick-wall-like” function, given by
This frequency response is characterized by two values: β, the roll-off factor, and Ts, the reciprocal of the symbol rate in Sym/s—that is, 1/2Ts is the half bandwidth of the filter. The impulse response of such a filter can be obtained by analytically taking the inverse Fourier transformation of Equation 13.4, in terms of the normalized sin c function, as
where the roll-off factor, p, is a measure of the excess bandwidth of the filter, that is, the bandwidth occupied beyond the Nyquist bandwidth as from the amplitude at 1/2T. Figure 13.17 depicts the frequency spectra of raised-cosine pulse with various roll-off factors. Their corresponding time- domain pulse shapes are given in Figure 13.18.
When used to filter a symbol stream, a Nyquist filter has the property of eliminating ISI, as its impulse response is zero at all nT (where n is an integer), except when n = 0. Therefore, if the transmitted waveform is correctly sampled at the receiver, the original symbol values can be recovered completely. However, in many practical communications systems, a matched filter is used at the receiver, so as to minimize the effects of noises. For zero ISI, the net response of the product of the transmitting and receiving filters must equate to H(f), and thus we can write
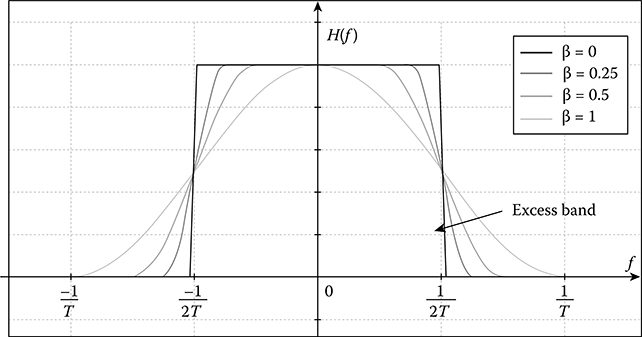
FIGURE 13.17 Frequency response of raised-cosine filter with various values of the roll-off factor β.
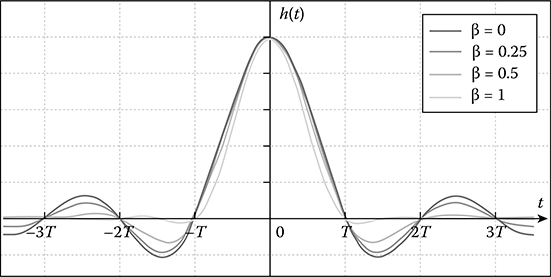
FIGURE 13.18 Impulse response of raised-cosine filter with the roll-off factor β as a parameter.
or alternatively we can rewrite that
The filters that can satisfy the conditions of Equation 13.7 are the root-raised-cosine (RRC) filters. The main problem with RRC filters is that they occupy a larger frequency band than that of the Nyquist sin c pulse sequence. Thus, for the transmission system, we can split the overall raised-cosine filter with RRC filter at both the transmitting and receiving ends, provided the system is linear. This linearity is to be specified accordingly. An optical fiber transmission system can be considered to be linear if the total power of all channels is under the nonlinear SPM threshold limit. When it is over this threshold, a weakly linear approximation can be used.
The design of a Nyquist filter influences the performance of the overall transmission system. Oversampling factor, selection of roll-off factor for different modulation formats, and finite impulse response (FIR) Nyquist filter design are the key parameters to be determined. If taking into account the transfer functions of the overall transmission channel including fiber, wavelength selective switch (WSS), and the cascade of the transfer functions of all optical to electrical (O/E) components, the total channel transfer function is more Gaussian-like. To compensate for this effect, in the Tx-DSP, one would thus need a special Nyquist filter to achieve the overall frequency response equivalent to that of the rectangular or raised cosine with the roll-off factor shown in Figures 13.19 and 13.20.
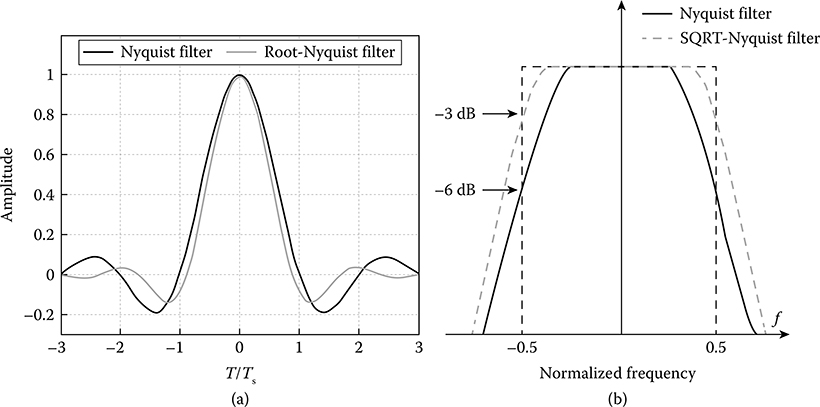
FIGURE 13.19 (a) Impulse and (b) corresponding frequency response of sin c Nyquist pulse shape or root-raised-cosine (RRC) Nyquist filters.
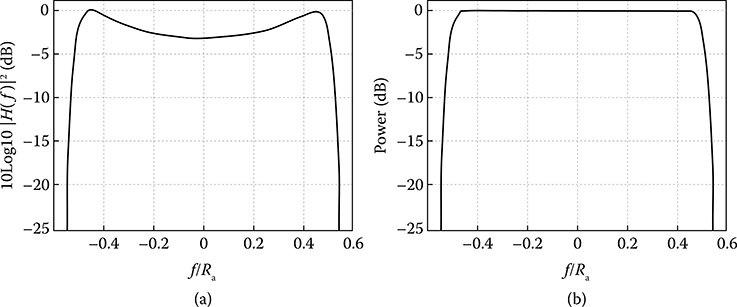
FIGURE 13.20 (a) Desired Nyquist filter for spectral equalization; (b) output spectrum of the Nyquist-filtered QPSK signal.
13.4.3 Superchannel System Requirements
13.4.3.1 Transmission Distance
As the next generation of backbone transport, the transmission distance should be comparable to that of the previous generation, namely the 100 Gbps transmission system. As the most important requirement, we require the 1 Tbps transmission for long-haul to be 1500–2000 km, and for metro applications to be ~300 km.
13.4.3.2 CD Tolerance
Since the SSMF fiber CD factor/coefficient of 16.8 ps/nm is the largest among the currently deployed fibers, CD tolerance should be up to 30,000 ps/nm at the central channel whose wavelength is approximately 1550 nm. At the edge of C-band, this factor is expected to increase by about 0.092 ps/(nm2.km), or about 32,760 ps/nm at 1560 nm and 26,400 ps/nm at 1530 nm [10].*
13.4.3.3 PMD Tolerance
The worst case of deployed fiber of 2000 km would have a differential group delay (DGD) of 75 ps, or about three symbol periods for 25 GSy/s per subchannel. Hence, the PMD (mean all-order DGD) tolerance is 25 ps.
13.4.3.4 SOP Rotation Speed
According to the 100 Gbps experiments, state-of-polarization (SOP) rotation can be up to 10 KHz, and we take the same spec as the 100 G system.
13.4.3.5 Modulation Format
PDM-QPSK for long-haul transmission; PDM-16QAM for metro application.
13.4.3.6 Spectral Efficiency
Compared to the 100 G system with an increasing of factor 2, both Nyquist-WDM and coherent OFDM (CO-OFDM) can fulfill this. However, it depends on technological and economical requirements that would determine the suitability of the technology for optical network deployment.
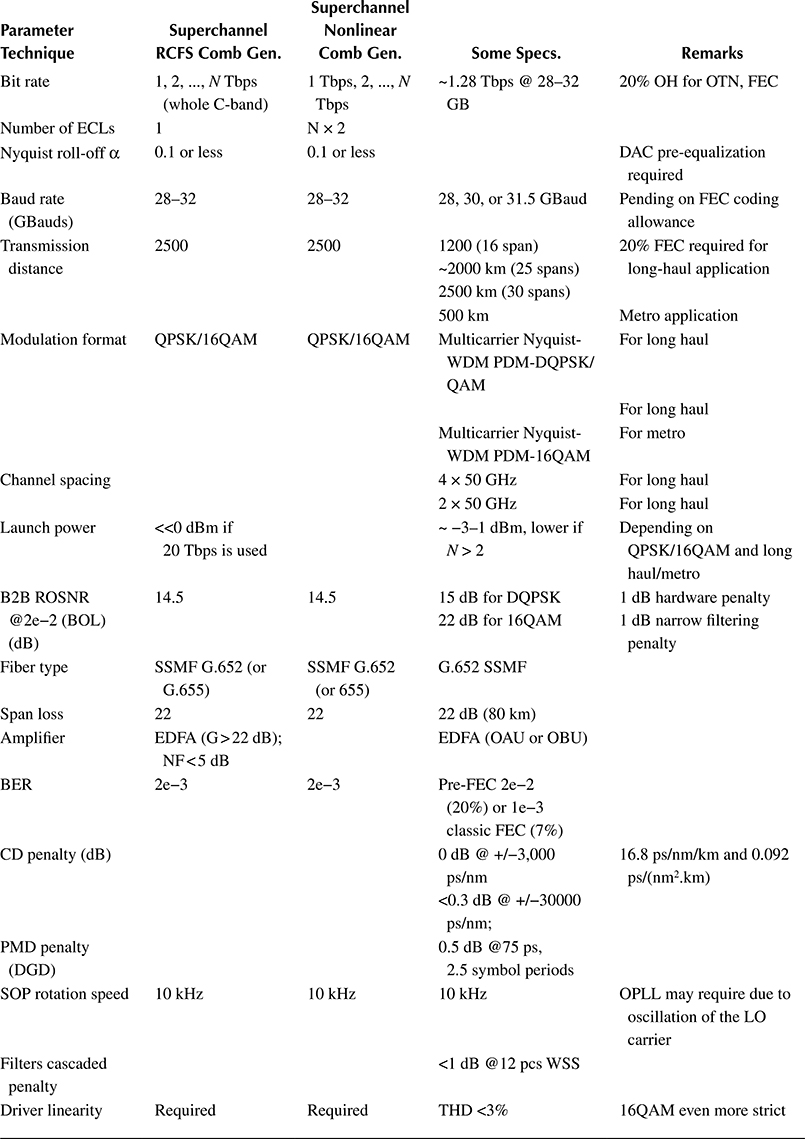
Table 13.1 tabulates the system specifications of various transmission structures with parameters of subsystems, especially when the comb generators are employed using either recirculating or nonlinear generation techniques. The DSP-reception and off-line DSP is integrated in these systems.
TABLE 13.1
1 Tbps Off-Line System Specifications
13.4.4 System Structure
13.4.4.1 DSP-Based Coherent Receiver
A possible structure of a superchannel transmission system can be depicted in Figure 13.21. At the transmitter, the data inputs can be inserted into the pulse shaping, and individual data streams can be formed. A DAC can be used for shaping the pulse to a Nyquist-equivalent shape, the raised-cosine form whose spectra also follow a raised cosine with the roll-off factor β varying from 0.1 to 0.5. If this off factor takes the value of 0.1, the spectra would follow an approximate shape of a rectangular brick wall. A comb generator can be used to generate equally spaced subcarriers for the superchannel from a single-carrier laser source, commonly an ECL of very narrow band of linewidth of about 100 KHz. These comb-generated subcarriers (see Figure 13.22) are then demultiplexed into subcarriers and fed into a bank of I–Q optical modulators (as described in Chapter 3), and Nyquist-pulse shape sequence as output of the DAC are then employed to modulate these subcarriers to form the superchannels at the output of an optical multiplexer shown in the block at the left side of Figure 13.21. A more detailed view of the transmitter for superchannels is shown in Figure 13.23. It is noted that the generation of the sub-carriers from a comb source can be implemented by recirculating of the frequency shifted lightwaves around an optical close loop. The frequency shift is the spacing frequency between the subcarriers. Hence, the Nth subcarrier would be the Nth time circulation of the original carrier. There would be superimposing of noises due to the ASE incorporated in the loop, and this would be minimized by inserting into the loop an optical filter whose bandwidth would be the same or wider than that of the superchannel.
The fiber transmission line is an optically amplified optical fiber multispan without incorporating any dispersion-compensating fibers. Thus, the transmission is very dispersive. The broadening of a 40-ps-width pulse would spread across at least 80–100 symbol period after propagating over 3000 km of SSMF. Thus, one can assume that the pulse launched into the fiber of the first span would be considered to be an impulse as compared to that after 3000 km of SSMF propagation.
After propagation over the multispan non-DCF line, the transmitted subchannels are demuxed via a wavelength splitter into individual subchannels, with minimum crosstalk. Each subchannel is then coherently mixed with an LO that is generated from another comb source incorporating an OPLL to lock the comb into that of the subcarriers of the superchannel. Thus, a comb generator is indicated in the right side, the reception system of Figure 13.21. The coherently mixed subchannels are then detected by a balanced receiver (as described in Chapter 4 and Section 2 of this chapter), and then electronically amplified and fed into the sampler and ADC. The digital signals are then processed in the DSP of each subchannel system or parallel and interconnected DSP system. In these DSP systems, the sequence of the processing algorithms is employed to recover the carrier phase, and hence the clock recovery, compensating for the linear and nonlinear dispersion, and the evaluation of the BER versus different parameters such as OSNR, etc. Figure 13.24 shows the modulated spectra of five channels whose subcarriers are selected from the multiple subcarrier source of Figure 13.22. The modulation is QPSK with Nyquist pulse shaping.
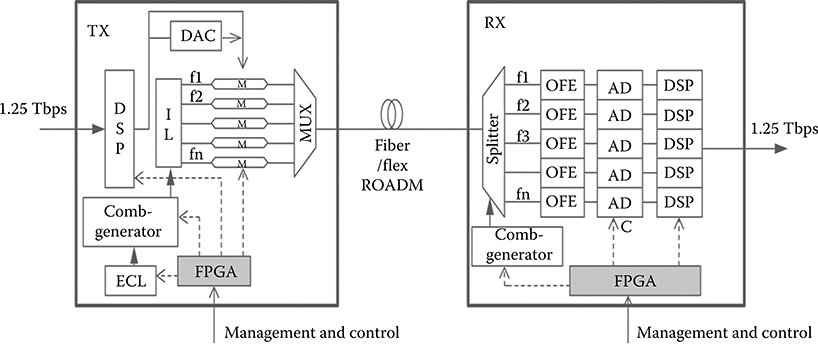
FIGURE 13.21 A possible structure of superchannel Tbps transmission system.
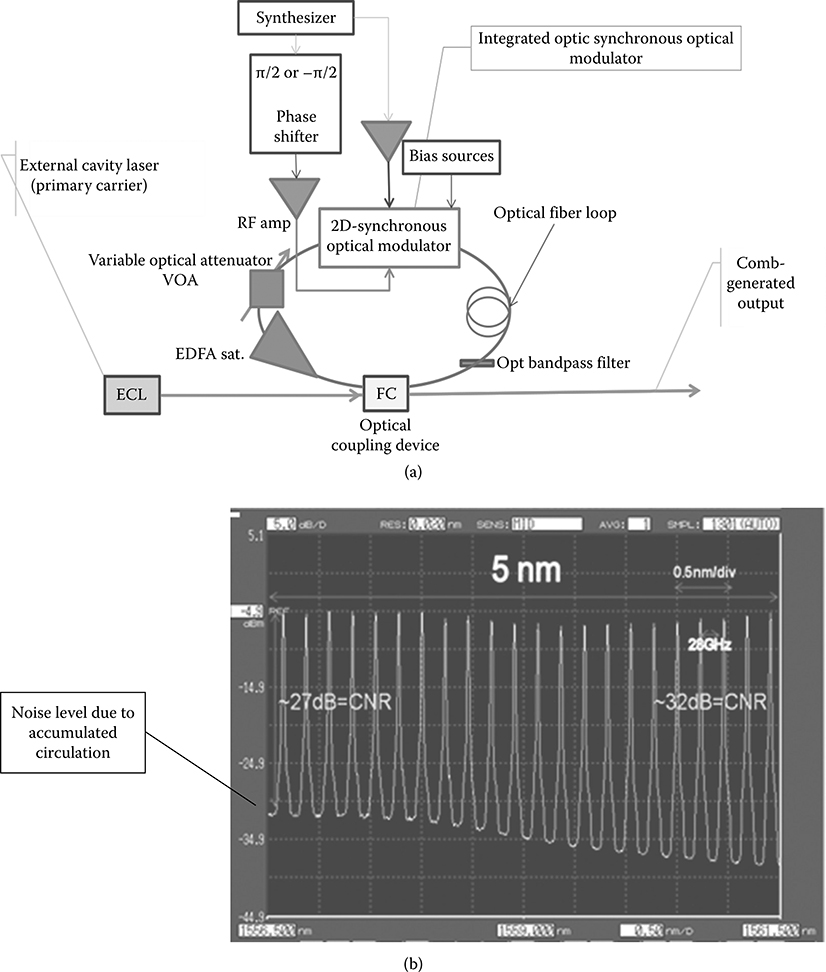
FIGURE 13.22 (a) Block diagram of a recirculating frequency-shifting comb generator and (b) a typical generated spectrum of the comb generator, with 28 GHz spacing between channels over more than 5 nm in the spectral region and about 30 dB carrier-to-noise ratio (CNR).
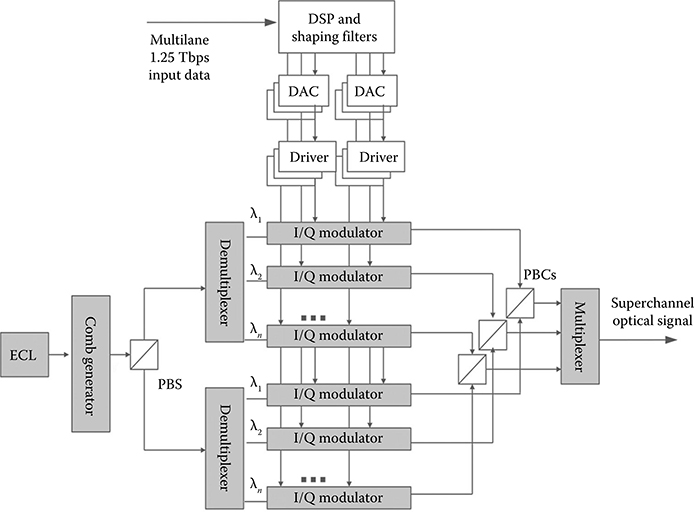
FIGURE 13.23 Generic detailed architecture of a superchannel transmitter. Generic schematic structure of optical recirculating and frequency shifting loop, and spectrum of superchannel. PBC = polarization beam combiner, PBS = polarization beam splitter, I/Q = in-phase–quadrature phase, DAC = digital-to-analog convertor, ECL = external cavity laser.
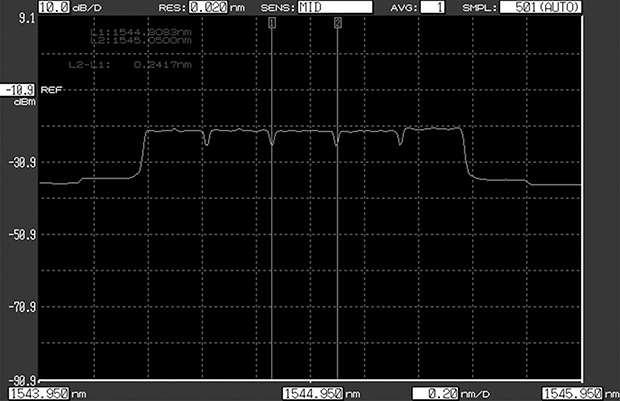
FIGURE 13.24 Selected five subcarriers with modulation.
13.4.4.2 Optical Fourier Transform–Based Structure
Superchannel transmission systems can also be structured using optical fast Fourier transform (OFFT), as demonstrated in Ref. [11,12] and shown in Figure 13.25, in which MZDI components (see Figure 13.25a) act as spectral filter and splitter (see Figure 13.25b), the optical FFT. The outputs of these MZDI are then fed into coherent receivers and processed digitally, as shown in Figure 13.25c, with the electroabsorption modulator (EAM) performing the switching function to time demultiplex the ultra-fast signal speed to a number of lower rate sequences so that the detection system can decode and convert to the digital domain for further processing.

FIGURE 13.25 Operations by guided wave components using fiber optics; (a) guided wave optical path of a Mach–Zehnder delay interferometer or asymmetric interferometer with phase delay tunable with thermal or electro-optic effects, (b) block diagram representation, (c) implementation of optical FFT using cascade stages of fiber optical MZDI structure, and (d) EAM is the electroabsorption modulator used for demultiplexing in the time domain. (Extracted from D. Hillerkuss et al., Nat. Photonics, Vol. 5, p. 364, 2011.). Note also the phase shifters employed in MZDIs between stages. Inserts are the spectra of optical signals at different stages, as indicated of the optical FFT (serial type). EAM = electroabsorption modulator used for demultiplexing in the time domain; PC = polarization controller.
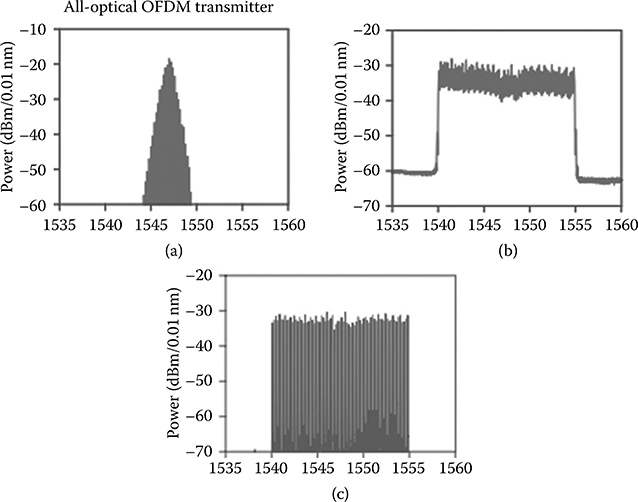
FIGURE 13.26 Spectrum of superchannels and demuxed channels. All subchannels are orthogonal, and thus the name orthogonal frequency division multiplexing (OFDM); (a) at output of transmitter, (b) after fiber propagation, and (b) after polarization demux. (Extracted from I. Fatadin and S. J. Savory, IEEE Photon. Technol. Lett., Vol. 23, No. 17, pp. 1246–1248, 2001. With permission.)
The spectra of superchannels at different positions in the transmission system can be seen in Figure 13.26a through c [4]. It is noted that the pulse shape is Nyquist, and the subchannels are placed close, satisfying the orthogonal condition, and thus the name optical OFDM (orthogonal frequency division multiplexing) is used to indicate this superchannel arrangement.
13.4.4.3 Processing
The processing of superchannels can be considered as similar to the digital processing of individual subchannels, except when there may be crosstalk between subchannels due to overlapping of certain spectral regions between the considered channel and its adjacent channels.
Thus, for the Nyquist-QPSK subchannel, the DSP processing would be much the same as for QPSK-DWDM for 112G described earlier with care taken for overlapping either at the transmitter or at the receiver. The EVM is a parameter that indicates the scattering of the vector formed by I and Q components departing from the center of the constellation point. The variance of this EVM in the constellation plane is used to evaluate the noises of the detected states, thence the Q factor can be evaluated with ease, and thus the BER by using the probability density function and the magnitude of the vector of a state on the constellation plane. The BER of the subchannels of the OFDM superchannel is shown in Figure 13.27b and c [4] for different percentages of overloading due to FEC. The loading factor is important, as this will increase the speed or symbol rate of the subchannel one has to offer. The higher this percentage, the higher is the increase in the symbol rate, thus requiring high-speed devices and components.
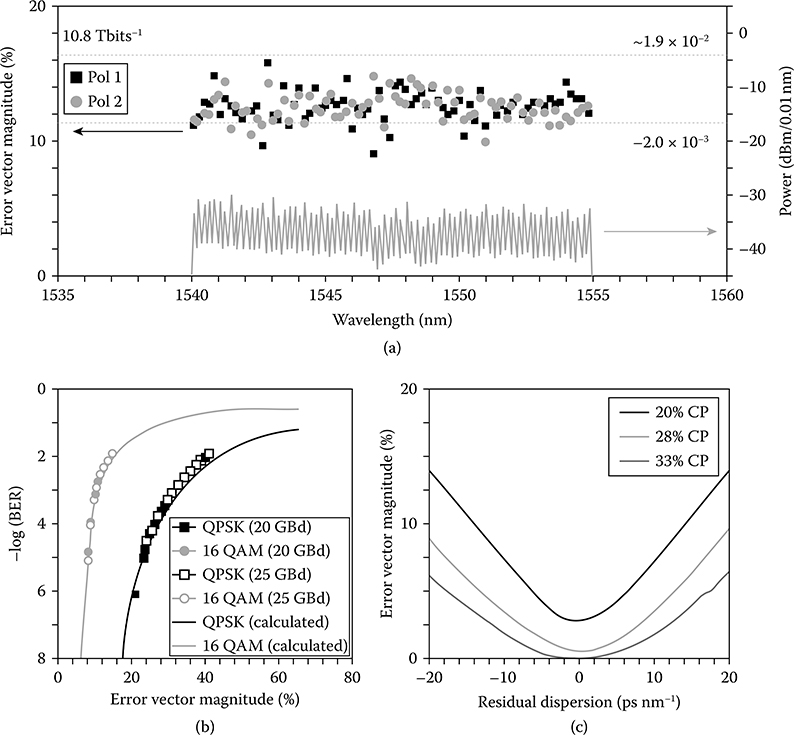
FIGURE 13.27 All-optical 10.8 Tbps OFDM results. (a) Measured error vector magnitude (EVM) for both polarizations (symbols) and for all subcarriers of the OFDM signal decoded with the all-optical FFT. The estimated BER for all subcarriers is below the third-generation FEC limit of 1.9e−2. The optical spectrum far left race, is drawn beneath. (b) Relationship between BER and EVM. Measured points (symbols) and calculated of BER as a function of EVM for QPSK and 16QAM. (c) Tolerance toward residual chromatic dispersion of the implemented system decoded with the eight-point FFT for a cyclic prefix of 20%, 28%, and 33%. (Extracted from I. Fatadin, and S. J. Savory, IEEE Photon. Technol. Lett., Vol. 23, No. 17, pp. 1246–1248, 2001. With permission.)
In the receiver of the optical OFDM superchannel system reported in Ref. [4], the effectiveness of the optical FFT receiver can be evaluated by using three alternative receiver configurations and tested with QPSK signals. A QPSK signal is chosen because it was not possible to receive a 16QAM signal with the alternative receivers owing to their inferior performance [4]. First, a subcarrier with a narrow bandpass filter is used to extract a subchannel. The filter passband is adjusted in for best performance of the received signal (Figures 13.26a and 13.27). The selected filter bandwidth is 25 GHz. The constellation diagram shows severe distortion. When using narrow optical filtering, one has to accept a compromise between crosstalk from neighboring channels (as modulated OFDM subcarriers necessarily overlap) and intersymbol interference (ISI), owing to the increasing length of the impulse response when narrow filters are used. Narrow filters can be used, however, if the ringing from ISI is mitigated by additional time gating. The reception of a subcarrier usinga coherent receiver is then performed. In the coherent receiver, the signal is down-converted in a hybrid coupler, as described in Chapter 5, and detected using balanced detectors and sampled in a real-time oscilloscope. Using a combination of error low-pass filtering due to the limited electrical bandwidth of the oscilloscope and DSP, the subcarrier is extracted from the received signal. This receiver performs better than the filtering approach, but a larger electrical bandwidth and sampling rate of the ADC and additional DSP would be needed to eliminate the crosstalk from other subcarriers and then to achieve a performance similar to that of the optical FFT.
Thus, optical OFDM may offer significant advantages for superchannels, but additional processing time would be required, while for Nyquist-QPSK, superchannels allow better performance and less complexity in the receiver DSP subsystem structure.
13.4.5 Timing Recovery in Nyquist QAM Channel
Nyquist pulse shaping is one of the most efficient methods to pack adjacent subchannels into a super-channel. The timing recovery of such Nyquist subchannels is critical for sampling the data received and for improving the transmission performance. Timing recovery can be done either before or after the PMD compensator. The phase detector scheme is shown in Figure 13.28, a Godard type [13] that is a first-order linear scheme. After CD compensation (CD−1 blocks), the signal is sent to an SOP modifier to improve the clock extraction. The clock performance of NRZ-QPSK signal in the presence of a first-order PMD characterized by a DGD and azimuth is presented in Figure 13.3. The azimuth of 45° and DGD of a half-symbol/unit interval (UI) completely destroys the clock tone. Therefore, the SOP modifier is required for enabling the clock extraction. In practical systems, a raised-cosine filter is used to generate Nyquist pulses instead of the Sinc shape type. A filter pulse response is defined by two parameters, the roll-off factor β and the symbol period Ts, and described by taking the inverse Fourier transform of Equation 13.4. The Godard phase detector cannot recover the carrier phase even with small β, and thus the channel spectra is close to rectangular. A higher-order phase detector must be used to effectively recover the timing clock period, as shown in Ref. [14]. A quadratic-power law PD (4PDP) with prefiltering presented in Ref. [15], as shown in Figure 13.28b, can deal with small β values.
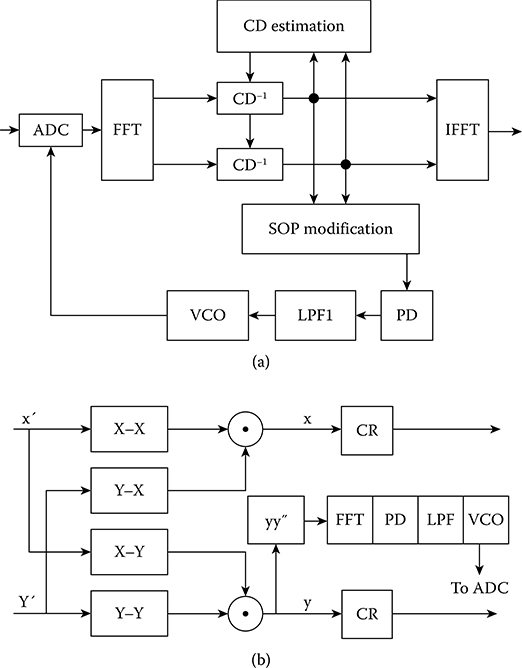
FIGURE 13.28 (a) Godard phase detector algorithm and (b) fourth-order 4PPD. VCO = voltage control oscillator, FFT = fast Fourier transform, IFFT = inverse FFT, CD = chromatic dispersion, SOP = state of polarization.
The 4PDP operates by first splitting and forming the combination of these components X- and Y-polarized channels. It then detects the clock frequency by phase recovery and by regenerating through the VCO the frequency shift required for the ADC to assure the correct sampling timing by processing the received samples.
The use of such a phase detector in coherent optical receivers requires a large hardware effort. Due to PMD effects, the direct implementation of this method before PMD compensation is almost impossible. Therefore, the 4PPD implementation in the frequency domain after the PMD compensation is proven to be the most effective and performing well even in the most extreme cases with roll-off factor equal to zero.
13.4.6 128 Gbps 16QAM Superchannel Transmission
An experimental setup by Dong et al. [16] was reported for the generation and transmission of six channels carrying 128 Gbit/s under PDM-16QAM modulation format. The two 16-GBaud electrical 16QAM signals are generated from the two arbitrary waveform generators. Laser sources at 1550.10 nm and the second source with a frequency spacing of 0.384 nm (48 GHz) are generated from two ECLs, each with a linewidth less than 100 kHz and an output power of 14.5 dBm, respectively. Two I/Q MODs are used to modulate the two optical carriers with I and Q components of the 64-Gbps (16-GBaud) electrical 16QAM signals after the power amplification using four broadband electrical amplifiers/drivers, respectively. Two phase shifters with a bandwidth of 5 KHz–22.5 GHz provide two-symbol extra delay to decorrelate the identical patterns. For the operation to generate 16QAM, the two parallel Mach–Zehnder modulators (MZMs) for I/Q modulation are both biased at the null point and driven at full swing to achieve zero-chirp and phase modulation. The phase difference between the upper and the lower branch of I/Q MZIM is also controlled at the null point. The data input is shaped so that about 0.99 roll-off factor of raised-cosine pulse shape can be generated.
The power of the signal is boosted using polarization-maintaining EDFAs. The transmitted optical channels are mixed with an LO and polarization demultiplexed via a π/2 hybrid coupler, and then the I and Q components are detected by four pairs of balanced photodetectors (PDP). They are then transimpedance amplified and resampled.
The sampled data are then processed in the following sequence: CD compensation, clock recovery, then resampling and going through classical CMA, a three-stage CMA, frequency offset compensation, a feed-forward phase equalization, LMS equalizer (LMSE), and then differentially detected to avoid cycle slip effects.
Furthermore, the detailed processing [17] for the electrical polarization recovery is achieved using a three-stage blind equalization scheme: (1) first, the clock is extracted using the “square and filter” method, and then the digital signal is resampled at twice the baud rate based on the recovery clock; (2) second, a T/2-spaced time-domain FIR filter is used for the compensation of CD, where the filter coefficients are calculated from the known fiber CD transfer function using the frequency-domain truncation method; (3) third, adaptive filters employing two complex-valued, 13 tap coefficients and partial T/2-space are employed to retrieve the modulus of the 16QAM signal.
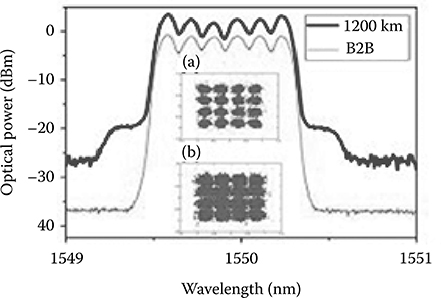
FIGURE 13.29 Spectra of Nyquist channels, 6 × 128 G PDM 16QAM B2B and 1200 km transmission.
The two adaptive FIR filters are based on the classic CMA and followed by a three-stage CMA to realize multimodulus recovery and polarization demultiplexing. The carrier recovery is performed in the subsequent step, where the fourth power is used to estimate the frequency offset between the LO and the received optical signal. The phase recovery is obtained by feed-forward and LMS (least- mean-square) algorithms for local oscillator frequency offset (LOFO) compensation. Finally, differential decoding is used for improving the BER. This is also implemented in the DSP sub-systems incorporated in the receiver.
The spectra of the six Nyquist channels under BTB and 1200 km SSMF transmission are shown in Figure 13.29. It is noted that all even channels are shaped with 0.01 roll-off Nyquist filters, we do not observe the flatness of individual channels in the diagram. The constellation as expected would require significant amounts of equalization and processing.
On average, the achieved BER of 2e−3 with a launched power of −1 dBm over 1200 km SSMF nondispersion compensation link was demonstrated by the authors of Ref. [17]. The link is determined by a recirculating loop consisting of four spans, with each span length of 80 km SSMF and an in-line EDFA. WSS is employed wherever necessary to equalize the average power of the subchannels. The optimum launched power is about -1 dBm for the six-subchannel superchannel transmission.
13.4.7 450 Gbps 32QAM Nyquist Transmission Systems
Further spectral packing of subchannels in a superchannel can be done with Nyquist pulse shaping and predistortion or pre-equalization at the transmitting side. Zhou et al. [18] has recently demonstrated the generation and transmission of 450 Gbps WDM channels over the standard 50 GHz ITU-T grid optical network at a net spectral efficiency of 8.4 b/s/Hz. This result is accomplished by the use of Nyquist-shaped, polarization-division-multiplexed (PDM) 32QAM, or 5 bits/symbol × 2 (polarized modes) × 45 GSy/s to give 450 Gbps. Both pre- and posttransmission digital equalization techniques are employed to overcome the limitation of the DAC bandwidth. Nearly ideal Nyquist pulse shaping with a roll-off factor of 0.01 allows guard bands of only 200 MHz between subcar-riers. To mitigate the narrow optical filtering effects from the 50-GHz-grid reconfigurable optical add-drop multiplexer (ROADM), a broadband optical pulse-shaping method is employed. By combining electrical and optical shaping techniques, the transmission of 5 × 450 Gbps PDM-Nyquist 32QAM on the 50 GHz grid over 800 km and one 50-GHz-grid ROADM was proven with soft DSP equalization and processing. The symbol rate is set at 28 GSy/s.
It is noted that the transmission SSMF length is limited to 800 km due to the reduced Euclidean geometrical distance between constellation points of 32QAM and by avoiding the accumulated ASE noises contributed by EDFA in each span, Raman optical amplifiers with distributed gain are used in a recirculating loop of 100 km ultra-large-area fibers. The BER performance for all five subchannels is shown in Figure 13.30a, with inserts of the spectra of all subchannels. Note the near-flat spectrum of each subchannel that indicates the near-Nyquist pulse shaping. Figure 13.30b and c show the spectra of a single subchannel before and after WSS, with and without optical filtering that performs as spectra shaping [18]. The original pulse shape can be compared with that displayed in Figure 1.15 in Chapter 1. Further to this published work, Zhou et al. have also time-multiplexed 64QAM and transmitting over 1200 km [19], that is, three circulating around the ring of 400 km of 100 km span incorporating Raman amplification. About 5 dB penalty between 32QAM and 64QAM in receiver sensitivity at the same FEC BER of 6e−3 is obtained. Note that electrical time division multiplexing of digital sequences from the arbitrary waveform generators was implemented by interleaving, so that higher symbol rates can be achieved. Furthermore, a 20% soft decision FEC using quasi-cyclic LDPC code is employed to achieve a BER threshold of 2.4e−2, and thus the 20% extra-overhead is required on the symbol rate.
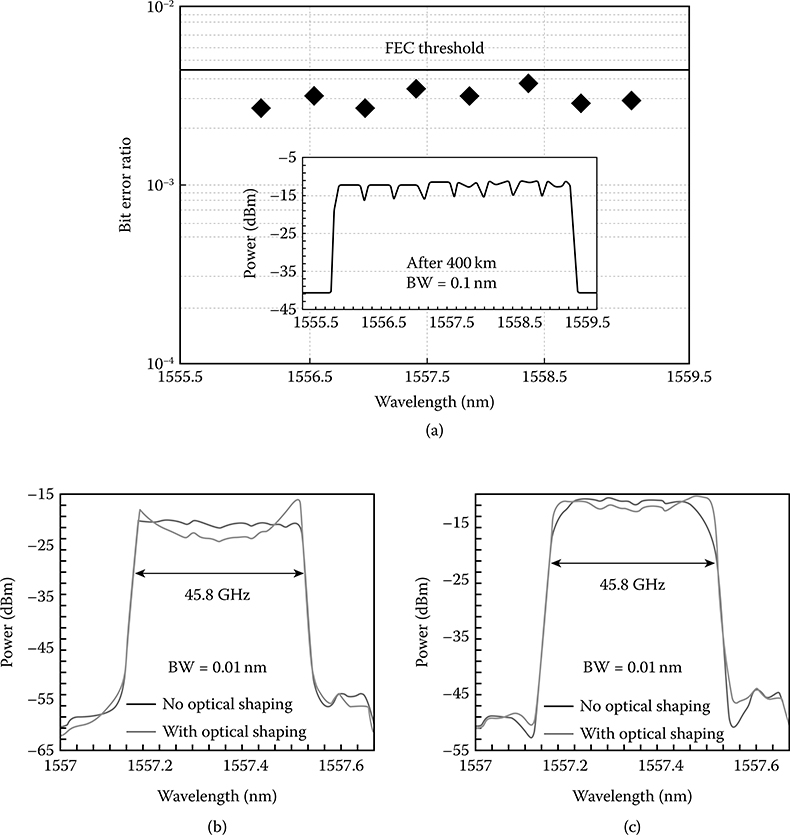
FIGURE 13.30 (a) Spectra of five subchannels of 450 Gbps channel, that is, 5 × 450 Gbps superchannels after 400 km (one loop circulating) of 5 × 80 km plus Raman amplification. BER versus wavelength and FEC threshold at 2.3e–3; (b) spectrum of a single subchannel before; and (c) after WSS with and without optical shaping by optical filters. (Extracted from X. Zhou et al., IEEE J. Lightwave Technol., Vol. 30, No. 4, p. 553, 2012. With permission.) Note: Dark line for original spectra, light line for spectra after spectral shaping.
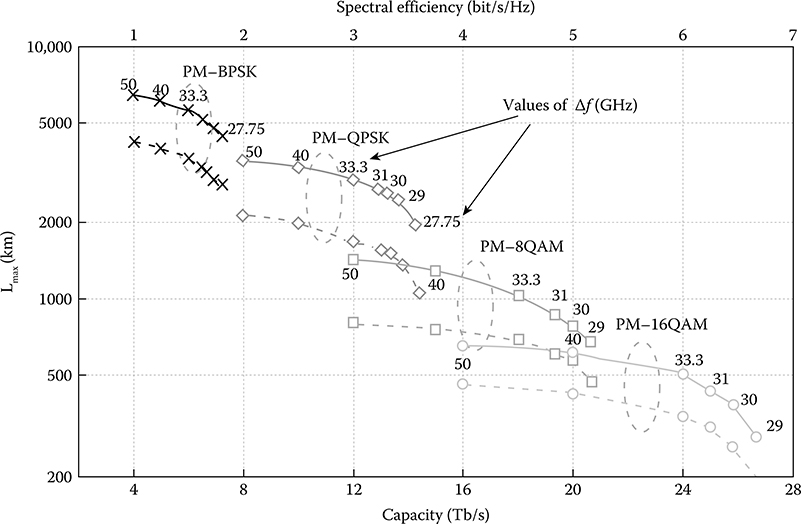
FIGURE 13.31 Transmission reach distance variation with respect to spectral efficiency and total capacity of superchannels. Different QAM schemes are indicated. PM = polarization multiplexing. The numbers are for bandwidth of the subchannel. (Extracted from G. Bosco et al., IEEE J. Lightwave Technol., Vol. 29, No. 1, p. 53, 2011. With permission.)
Simulated results by Bosco et al. [20] without using soft FEC also shows the variation of the maximum reach distance with a BER of 2e–3 for capacity in the C-band (bottom axis) and spectral efficiency for PM-BPSK, PM-QPSK, PM-8QAM, and PM-16QAM, as shown in Figure 13.31 [20] for SSMF non-DCF optical transmission lines, as well as nonzero dispersion-shifted fibers (NZ-DSF) indicated by dashed lines. The design of NZ-DSF was described in Chapter 2.
13.4.8 DSP-Based Heterodyne Coherent Reception Systems
We have so far described optical transmission systems under homodyne coherent reception, that is, when the frequencies of the lightwave carriers and that of the LO are equal. The original motivation of using homodyne detection is to eliminate the 3 dB degradation as compared with heterodyne technique, and this is possible under DSP-based reception algorithm to avoid the difficulties of locking of the LO and the channel carrier. Under the classical heterodyne reception, the “at least” 3 dB loss comes from the splitting of the received signals in the electrical domain, then multiplied by sinusoidal cosine and sine RF oscillator to extract the in-phase and quadrature components.
So far, we have discussed homodyne reception DSP-based optical transmission systems that are considered for extensive deployment in commercial coherent communication systems for 100 G,400 G, 1 T, or beyond. However, under the current progresses of wide bandwidth and high-speed electronic ADCs and photodetectors (PDs), once again, the coherent detection with DSP has made highly possible mitigation of impairments of transmitted channels by compensation and equalization in the sampled electrical domain. As we have seen in the previous sections of this chapter and in Chapter 3, for homodyne detection in polarization division multiplexing (PDM) systems, the I/Q components of each polarization state should be separated in optical domain with full information. Thus, four balanced PD pairs incorporating a photonic dual-hybrid structure and four-channel time-delay synchronized ADCs are required.
By up-converting I and Q components to the intermediate frequency (IF) at the same time, not only can heterodyne coherent detection halve the number of the balanced PDs and ADCs of the coherent receiver, but there is also no need to consider the delays between I and Q components in the PDM signal. Therefore, the four output ports of the optical hybrid can be also halved accordingly. However, this heterodyne technique can possibly be restricted by the bandwidth of the photodetectors (PDs). Furthermore, the external down-conversion of the IF signals may enhance the complexity of the reception system. Currently, the tremendous progresses in increasing the sampling rate and bandwidth of ADCs and PDs give a high possibility to exploit a simplified heterodyne detection. With wide bandwidth PDs and ADCs, the functions such as the down-conversion to the IF,the separation of the in-phase and quadrature signals, and the equalization for the PMD and nonlinear distortion effect, can all be realized in the digital domain that can be implemented in the DSP associated within the receiver sub-systems. A heterodyne detection in the transmission system is a limited 5-Gbps 4-ary quadrature amplitude modulation (4QAM) signal over 20 km in Ref. [21] and limited 20-Mbaud 64 and 128QAM over 525 km in Ref. [22], and then reaching Tbps by Dong et al. [23]. High-order modulation formats, such as PDM-16QAM and PMD-64QAM, offer higher capacity, but may suffer some additional penalty.
For the 100 G or beyond coherent system with required transmission distance shorter than 1000 km, the inferiority of the SNR sensitivity in heterodyne detection is not so obvious. Conversely, less number of ADCs and easy implementation of the DSP for IF down-conversion make heterodyne detection a potential candidate for a 100 G or beyond transmission system. Figure 13.32a [23] shows the schematic diagram of the heterodyne reception with digital processing. The quadrature amplitude-modulated signals are transmitted and imposed onto the π/2 hybrid coupler, which is now simplified, and there is no π/2 phase shifter as compared to the hybrid coupler discussed in Chapter 4 and the previous sections of this chapter. The coherent mixing between the LO and the modulated channel gives the time-domain beating signals which are the information signal envelope under which the carrier is covered within the symbol period. Thus, both the real and imaginary parts appear in the electronic signals produced after the balanced detection in the PDPs in which the beating happens (refer to Figure 13.32b). The electronic currents produced after the PDPs are then amplified via the TIA to produce voltage-level signals that are conditioned to appropriate levels, so that they can be sampled by the ADCs. Thence, doing the FFT will produce a two-sided spectrum that exhibits the frequency shifting of the baseband to the RF or IF frequency. Both the in-phase and quadrature components are embedded in the two-sided spectrum. One sideband of the spectrum can be used to extract the I- and Q- parts of the QAM signals for further processing. Ideally, the compensation of the CD should be done in the first stage, and then followed by the carrier phase recovery and then resampling with correct timing.
The following sequence of processing in the digital domain was conducted: (1) sampling in ADC and conversion from analog voltage level to digital sampled states; (2) FFT to obtain frequency-domain spectrum; then, (3) extract one-sided spectrum and do a frequency shifting to obtain the baseband samples of the spectrum; (4) resampling with two times the sampling rate; hence (5) compensation of CD and (6) carrier phase and clock recovery; (7) using the recovered clock to resample the data sequence; then (8) conducting normal CMA and three-stage CMA to obtain the initial constellation; then (9) frequency equalization of frequency difference of the LO; (10) feed-forward phase equalization, LMS equalization for PMD compensation; and then, finally, (11) differential decoding of the samples and symbol to determine the transmission performance in term of BER versus the variation of the OSNR which is measured at the position located just before the input of the optical receiver.
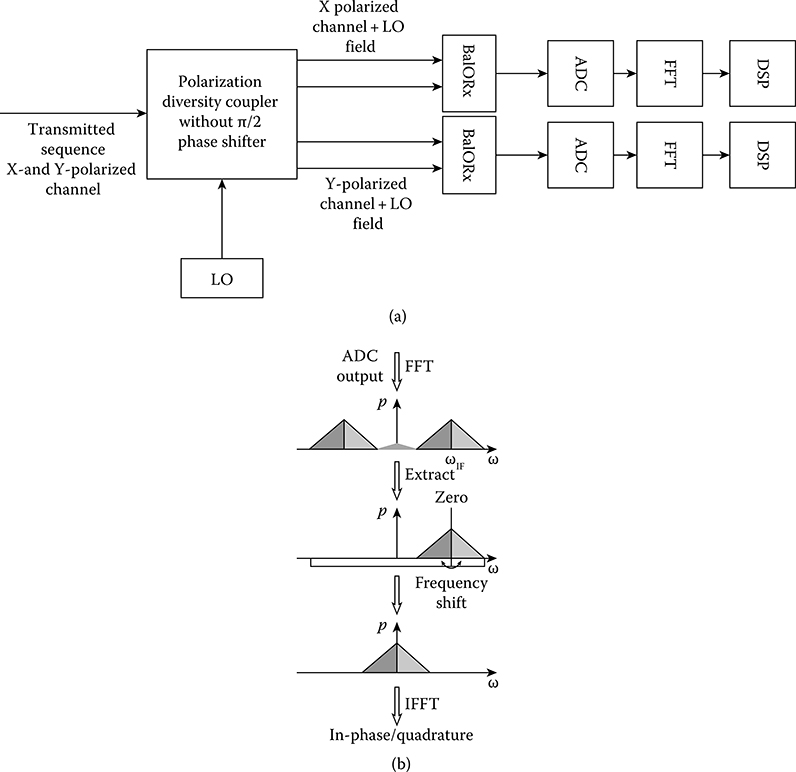
FIGURE 13.32 The principles of heterodyne coherent reception: (a) principal blocks and (b) spectra to recover baseband signals. (Adapted from Z. Dong et al., Opt. Express, Vol. 21, No. 2, p. 1773, 2013.)
It is further noted that, for the equalization based on DSP, a T/2-spaced time-domain FIR filter is used for the compensation of CD. The two complex-valued, 13-tap, T/2-spaced adaptive FIR filters are based on the classic CMA followed by three-stage CMA to realize multimodulus recovery and polarization demultiplexing.
The B2B BER versus the OSNR of the heterodyne reception optical transmission system is shown in Figure 13.33 [23] for PDM-16QAM 128 Gbps per subchannel with different IF and compared with homodyne detection scheme. It is noted that 3 dB penalty can be suffered by the heterodyne detection as compared with homodyne reception because in such detection system, only signals located in either the upper or lower band spectrum is processed. Thus, at a BER of 4e−3, the required OSNR is about 23 dB. The transmission distance is 720 km of SSMF, incorporating EDFA and non-DCF.

FIGURE 13.33 B2B BER versus OSNR of the heterodyne reception system of PDM-16QAM 112 Gbps × 8 superchannel with different IF frequency. (Extracted from Z. Dong et al., Opt. Express, Vol. 21, No. 2, p. 1773, 2013. With permission.)
13.5 Concluding Remarks
The total information capacity transmitted over a single single-mode-fiber has increased tremendously owing to the spectral packing of subchannels by pulse-shaping techniques and DSP algorithms, as well as soft FEC, so as to allow higher orders of modulation QAM to be realized. Thus, digital processing in real time and digitally based coherent optical transmission systems have been proven to be the most modern transmission systems for the global Internet in the near future. The principal challenges now are the realization of application-specific integrated circuits (ASICs) using microelectronics technology or ultra-fast field-programmable gate array (FPGA)-based systems. The concepts of processing in the digital domain have been proven by off-line systems. In real time processing systems, more efficient algorithms are required. These remain topical research topics and engineering issues to pursue. Higher symbol rates may be possible when wider-bandwidth optical modulators and DAC/ADC systems are available, for example, grapheme plasmonic silicon modulators [24] and their integration with microelectronic DAC and ADC, DSP systems.
The processing algorithms for QAM vary from level to level, but they can essentially be based on the number of circles existing in multilevel QAM as compared to a mono-cycle constellation of the QPSK scheme. The algorithms developed for QPSK can be extended and modified for higher-level circular constellations.
References
1. T. E. Bell, Communications: Coherent optical communication shows promise, the FCC continues on its path of deregulation, and satellite communications go high-frequency, IEEE Spectrum, Vol. 23, No. 1, pp. 49–52, 1986.
2. Linear Circuits Inc., From Single Ended to Different Input Trans-Impedance Amplifier, http://circuits.linear.com/267
3. J. S. Weiner, A. Leven, V. Houtsma, Y. Baeyens, Y. K. Chen, P. Paschke, Y. Yang, et al., SiGe differential transimpedance amplifier with 50-GHz bandwidth, IEEE J. Solid-State Circuits, Vol. 38, No. 9, pp. 1512–1517, 2003.
4. I. Fatadin and S. J. Savory, Compensation of frequency offset for 16-QAM optical coherent systems using QPSK partitioning, IEEE Photon. Technol. Lett., Vol. 23, No. 17, pp. 1246–1248, 2001.
5. E. Ip and J. M. Kahn, Digital equalization of chromatic dispersion and polarization mode dispersion, IEEE J. Lightwave Technol., Vol. 25, No. 8, p. 2033, 2007.
6. E. Ip and J. M. Kahn, Compensation of dispersion and nonlinear impairments using digital back propagation, IEEE J. Lightwave Technol., Vol. 26, No. 20, p. 3416, 2008.
7. I. Fatadin, D. Ives, and S. J. Savory, Laser linewidth tolerance for 16-QAM coherent optical systems using QPSK partitioning, IEEE Photon. Technol. Lett., Vol. 22, No. 9, pp. 631–633, 2010.
8. H. Louchet, K. Kuzmin, and A. Richter, Improved DSP algorithms for coherent 16-QAM transmission, in Proceedings of the ECOC’08, paper tu.1.E6, Belgium, September 2008.
9. R. Noe, T. Pfau, M. El-Darawy, and S. Hoffmann, Electronic polarization control algorithms for coherent optical transmission, IEEE J. Sel. Quant. Electron., Vol. 16, No. 5, pp. 1193–1199, 2010.
10. L. N. Binh, Digital Optical Communications, Boca Raton, FL: CRC Press, 2010, chap. 3, Appendix.
11. D. Hillerkuss, R. Schmogrow, T. Schellinger, M. Jordan, M. Winter, G. Huber, and T. Vallaitis, 26 Tbit/s line-rate super-channel transmission utilizing all-optical fast Fourier transform processing, Nat. Photonics, Vol. 5, p. 364, 2011.
12. D. Hillerkuss, M. Winter, M. Teschke, A. Marculescu, J. Li, G. Sigurdsson, and K. Worms, Simple all-optical FFT scheme enabling Tbit/s real-time signal processing, Optics Express, Vol. 18, No. 9, pp. 9324–9340, 2010.
13. N. Godard, Passband timing recovery in an all-digital modem receiver, IEEE Trans. Commun., Vol. 26, pp. 517–523, 1978.
14. N. Stojanovic, N. G. Gonzalez, C. Xie, Y. Zhao, B. Mao, J. Qi, and L. N. Binh, Timing recovery in Nyquist coherent optical systems, in International Conference on Telecommunications Systems, Serbia, 2012.
15. T. T. Fang and C. F. Liu, Fourth-power law clock recovery with pre-filtering, in Proceedings of the ICC, Vol. 2, pp. 811–815, Geneva, Switzerland, 1993.
16. Z. Dong, X. Li, J. Yu, and N. Chi, 128-Gbps Nyquist-WDM PDM-16QAM generation and transmission over 1200-km SMF-28 with SE of 7.47 b/s/Hz, IEEE J. Lightwave Technol., Vol. 30, No. 24, pp. 4000–4006, 2012.
17. Z. Dong, X. Li, J. Yu, and N. Chi, 128-Gbps Nyquist-WDM PDM-16QAM generation and transmission over 1200-km SMF-28 With SE of 7.47 b/s/Hz, IEEE J. Lightwave Technol., Vol. 30, No. 24, pp. 4000–4006, 2012.
18. X. Zhou, L. E. Nelson, P. Magill, R. Isaac, B. Zhu, D. W. Peckham, P. I. Borel, and K. Carlson, PDM-Nyquist-32QAM for 450-Gbps per-channel WDM transmission on the 50 GHz ITU-T grid, IEEE J. Lightwave Technol., Vol. 30, No. 4, p. 553, 2012.
19. X. Zhou, L. E. Nelson, R. Isaac, P. Magill, B. Zhu, D. W. Peckham, P. Borel, and K. Carlson, 1200 km transmission of 50 GHz spaced, 504-Gbps PDM-32-64 hybrid QAM using electrical and optical spectral shaping, in OFC’12, Los Angeles, CA, 2012.
20. G. Bosco, V. Curri, A. Carena, P. Poggiolini, and F. Forghieri, On the performance of Nyquist-WDM terabit superchannels based on PM-BPSK, PM-QPSK, PM-8QAM or PM-16QAM subcarriers, IEEE J. Lightwave Technol., Vol. 29, No.1, p. 53, 2011.
21. R. Zhu, K. Xu, Y. Zhang, Y. Li, J. Wu, X. Hong, and J. Lin, QAM coherent subcarrier multiplexing system based on heterodyne detection using intermediate frequency carrier modulation, in 2008 Microwave Photonics, pp. 165–168, 2008.
22. M. Nakazawa, M. Yoshida, K. Kasai, and J. Hongou, 20 Msymbol/s, 64 and 128 QAM coherent optical transmission over 525 km using heterodyne detection with frequency-stabilized laser, Electron. Lett., Vol. 42, No. 12, pp. 710–712, 2006.
23. Z. Dong, X. Li, J. Yu, and J. Yu, Generation and transmission of 8 × 112-Gbps WDM PDM-16QAM on a 25-GHz grid with simplified heterodyne detection, Opt. Express, Vol. 21, No. 2, p. 1773, 2013.
24. M. Liu and X. Zhang, Graphene-based optical modulators, in Proceedings of the OFC 2012, Los Angeles, CA, paper OTu1I.7, 2012.
*Technical specification of Corning fiber G.652 SSMF given in Binh [10].