Lesson 18. Manage and Troubleshoot Applications
Goals
![]() Understand and support the various application types
Understand and support the various application types
![]() Manage application extensions and widgets in Notification Center
Manage application extensions and widgets in Notification Center
![]() Monitor and control processes and applications
Monitor and control processes and applications
![]() Explore various application troubleshooting techniques
Explore various application troubleshooting techniques
For many macOS support professionals, their most common day-to-day task is troubleshooting application issues. The successful resolution of an application issue most often depends on previous experience with the application. Specific application issues, however, are beyond the scope of this guide.
At the same time, support professionals dealing with new applications or new issues must rely on their ability to effectively gather relevant information and their knowledge of general system technologies. This lesson primarily addresses these two application troubleshooting aspects. So that you have a better understanding of the pieces in play, this lesson first defines key elements of the macOS process architecture. You will then learn to gather information about applications and processes. The remainder of this lesson covers a variety of general troubleshooting techniques that can be used for any type of application.
Reference 18.1 About Applications and Processes
A process is any instance of executable code that is currently activated and addressed in system memory. In other words, a process is anything that is currently “running” or “open.” macOS handles processes very efficiently, so even when a process is idle, and probably consuming no processor resources, it’s still considered active, because it has dedicated address space in system memory. The four general process types are applications, commands, daemons, and agents.
About macOS Process Types
Applications are a specific category of process that is generally identified as something the user opened in the graphical interface. Commands are also normally opened by the user but are only available at the command-line interface. The key similarity between most applications and commands is that they are running in the user’s space. In other words, most applications and commands are started, stopped, and limited to accessing resources available only to the user.
Processes that run on behalf of the system fall into another category, daemons, also referred to as background processes because they rarely have any user interface. Daemons usually launch during system startup and remain active the entire time the Mac is up and running; consequently, most daemons run with root or systemwide access to all resources. These background daemons are responsible for most of the automatic system features, such as detecting network changes and maintaining the Spotlight search metadata index.
Agents are technically also daemons, or background processes. The primary difference is that agents run only when a user is logged in to the system. Agents are always started automatically for the user by the system. Although applications and commands can also be opened automatically, they are not controlled by the system the way agents are. Most important, all of these process types are considered part of the user’s space because they are executed with the same access privileges the user has.
About macOS Memory Management
macOS is a desirable platform for running applications and other processes because it combines a rock-solid UNIX foundation with an advanced graphical user interface. Users will most likely recognize the interface elements right away, but it’s the underlying foundation that keeps things running so smoothly.
The primary feature in macOS that keeps processes secure is protected memory. Similarly to how the file system prevents users from meddling with items they shouldn’t, processes are also kept separate and secure in system memory. The system manages all memory allocation so that processes are not allowed to interfere with each other’s system memory space. In other words, an ill-behaved or crashed application does not normally affect any other process on the system.
macOS also automatically manages system memory for processes at their request. Although real system memory is clearly limited by hardware, the system dynamically allocates both real and virtual memory when needed. Thus, the only memory limitations in macOS are the size of installed RAM and the amount of free space you have available on your system volume.
Further, macOS includes software-based memory compression that both increases performance and reduces energy usage. Instead of the wasteful practice of swapping memory out to disk when too many processes are active, the system first compresses the content used by less active processes to free up space for more active processes. This greatly reduces traffic between active memory and the virtual memory swap files on the system disk.
64-Bit versus 32-Bit Mode
macOS supports both 32-bit and 64-bit modes simultaneously. A process running in 64-bit mode has the ability to individually access more than 4 GB of system memory, can perform higher-precision computational functions much faster, and can take advantage of Intel’s updated x86-64 architecture for improved performance and security. All Mac computers compatible with macOS Sierra feature 64-bit-capable processors and can take advantage of 64-bit system features.
In Sierra, nearly the entire operating system and almost all included applications run in 64-bit mode. In fact, only one of the main built-in applications is still limited to 32-bit mode: DVD Player.
Although moving most of the applications to support 64-bit mode generally improves performance, this advancement is not without drawbacks. Namely, applications that run in 64-bit mode can’t take advantage of any 32-bit code. This means any application that uses plug-in technology may suffer from compatibility issues with third-party plug-ins that have not been updated to support 64-bit mode.
Examples of plug-in software affected by this issue include:
![]() Printer drivers that add interfaces for the printer dialog
Printer drivers that add interfaces for the printer dialog
![]() Screen savers
Screen savers
![]() Audio device drivers known as audio units
Audio device drivers known as audio units
![]() Spotlight metadata import plug-ins
Spotlight metadata import plug-ins
![]() Quick Look preview plug-ins
Quick Look preview plug-ins
![]() Dashboard widgets that require plug-in code (though most widgets don’t use extra code, so they should work without issues)
Dashboard widgets that require plug-in code (though most widgets don’t use extra code, so they should work without issues)
![]() Safari plug-ins
Safari plug-ins
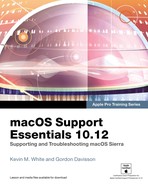
In short, applications running in 64-bit mode do not load 32-bit plug-ins. If you need to use a third-party 32-bit plug-in with a 64-bit-capable application, you have to force the application to run in 32-bit mode on most Mac systems. This can be accomplished from the Finder Info or Inspector window by simply selecting the “Open in 32-bit mode” checkbox. Obviously, forcing 32-bit mode may make the application run more slowly, but this is required to use nonupdated plug-ins.
Note
The “Open in Low Resolution” checkbox appears only on new Mac computers featuring Retina displays. This option prevents the use of high-resolution application assets, which also may not be compatible with older application plug-ins.
One system application automatically switches modes for you: System Preferences. When a user tries to open a third-party 32-bit System Preferences plug-in, often called a System Preferences pane, a prompt to restart System Preferences appears. If the user clicks OK (the default), System Preferences restarts in 32-bit mode and loads the selected pane.
Note
With the exception of Dashboard and System Preferences, third-party plug-ins that tie into a system resource or background process must support 64-bit mode to work with macOS.
Reference 18.2 Manage Application Extensions
Application extensions allow applications to take advantage of functionality and content from other applications. In this section you will explore how application extensions blur the line between separate applications in macOS.
Note
Don’t confuse application extensions with kernel extensions. Application extensions add functionality to applications, whereas kernel extensions primarily add hardware compatibility to the system. You can find out more about kernel extensions in Lesson 24, “Troubleshoot Peripherals.”
About Application Extensions
macOS has long included cross-application integration through methods like copy and paste, the Services menu, and AppleScript. Although these older methods are still viable, application extensions provide a standard framework that allows applications from completely different developers to directly interact with each other—so much so that with application extensions one application’s features can appear as if they are built in to another application.
Examples of application extensions possible for macOS include:
![]() Action menu—Application extensions can add more options to the Action menu. The Action menu is an interface that allows a user to manipulate a document. With application extensions, the features from one application can be used in another application to manipulate the document.
Action menu—Application extensions can add more options to the Action menu. The Action menu is an interface that allows a user to manipulate a document. With application extensions, the features from one application can be used in another application to manipulate the document.
![]() Finder—Application extensions can add file-system functionality exposed in the Finder. As an example, the popular third-party cloud storage solution Dropbox includes an application extension that adds a pop-up menu to the Finder toolbar where you can manage Dropbox settings for specific files.
Finder—Application extensions can add file-system functionality exposed in the Finder. As an example, the popular third-party cloud storage solution Dropbox includes an application extension that adds a pop-up menu to the Finder toolbar where you can manage Dropbox settings for specific files.
![]() Photos—Application extensions can add photo manipulation tools to the built-in macOS Photos application.
Photos—Application extensions can add photo manipulation tools to the built-in macOS Photos application.
![]() Share menu—Application extensions can add more options to the Share menu, allowing users to directly share content from one application with other applications or Internet services.
Share menu—Application extensions can add more options to the Share menu, allowing users to directly share content from one application with other applications or Internet services.
![]() Today view—Application extensions can add functionality in the form of widgets that appear in the Today view of Notification Center. In OS X Yosemite 10.10 and later, this ability largely replaces the need for Dashboard widgets.
Today view—Application extensions can add functionality in the form of widgets that appear in the Today view of Notification Center. In OS X Yosemite 10.10 and later, this ability largely replaces the need for Dashboard widgets.
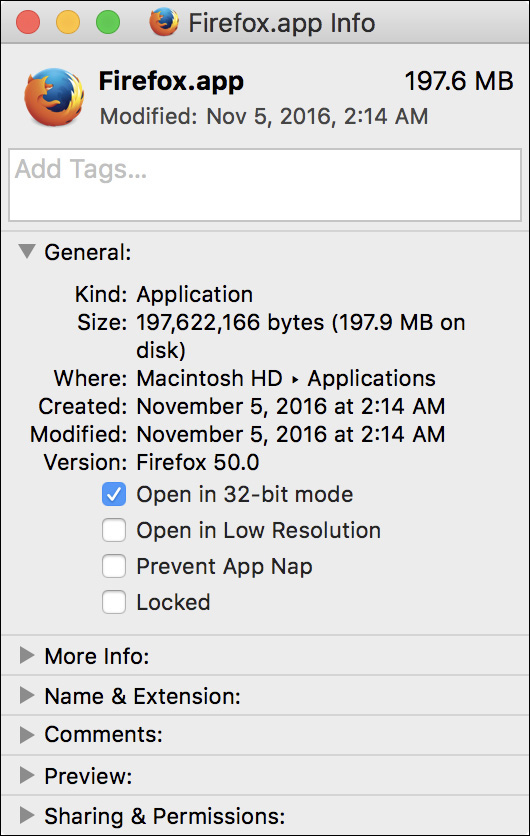
As an example of application extensions in macOS, the Preview application includes markup features that allow you to manipulate pictures or PDF documents. This includes the ability to add custom shapes, text, or even your digital signature to existing documents. You can access these features in Preview by clicking the Markup button (toolbox icon) in the toolbar.

The markup features of Preview are also available as an application extension that can be used by any other application. In macOS, the Mail application can take advantage of markup features within an email that contains a picture or PDF document. When replying to a message in Mail, click the Include Attachments button in the toolbar and then the Action button (downward arrow icon) at the top right of the document to reveal the markup features. Again, other application extensions can add their custom actions here as well.
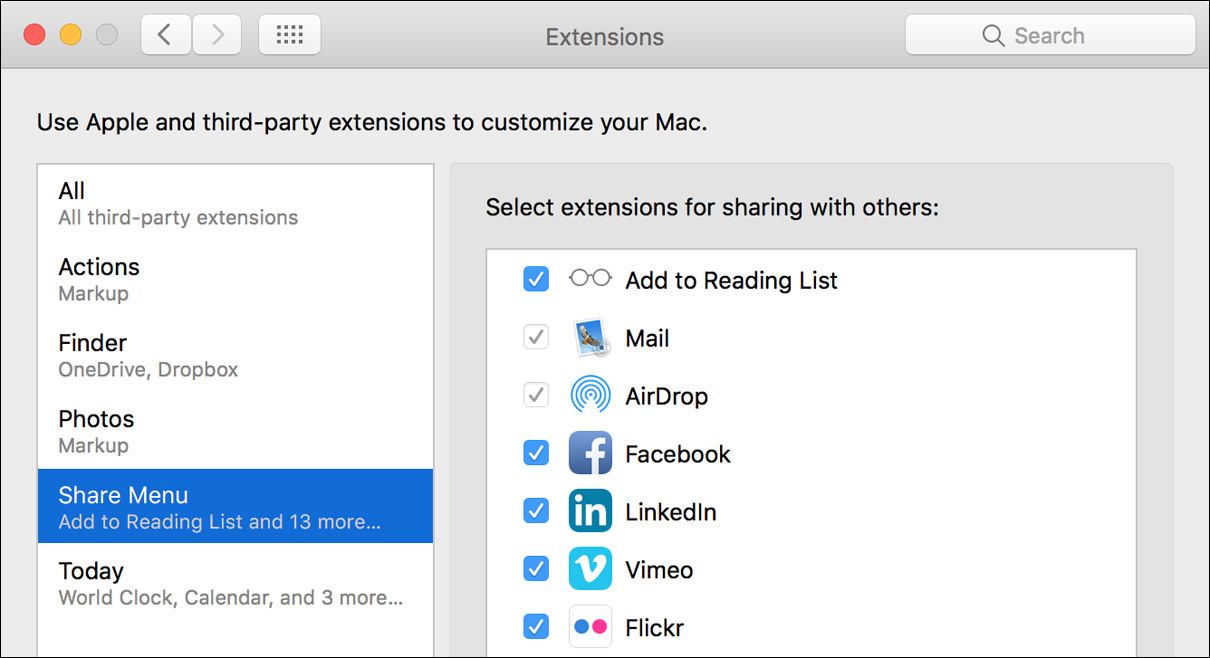
Manage Application Extensions
Several application extensions are included with macOS, and additional application extensions are “installed” automatically with the application that is providing the additional functionality. In other words, applications that integrate via application extensions include the application extension resources inside the application bundle. Thus, the user will never have to see or install specific application extensions.
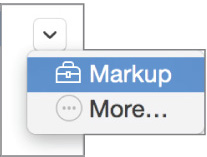
A user can inspect the installed application extensions and enable or disable their functionality from the Extensions preferences. The following screenshot shows the markup action included with macOS via the Preview application. For example, deselecting the checkbox next to the Markup item would prevent that application extension from appearing in other applications. Also note the OneDrive and Dropbox application extensions listed under Finder. This application extension is installed automatically with the Dropbox application.
Items in the Share menu can also be enabled or disabled from the Extensions preferences. However, keep in mind that the user will need to be signed in to an Internet-based sharing service to activate its associated application extension. Users can sign in to most Internet services via the Internet Accounts preferences, as covered in Lesson 22, “Manage Network Services.”
Use Notification Center Today View
The Today view in Notification Center offers a range of information and functionality that can be customized to the user’s preference. Notification Center is accessed by clicking the farthest-right button in the menu bar, and the default view is Today.
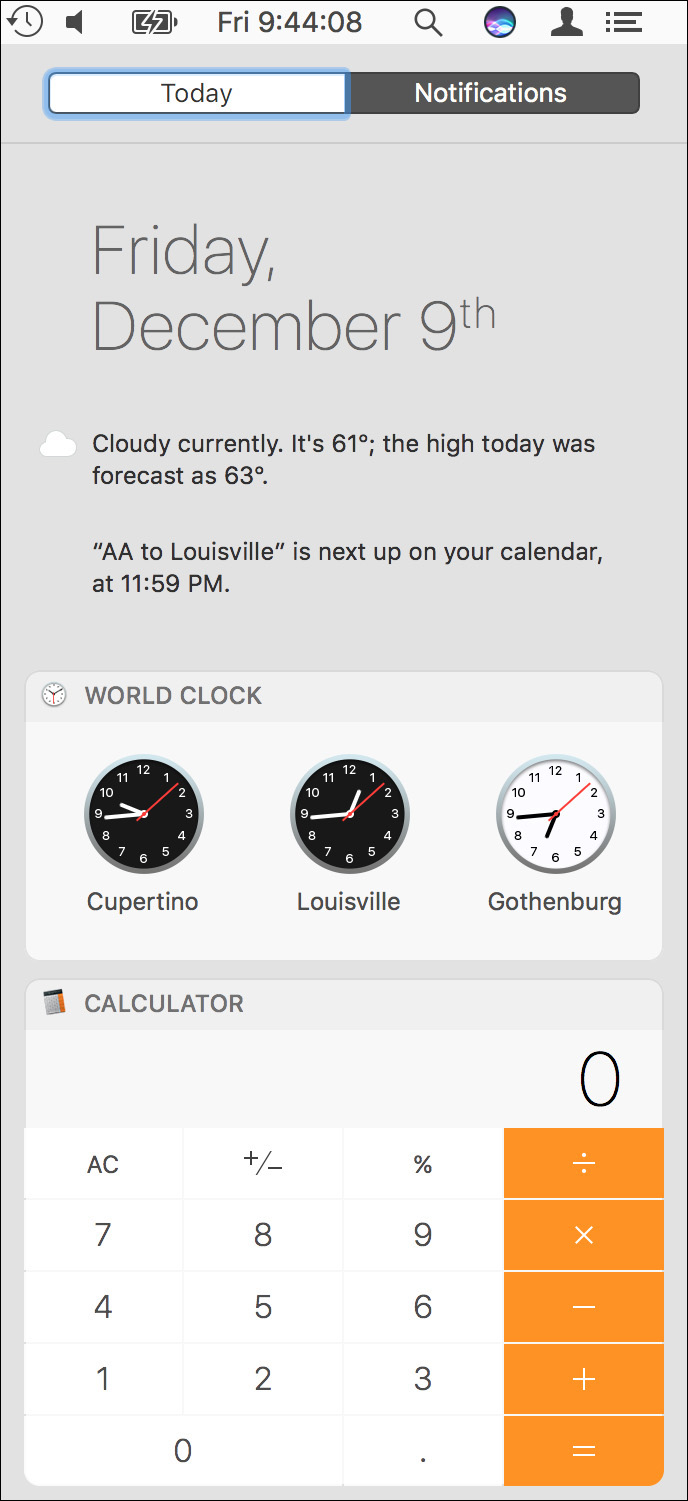
The Today view largely replaces functionality found in an older macOS technology, Dashboard widgets. In fact, application extensions that can be used in the Today view are referred to as widgets. However, from a technology standpoint, legacy Dashboard widgets are not the same. Widgets in the Today view of Notification Center are implemented through application extensions, whereas older Dashboard widgets were installed in their own Widgets folder within a Library folder.
Tip
macOS Sierra still includes the ability to use legacy Dashboard widgets, although it’s hidden by default. Access to the Dashboard can be managed via the Mission Control preferences.
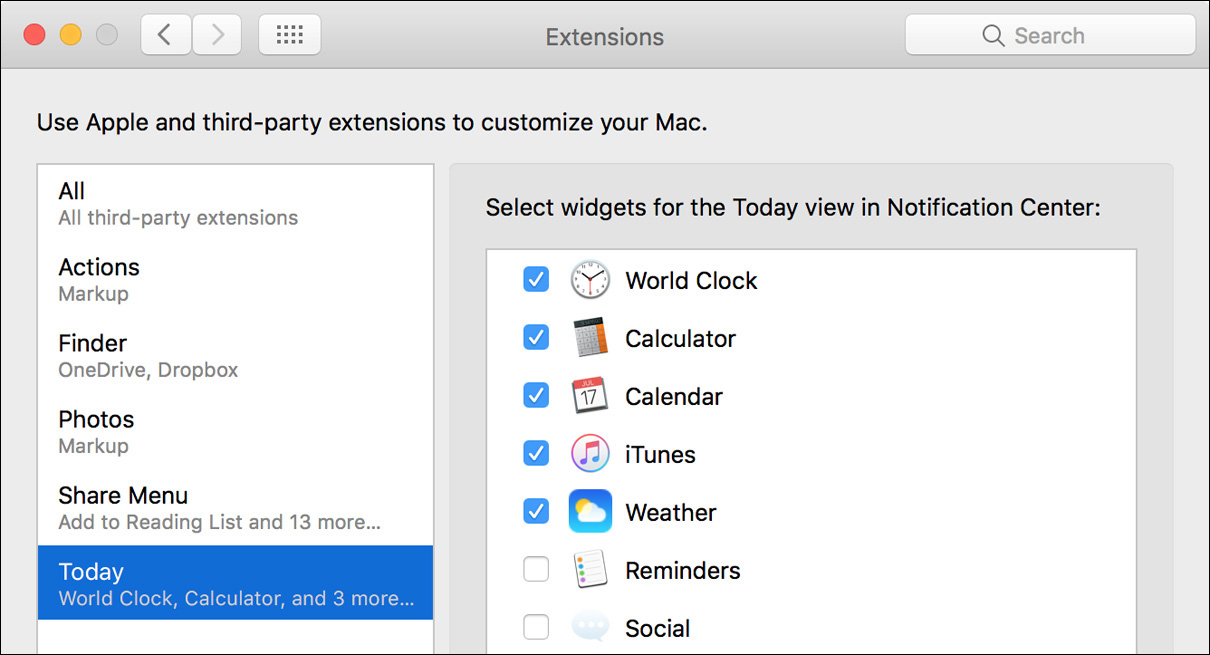
Like other application extensions, widgets in the Today view are included with the application that is providing the functionality or service. For example, the Calculator application extension is built in to the Calculator application included with macOS. Also, as with other application extensions, you can disable or enable widgets in the Today view from the Extensions preferences.
Tip
Widgets in the Today view can also be managed by clicking the button at the bottom center of Notification Center. This button most often says Edit, but it can also display as <#> New, where <#> is the number of newly added application extensions that can present widgets in the Today view.
Tip
You can install more widgets from the Mac App Store. On the Featured page of the Mac App Store, in the Quick Links section at the bottom right, you’ll find a link to popular Notification Center widgets.
Reference 18.3 Monitor Applications and Processes
macOS provides several methods for identifying and managing applications and processes. As covered previously, you can still use the Finder Info window to inspect basic application information, but you can find out a lot more about an application from System Information. If you need to inspect an application or process as it’s running on the Mac, use the Activity Monitor application.
Monitor Applications via System Information
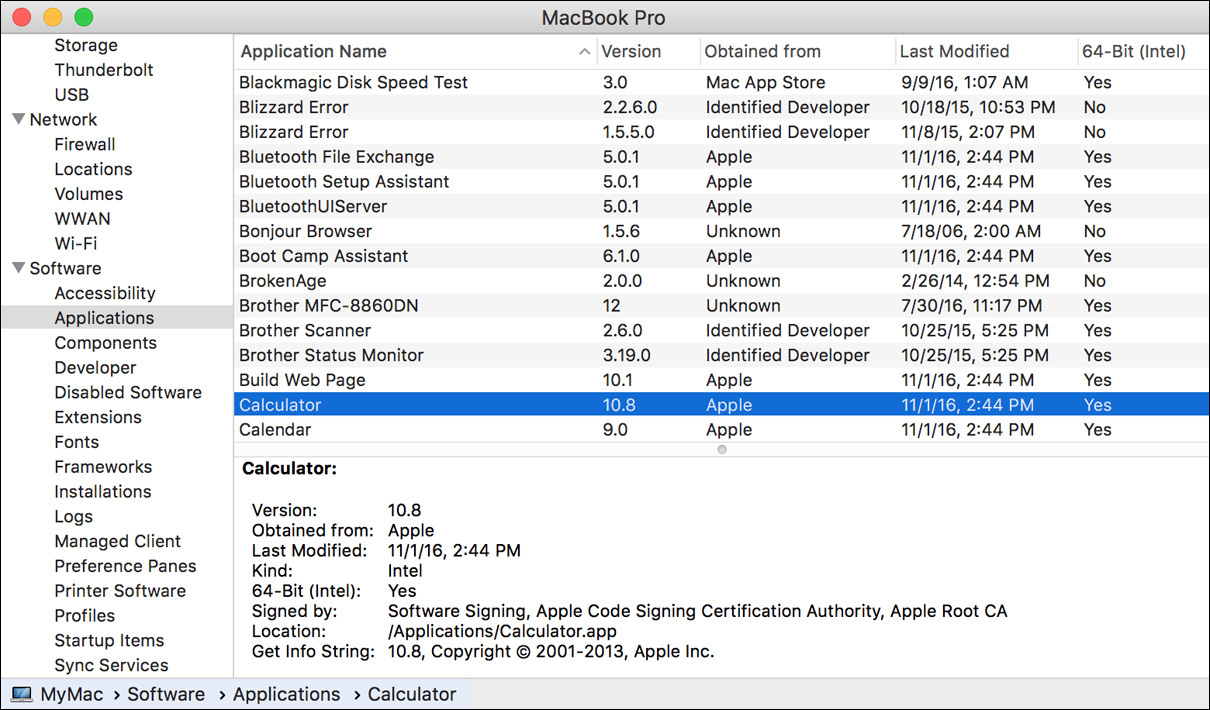
If you want to quickly gather information about all the applications on your Mac, use the /Applications/Utilities/System Information application. When you select the Applications category in System Information, the content of all available Application folders is scanned. This includes /Applications, /Applications/Utilities, ~/Applications, /System/Library/, and any other Applications folders at the root of any mounted volumes.
From the applications list, select an entry to reveal its name, version number, application source modification date, and application type. The application’s source, in the “Obtained from” column, is based on the code-signing certificate used to create the application. Unidentified applications do not contain this code signature. Also note that applications installed as part of macOS do not show as being purchased from the Mac App Store but instead show just “Apple.”
Monitor Processes via Activity Monitor
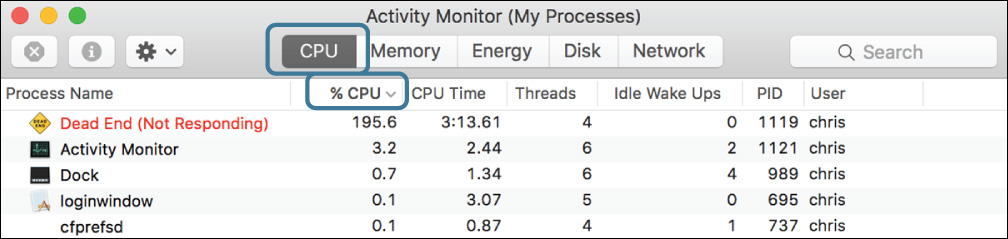
The primary application in macOS for monitoring processes as they are running is /Applications/Utilities/Activity Monitor. This extremely useful tool shows you the vital signs of any currently running process and of the system as a whole. If an application has stopped responding or has become noticeably slow, check Activity Monitor. Also, check here if the overall system is running noticeably slower. Activity Monitor helps you identify an application or background process that is using a significant percentage of system resources.
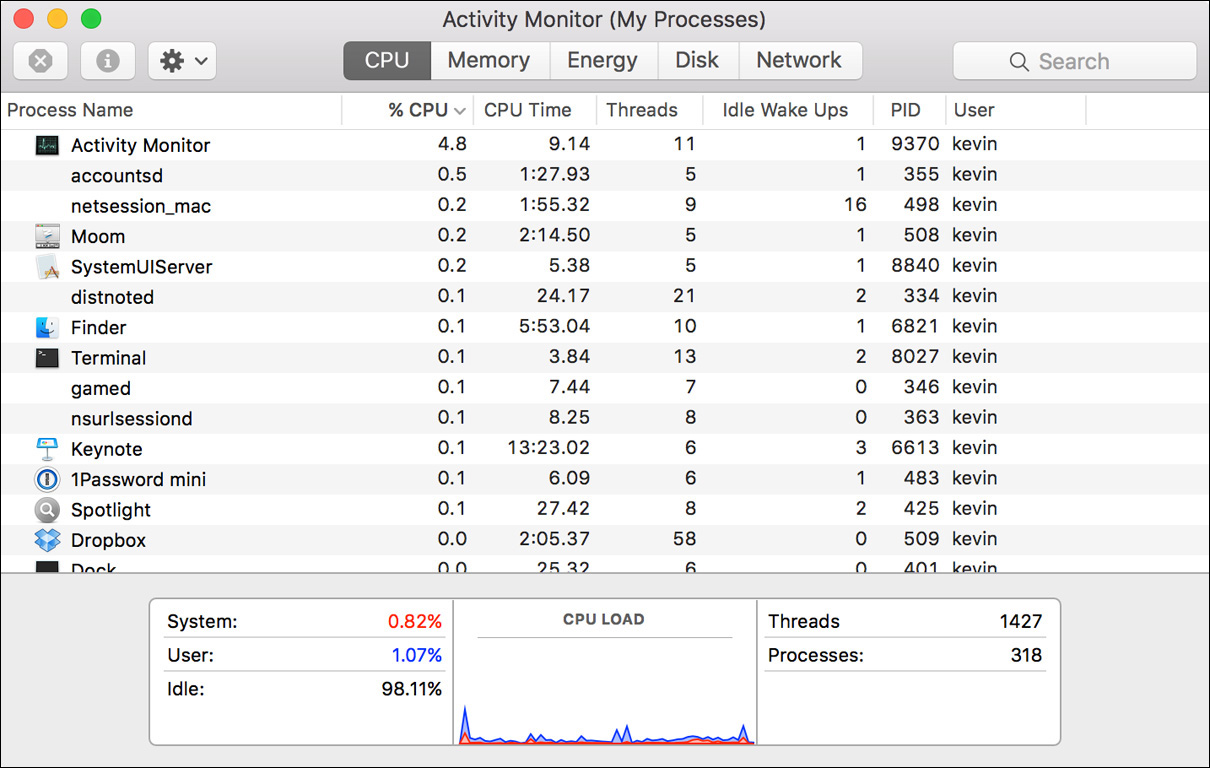
The main window of Activity Monitor presents a list of running processes and applications that belong to the current user. Below the process list you’ll see overall system statistics. The default columns in Activity Monitor allow you to examine various process statistics:
![]() Process Name—This is the name of the running process chosen by the developer who created it.
Process Name—This is the name of the running process chosen by the developer who created it.
![]() % CPU—This number is the percentage of total CPU usage the process is consuming. Note that the maximum percentage possible is 100 percent times the number of processor cores. For example, a Mac featuring an Intel Core i7 presents a total of eight processor cores to the system.
% CPU—This number is the percentage of total CPU usage the process is consuming. Note that the maximum percentage possible is 100 percent times the number of processor cores. For example, a Mac featuring an Intel Core i7 presents a total of eight processor cores to the system.
![]() CPU Time—This is the amount of time a process has been active on the system since the last startup.
CPU Time—This is the amount of time a process has been active on the system since the last startup.
![]() Threads—Each process is further broken down into the number of thread operations. Multithreading helps increase a process’s responsiveness by enabling it to perform multiple simultaneous tasks. Multithreading also increases performance, as each thread of a single process can run on a separate processor core.
Threads—Each process is further broken down into the number of thread operations. Multithreading helps increase a process’s responsiveness by enabling it to perform multiple simultaneous tasks. Multithreading also increases performance, as each thread of a single process can run on a separate processor core.
![]() Idle Wake Ups—This is the number of times a process has been woken up from a paused “sleep” state since the process was last started.
Idle Wake Ups—This is the number of times a process has been woken up from a paused “sleep” state since the process was last started.
![]() Process Identification (PID)—Each process has a unique identifier number. The numbers are assigned in sequence as processes are opened after system startup. Note that the PIDs are “recycled” after 65,535 has been reached.
Process Identification (PID)—Each process has a unique identifier number. The numbers are assigned in sequence as processes are opened after system startup. Note that the PIDs are “recycled” after 65,535 has been reached.
![]() User—Per the UNIX application security model, each process is opened on behalf of a particular user. Thus, each application has file-system access corresponding to the assigned user account.
User—Per the UNIX application security model, each process is opened on behalf of a particular user. Thus, each application has file-system access corresponding to the assigned user account.
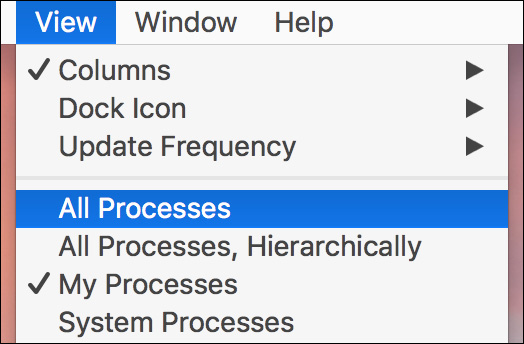
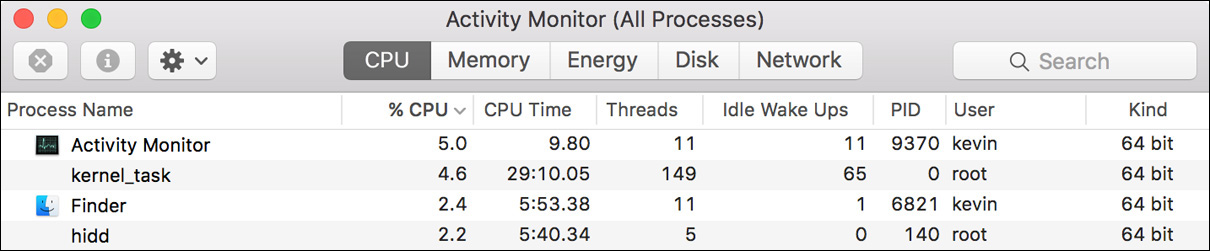
By default, Activity Monitor shows only processes running for the currently logged-in user. To increase your view of all active processes, choose View > All Processes. You can also adjust the number of statistics shown in the columns and the update frequency from the View menu.
Tip
To narrow down your view, use the Spotlight search filter in the upper-right corner of the Activity Monitor window.
To sort the process list by column, simply click any column title. Click the column title again to toggle between ascending and descending sorts. By viewing all processes and then re-sorting the list by % CPU, you can determine whether any process is using excessive resources.
To further inspect an individual process, double-click its name in the Activity Monitor list. This reveals a window showing detailed process information.
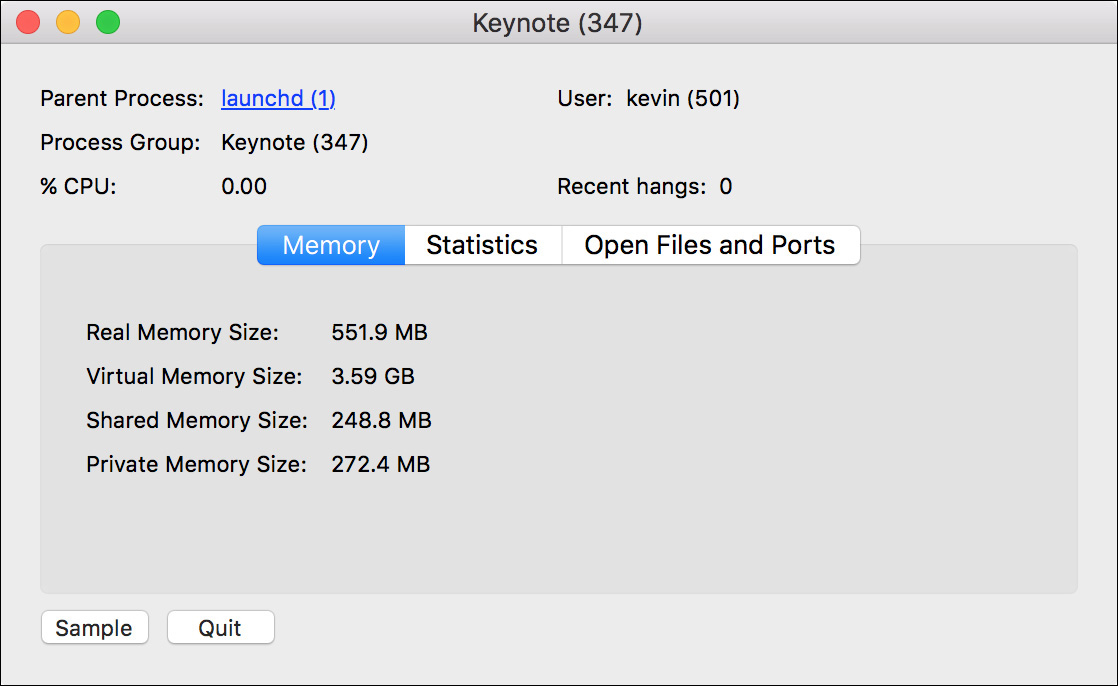
Although CPU utilization is generally the most important statistic for monitoring process activity, the Activity Monitor application can also monitor memory, energy, disk, and network utilization. Click through the tabs at the top of the Activity Monitor window to view the different categories. These monitoring features are invaluable for troubleshooting because they show you real-time system statistics.
Tip
Hover your mouse over any statistic at the bottom of the Activity Monitor window to view a description of the statistic.
Of particular note are the Swap Used and Compressed statistics under the Memory tab. These numbers are a historical account, since the last system startup, of how much active process data has been swapped out to local storage or compressed to save space. Compression is preferred to swapping, because it’s a higher-performance approach to making more room in memory.
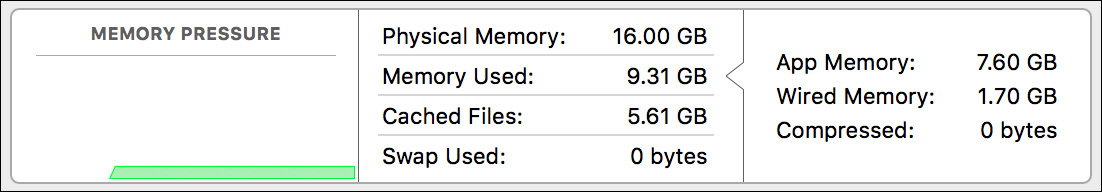
A low number of swap usage is acceptable, but a high number of swap usage indicates that the system does not have enough real memory to meet the user’s application demands. In other words, the system only “swaps out” when it does not have enough real memory, thus slowing system performance.
More Info
Take time to explore all the features available from the Activity Monitor menu options. For an even more detailed process inspector, check out the Instruments application installed as part of the optional Xcode Developer Tools found on the Mac App Store. For more information about using Activity Monitor see Apple Support article HT201464, “Use Activity Monitor on your Mac.”
Reference 18.4 Troubleshoot Applications
Application issues are as diverse as the applications themselves. Just as each application is designed to provide unique features, problems often manifest in unique ways as well. Fortunately, you can take a variety of general troubleshooting steps when diagnosing and resolving an application issue.
More Info
Apple maintains a list of software known to be incompatible. You can find out more about how macOS handles incompatible software in Apple Support article HT201861, “About incompatible software on your Mac.”
General Application Troubleshooting
The actions in the following list are in order from the least to the most invasive and time-consuming. Actions are also generally presented according to the likelihood of their success in resolving the issue, from most to least likely. Generally, when troubleshooting applications, start with one of these actions:
![]() Restart the application—Often, restarting an application resolves the issue, or at least resolves application responsiveness. In some cases, the application may become unresponsive and you may have to force quit it to restart it, as detailed later in this lesson.
Restart the application—Often, restarting an application resolves the issue, or at least resolves application responsiveness. In some cases, the application may become unresponsive and you may have to force quit it to restart it, as detailed later in this lesson.
![]() Try another known working document—This is an excellent method to determine whether a document has become corrupted and is the cause of the problem. If you discover that the problem’s source is a corrupted document file, usually the best solution is to restore the document from an earlier backup. As covered in Lesson 15, “Manage Time Machine,” macOS includes a sophisticated and easy-to-use backup system.
Try another known working document—This is an excellent method to determine whether a document has become corrupted and is the cause of the problem. If you discover that the problem’s source is a corrupted document file, usually the best solution is to restore the document from an earlier backup. As covered in Lesson 15, “Manage Time Machine,” macOS includes a sophisticated and easy-to-use backup system.
![]() Try another application—Many common document types can be opened by multiple Mac applications. Try opening the troublesome document in another application. If this works, save a new “clean” version of the document from the other application.
Try another application—Many common document types can be opened by multiple Mac applications. Try opening the troublesome document in another application. If this works, save a new “clean” version of the document from the other application.
![]() Try another user account—Use this method to determine whether a user-specific resource file is the cause of the problem. If the application problem doesn’t occur when using another account, search for corrupted application caches, preferences, and resource files in the suspect user’s Library folder. Creating a temporary account to test—and then deleting it—is quite easy, as covered in Lesson 5, “Manage User Accounts.”
Try another user account—Use this method to determine whether a user-specific resource file is the cause of the problem. If the application problem doesn’t occur when using another account, search for corrupted application caches, preferences, and resource files in the suspect user’s Library folder. Creating a temporary account to test—and then deleting it—is quite easy, as covered in Lesson 5, “Manage User Accounts.”
![]() Check diagnostic reports and log files—This is the last information-gathering step to take before you start replacing items. Few applications keep detailed log files; however, every time an application crashes, the macOS diagnostic reporting feature saves a diagnostic report of the crash information. Using the Console application to view diagnostic reports is detailed later in this lesson.
Check diagnostic reports and log files—This is the last information-gathering step to take before you start replacing items. Few applications keep detailed log files; however, every time an application crashes, the macOS diagnostic reporting feature saves a diagnostic report of the crash information. Using the Console application to view diagnostic reports is detailed later in this lesson.
![]() Delete cache files—To increase performance, many applications create cache folders in the /Library/Caches, ~/Library/Caches, and ~/Library/Saved Application State folders. A specific application’s cache folder almost always matches the application’s name. Although not the most likely application resource to cause problems, cache folders can be easily deleted without affecting the user’s information. Once you delete an application’s cache folder, the application creates a new one the next time you open it. One cache type that can’t be removed easily from the Finder are the various font caches. However, the system font caches are cleared during a safe boot, as covered in Lesson 26, “Troubleshoot Startup and System Issues.”
Delete cache files—To increase performance, many applications create cache folders in the /Library/Caches, ~/Library/Caches, and ~/Library/Saved Application State folders. A specific application’s cache folder almost always matches the application’s name. Although not the most likely application resource to cause problems, cache folders can be easily deleted without affecting the user’s information. Once you delete an application’s cache folder, the application creates a new one the next time you open it. One cache type that can’t be removed easily from the Finder are the various font caches. However, the system font caches are cleared during a safe boot, as covered in Lesson 26, “Troubleshoot Startup and System Issues.”
Tip
The ~/Library folder is hidden by default in macOS. The easiest way to reveal this folder in the Finder is to hold down the Option key and choose Go > Library.
![]() Replace preference files—Corrupted preference files are one of the most likely of all application resources to cause problems, because they change often and are required for the application to function properly. Application preference troubleshooting is detailed later in this lesson.
Replace preference files—Corrupted preference files are one of the most likely of all application resources to cause problems, because they change often and are required for the application to function properly. Application preference troubleshooting is detailed later in this lesson.
![]() Replace application resources—Although corrupted application resources can certainly cause problems, they are the least likely source of problems, since application resources are rarely changed. Application resource troubleshooting is also detailed later in this lesson.
Replace application resources—Although corrupted application resources can certainly cause problems, they are the least likely source of problems, since application resources are rarely changed. Application resource troubleshooting is also detailed later in this lesson.
Force Quit Applications
It’s pretty easy to tell when an application becomes unresponsive—it stops reacting to your mouse clicks, and the pointer often changes to a wait cursor (spinning pinwheel) and stays that way for more than a minute. Hence, the terms spinning-wheel and beach-balling have become slang for a frozen Mac application.
Because the forward-most application controls the menu bar, it may seem as if the application has locked you out of the Mac entirely. But moving the cursor from the frozen application window to another application window or the desktop usually returns the pointer to normal—and you can then click another application or the desktop to regain control of your Mac.
macOS provides no less than three methods to force quit applications from the graphical interface:
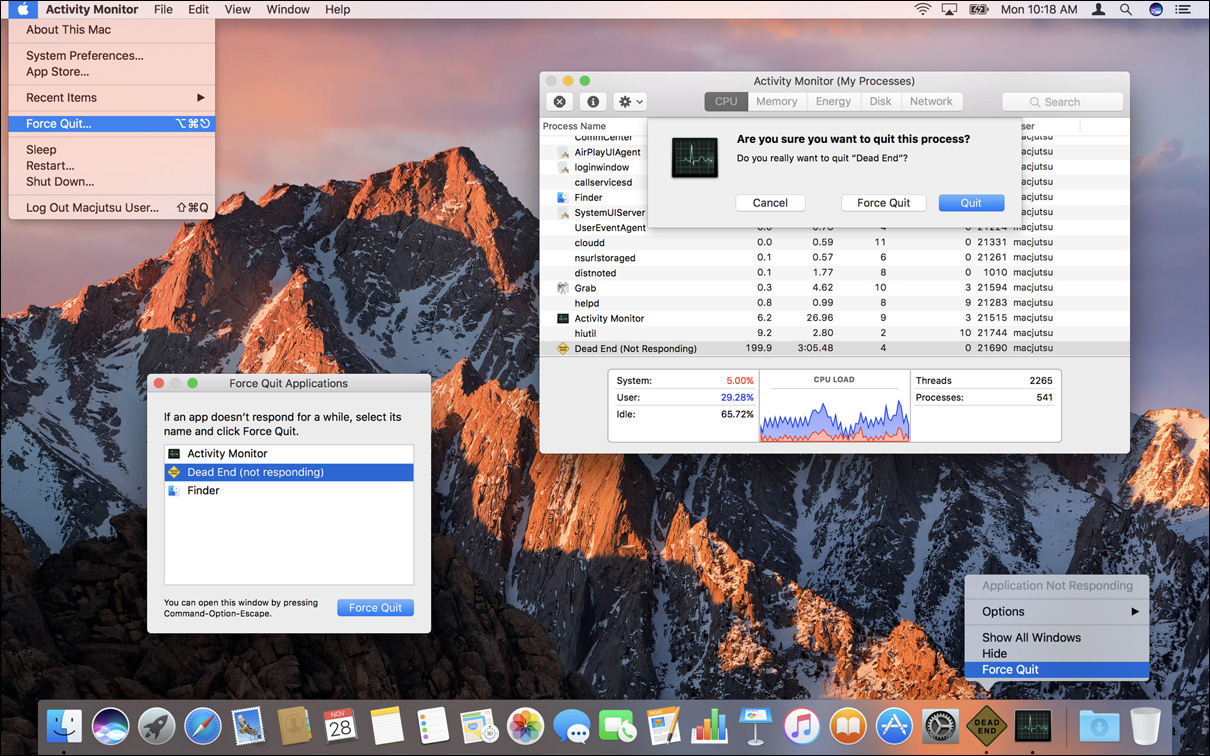
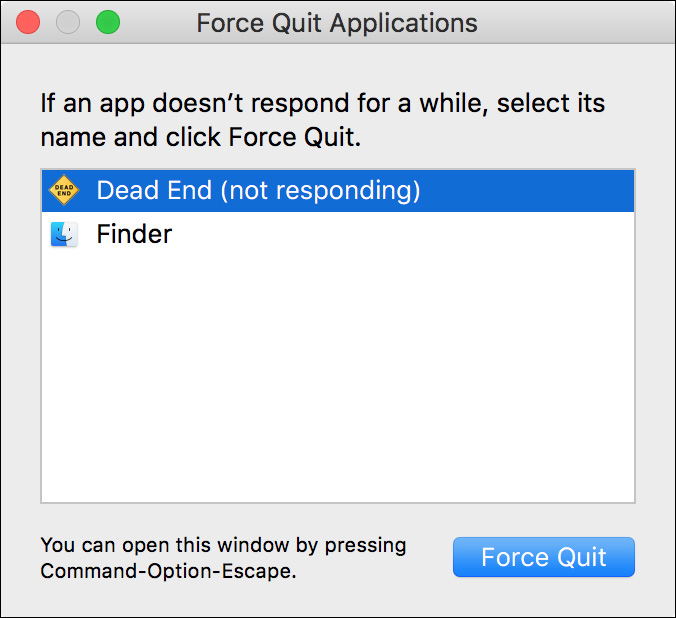
![]() From the Force Quit Applications dialog—Choose Apple menu > Force Quit, or press Command-Option-Escape, to open the Force Quit Applications dialog. A frozen application appears with “(not responding)” next to its name. To force quit, select any application and click Force Quit. Note that you only have the ability to restart the Finder—the system automatically restarts the Finder if it’s quit.
From the Force Quit Applications dialog—Choose Apple menu > Force Quit, or press Command-Option-Escape, to open the Force Quit Applications dialog. A frozen application appears with “(not responding)” next to its name. To force quit, select any application and click Force Quit. Note that you only have the ability to restart the Finder—the system automatically restarts the Finder if it’s quit.
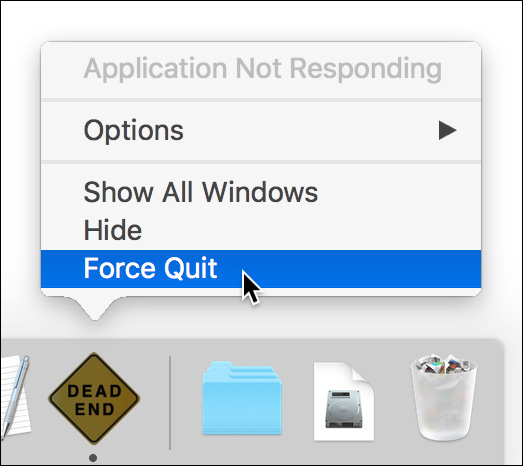
![]() From the Dock—Use secondary-click (or Control-click), or hold down the application’s icon in the Dock, to display the application shortcut menu. If the Dock has recognized that the application is frozen, simply choose Force Quit from this menu. Otherwise, hold down the Option key to change the Quit menu command to Force Quit.
From the Dock—Use secondary-click (or Control-click), or hold down the application’s icon in the Dock, to display the application shortcut menu. If the Dock has recognized that the application is frozen, simply choose Force Quit from this menu. Otherwise, hold down the Option key to change the Quit menu command to Force Quit.
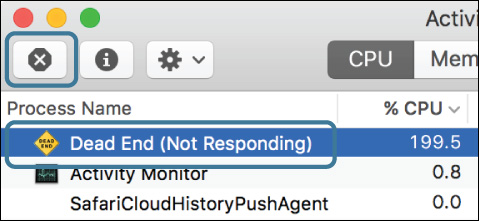
![]() From Activity Monitor—Open /Applications/Utilities/Activity Monitor, and then select the application you want to quit from the process list. Next, click the “X in an octagon” button on the far-left edge of the Activity Monitor toolbar, and then click the Force Quit button. Activity Monitor is the only built-in graphical application that also allows administrator users to quit or force quit any other user process or background system process.
From Activity Monitor—Open /Applications/Utilities/Activity Monitor, and then select the application you want to quit from the process list. Next, click the “X in an octagon” button on the far-left edge of the Activity Monitor toolbar, and then click the Force Quit button. Activity Monitor is the only built-in graphical application that also allows administrator users to quit or force quit any other user process or background system process.
Note
In Activity Monitor, individual webpages in Safari are shown as separate processes. This gives you the ability to force quit individual pages that may have crashed in Safari.
About Diagnostic Reports
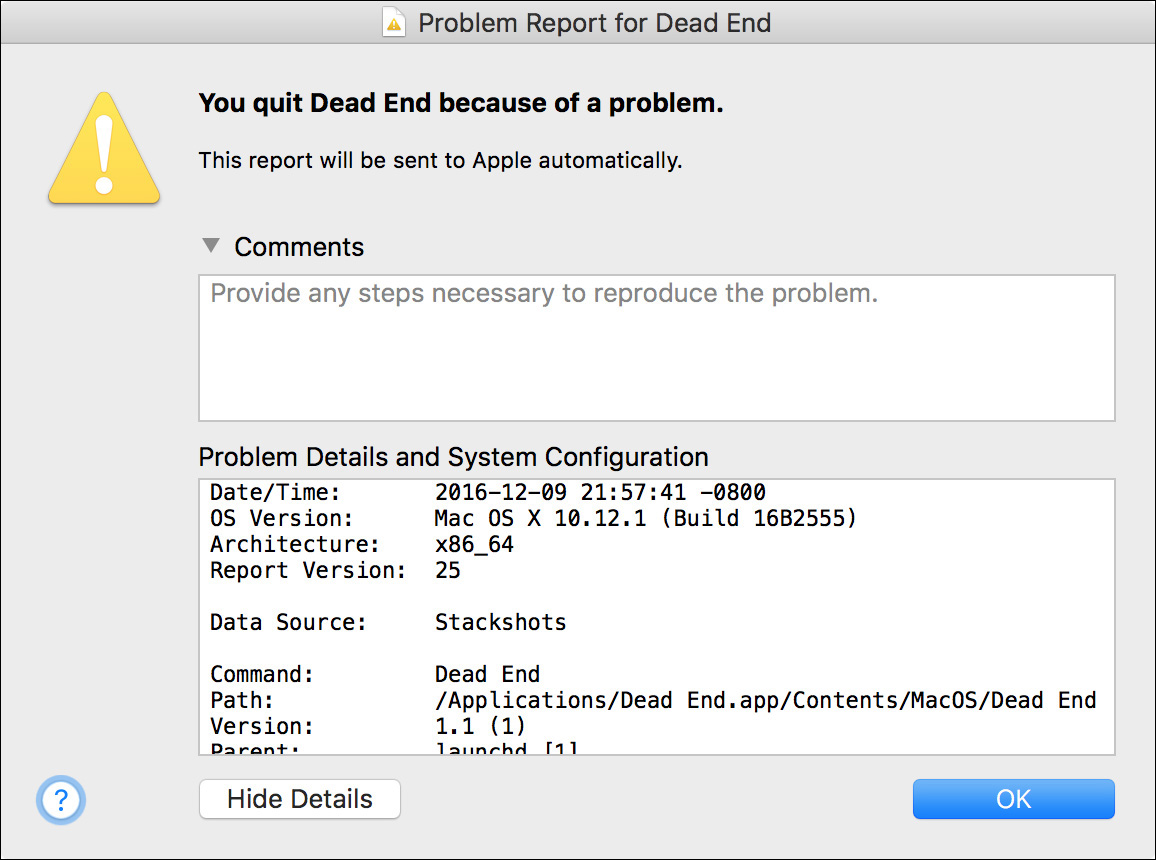
To help diagnose persistent issues, the macOS diagnostic reporting feature springs into action whenever an application quits unexpectedly (commonly known as a crash) or stops functioning (commonly known as a hang) and you have to force quit it. This process displays a warning dialog that lets the user know a problem has occurred.
More importantly, this process records log files that detail the circumstances surrounding the application’s crash or hang. If you click the Report button when the warning dialog appears, you can see the diagnostic report and, optionally, add comments to send to Apple.
Tip
You can turn off the automatic sending of diagnostic reports to Apple from the Security & Privacy preferences.
View Diagnostics via Console
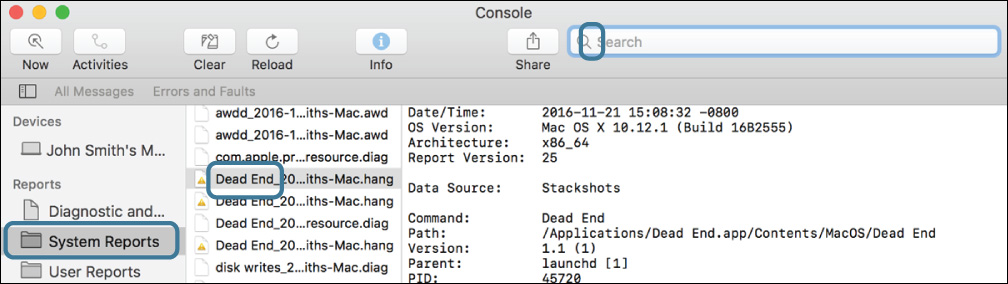
Even if you don’t send the report to Apple, you can revisit diagnostic messages and reports later; they are always saved to the system volume. macOS Sierra keeps a variety of log files that range from short usage messages to detailed problem reports. The easiest way to view these logs is to open the /Applications/Utilities/Console application and then to make sure all the logs are showing by clicking Diagnostics and Usage Data in the sidebar.
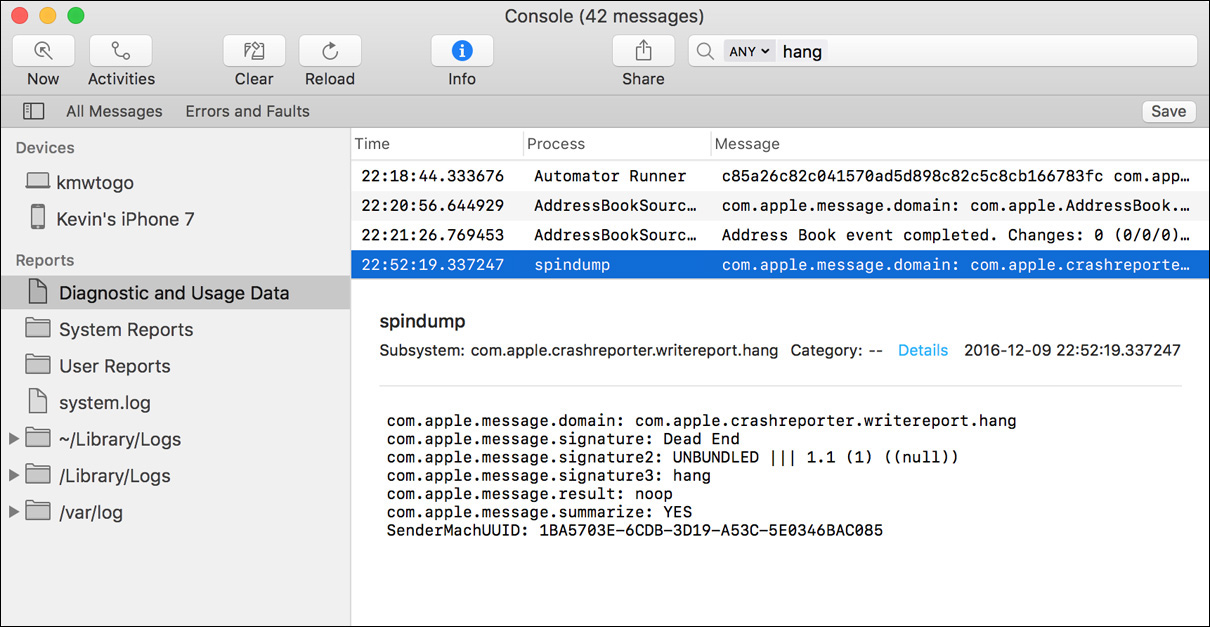
Short diagnostic messages that show both general usage and problems are saved to /private/var/log/DiagnosticMessages. These messages can be viewed in Console by selecting Diagnostics and Usage Data in the log list. Processes in macOS Sierra can generate hundreds of diagnostic messages a day, so most of them are benign. However, as you can see in the previous screenshot, the Dead End application has experienced a “hang.”
More detailed diagnostic messages are created in cases where processes have hung or crashed. If the problem report was generated by something running for the user, the log is saved to the user’s ~/Library/Logs/DiagnosticReports folder. These reports can be seen in Console by selecting User Reports in the log list. However, if the problem report was generated by something running as the system, the log is saved in the local /Library/Logs /DiagnosticReports folder. These reports can be seen in Console by selecting System Reports in the log list.
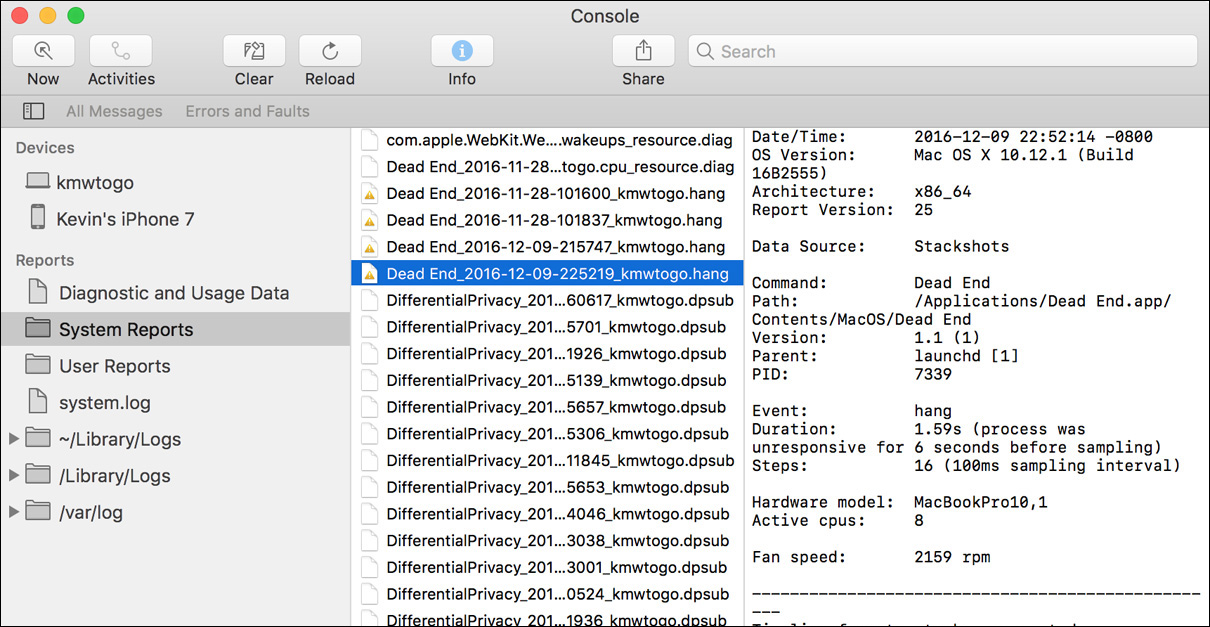
The diagnostic reports are chronologically listed, and each report entry is named by the application followed by the date and time in 24-hour notation. These diagnostic report logs include highly technical information that many won’t understand, but they also include key pieces of information that may help the average troubleshooter diagnose the issue. For example, diagnostic reports often indicate which files were being used by the application at the time. One of the reported files could be the source of the problem due to corruption.
Troubleshoot Preferences
Applications primarily access two types of often-changing files when they are in use: the documents for which the application handles viewing or editing, and the preference files that contain all the application’s settings. From an administration perspective, preference files are often more important, because they may contain settings that are required for an application to work properly. For instance, an application’s serial number or registration information is often stored in a preference file.
Preference files can be found in any Library folder, but most application preferences end up in the user’s Library. Application preferences are kept in user home folders because the local Library should be used only for system preferences. More important, this enables each user to have his or her own application settings that do not interfere with other users’ settings. By this logic, it’s clear that if you’re troubleshooting a system process, you should look for its preferences in the /Library folder.
The ~/Library folder is hidden by default in macOS. The easiest way to reveal this folder in the Finder is to hold the Option key and choose Go > Library.
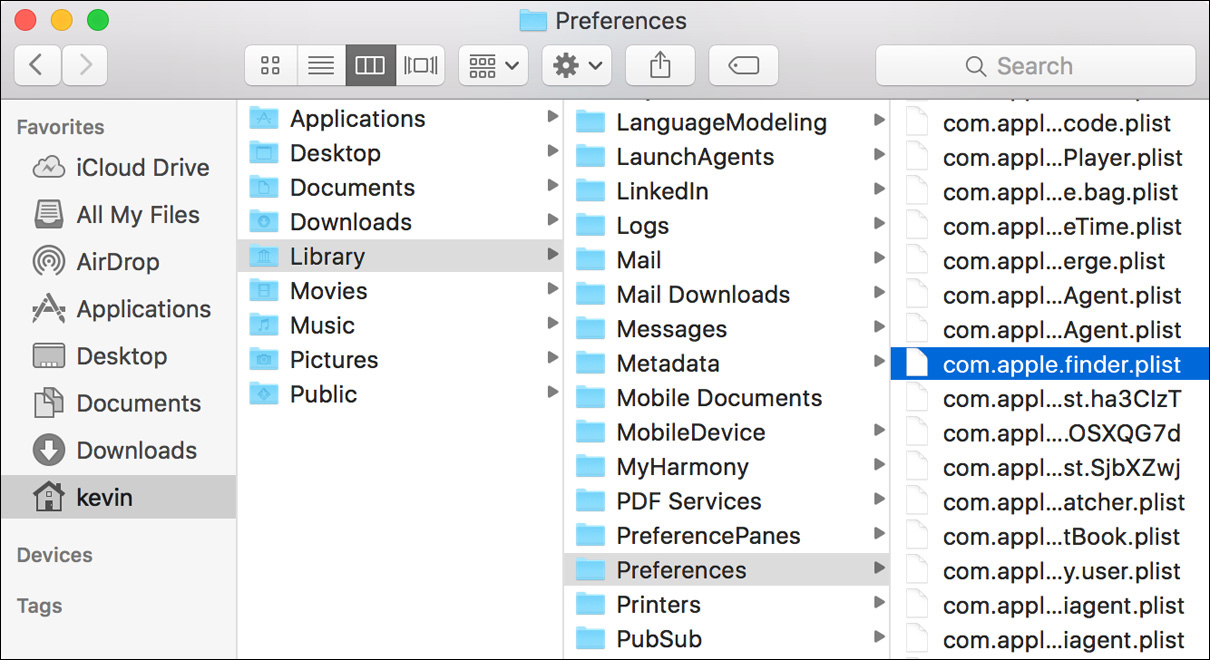
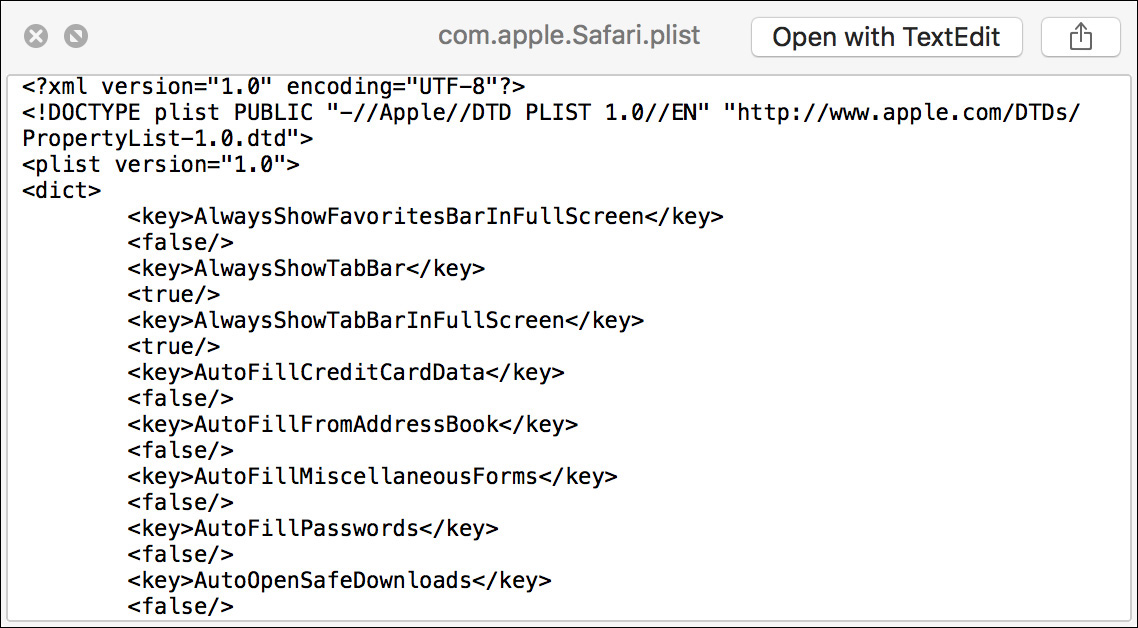
Most application and system preference files are saved as property list files. The naming scheme for a property list file usually has the unique bundle identifier for the application first, followed by the file type .plist. For example, the Finder preference file is named com.apple.finder.plist. This naming scheme may seem strange at first, but it helps avoid confusion by identifying the software’s developer along with the application itself.
Many applications are still not sandboxed, so they use the default preference folder for standard applications: the ~/Library/Preferences folder. The full path to the Finder preference file is /Users/<username>/Library/Preferences/com.apple.finder.plist, where <username> is the account name of the user.
Note
Any lock files associated with a preference file can be largely ignored, since they don’t contain any data and are simply the result of a legacy OS X Lion 10.7 behavior.
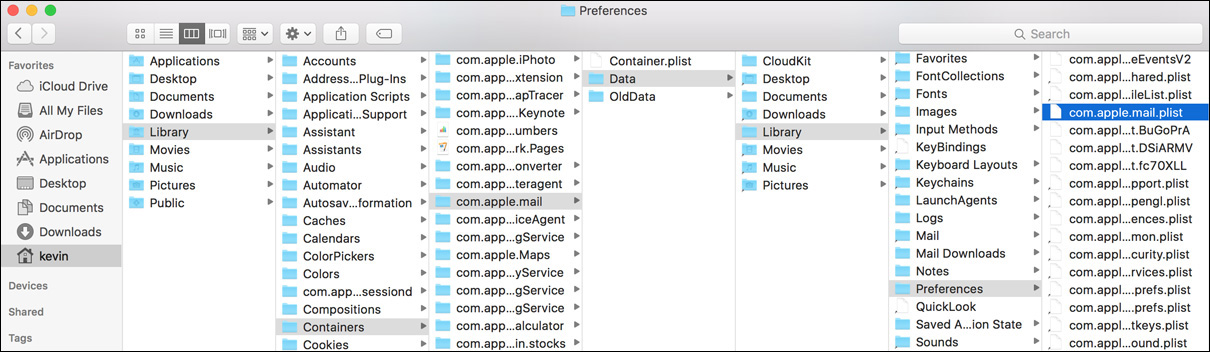
For sandboxed applications, the preference will be located in either the Containers or Group Containers folder. Specifically, these folders are ~/Library/Containers/<BundleID> /Data/Library/Preferences and ~/Library/Group Containers/<BundleID>/Library /Preferences, where <BundleID> is the unique bundle identifier for the application.
For example, the identifier for the Mail application is com.apple.mail. Therefore, for a user with the account name “kevin,” the full path to the Mail application’s preference file is /Users/kevin/Library/Containers/com.apple.mail/Data/Library/Preferences /com.apple.mail.plist.
Application preference files are a common application resource known historically to cause problems. Because these files can contain both internal application configuration information and user-configured preferences, even if you haven’t changed any preferences, odds are the application is constantly storing new information in this file. It is the only file required by most applications that is regularly being rewritten, so it has the potential to become corrupted.
Apple has worked to make its own applications and the user preference system wary of corrupted preference files. Many applications that use the Apple preference model, including third-party applications, simply recognize the corrupted preference file, ignore it, and create a new one. However, many other third-party applications use their own proprietary preference models that are not as resilient. In these cases, corrupted preferences typically result in an application that crashes frequently or during startup.
Resolve Corrupted Preferences
The most convenient method of isolating a corrupted preference in the latter case is to rename the suspect preference file. If any part of the preference filename is different than expected, the application ignores it and creates a new preference file. So, in the Finder, add an identifier to the end of the suspect preference filename—something like “.bad.” Alternatively, to make the preference file easier to find later, you could simply put a tilde (~) at the beginning of the file’s name, which causes the Finder to put it at the beginning of the file listing when sorted alphabetically.
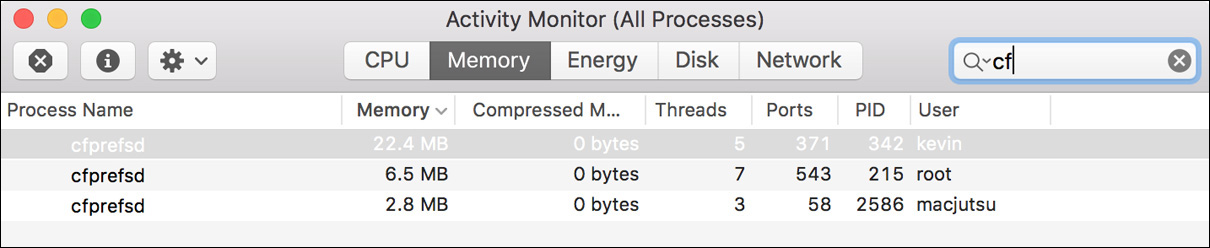
The preference architecture in macOS is maintained by a background server process known as cfprefsd. To improve performance, this process uses memory caching to store preference information. After you remove a potentially corrupted preference, you should restart this process to clear its cache. As covered previously, you can force any process to quit from Activity Monitor. Because cfprefsd should always be running, the system automatically restarts it when you force it to quit. Also, be sure to force quit only the cfprefsd process owned by the appropriate user.
After you have removed the preference file and restarted the cfprefsd process, opening the application or process creates a new preference file based on the code’s defaults. If this resolves the issue and doesn’t remove any irreplaceable settings, go ahead and trash the old preference file; if not, move on to resource troubleshooting.
If you eventually resolve the problem elsewhere, you can then restore the previous settings by deleting the newer preference file and then removing the filename identifier you added to the original preference file. Again, don’t forget to restart the cfprefsd process. The benefit of replacing the previous preference file is that you don’t lose any of the settings or custom configuration saved in the file.
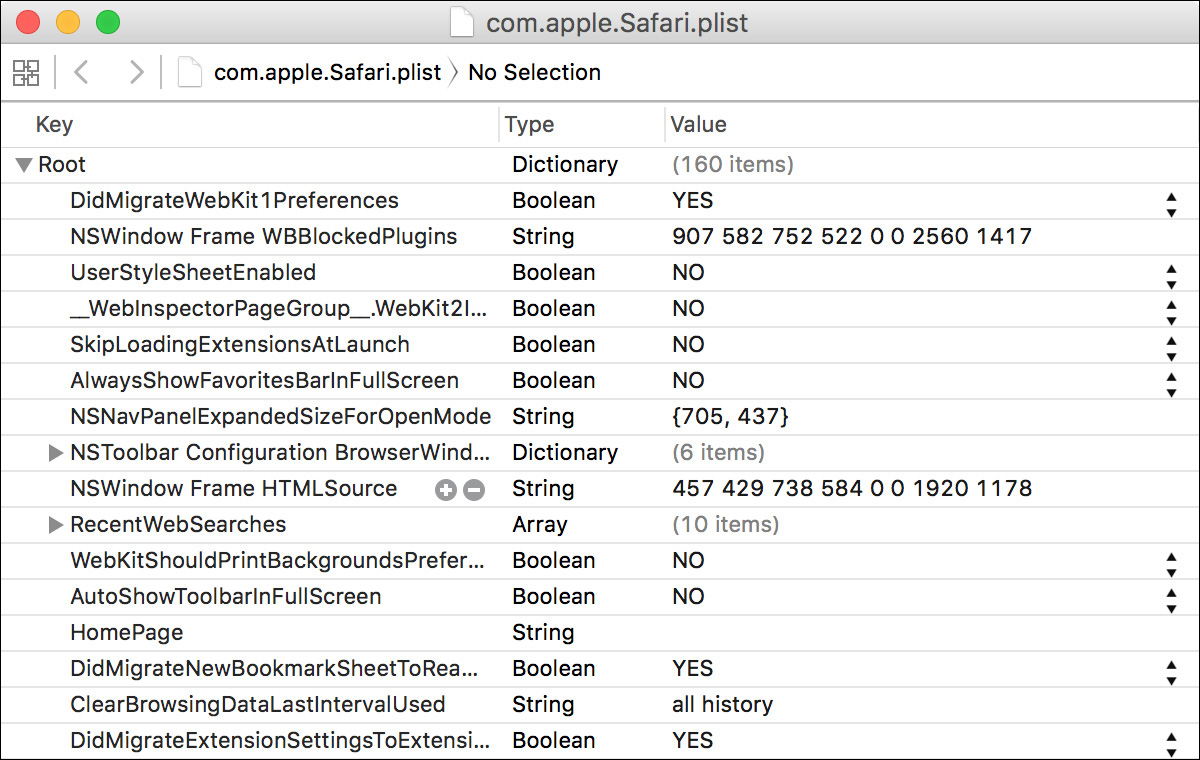
View and Edit Preference Files
One of the primary advantages of using the property list file format is that it can generally be understood by humans. During your troubleshooting, you may find it advantageous to verify settings by directly viewing the contents of the configuration property list file. Many applications and processes keep additional settings items in these files and may not have a graphical interface for configuration.
Note
Some third-party applications do not store their preference files as property lists. Thus, they will likely use a different naming convention, and you will probably not be able to view or edit the file’s contents.
The content of a property list file is formatted as either plain-text Extensible Markup Language (XML) or binary. The XML format is relatively human-readable, with normal text interspersed with special text tags that define the data structure for the information. Thus, you can view and attempt to decipher the XML code of plain-text-formatted property list files using any text-reading application.
Binary-encoded files are only readable using special tools designed to convert the binary code into human-readable format. Fortunately, macOS includes a Quick Look plug-in that allows you to easily view the contents of either type of property list file by simply pressing the Space bar while you have the file selected in the Finder.
If you need to edit a property list file, avoid using TextEdit, since it will improperly format any property list file that is saved as a binary. The most complete graphical application from Apple for editing property list files is Xcode. The Xcode application can decode binary property list files, and it enables you to view and edit any property list in an easy-to-read hierarchical format. Again, Xcode is an optional install that can be found in the Mac App Store.
Note
Avoid editing property list files that are currently in use by a running application or process. However, if you need to edit a property list that may be in use, make sure to restart the cfprefsd process, as covered earlier in this lesson.
Troubleshoot Application Resources
Although it’s rare, corrupted application software and associated nonpreference resources can be a source of application problems. These types of files rarely, if ever, change after the initial application installation, so the likelihood that such a resource is the cause of a problem is low.
However, keep in mind that many applications use other resources, such as fonts, plug-ins, and keychains, from the local and user Library folders as well as items in the Application Support folder. The hard part is locating the suspect resource; once you have, the fix is to simply remove or replace the corrupted resource and restart the application.
Note
Applications running in 64-bit mode do not load plug-in resources that support only 32-bit mode. This compatibility issue is covered earlier in this lesson.
Remember that corrupted resources in the user’s home folder Library affect only that user, whereas corrupted resources in the local Library affect all users. Use this fact to narrow your search when looking for a corrupted resource. Further, application and diagnostic report logs, covered earlier in this lesson, may tell you which resources the application was attempting to access when it crashed. Obviously, those resources should be your primary suspects.
If the application exhibits problems with only one user, attempt to locate the specific resource at the root of the problem in the user’s Library folder. Start with the usual suspects; if you find a resource that you think could be causing the problem, move that resource out of the user’s Library folder and restart the application.
Note
Some applications have a habit of storing their resources in the user’s Documents folder, so you may want to check there as well.
If you’ve determined that the application issue is persistent across all user accounts, start by reinstalling or upgrading to the latest version of the application. You will probably find that a newer version of the application is available—one that likely includes bug fixes. At the very least, by reinstalling you replace any potentially corrupted files that are part of the standard application. If you continue to experience problems after reinstalling the application, search through the local Library resources to find and remove or replace the corrupted resource.
Note
If you are discovering a large number of corrupted files, this probably indicates a much more serious file system or storage hardware issue. Troubleshooting these items is covered in Lesson 9, “Manage File Systems and Storage.”
Exercise 18.1 Force Applications to Quit
![]() Prerequisites
Prerequisites
![]() You must have created the Chris Johnson account (Exercise 5.1, “Create a Standard User Account”).
You must have created the Chris Johnson account (Exercise 5.1, “Create a Standard User Account”).
![]() You must have installed the Dead End application (Exercise 16.3, “Use a Drag-and-Drop Install”).
You must have installed the Dead End application (Exercise 16.3, “Use a Drag-and-Drop Install”).
In this exercise, you will learn how to determine when an application has become unresponsive. You will see various ways to force unresponsive applications to quit: from the Dock, using the Force Quit window, and using Activity Monitor. Even background processes without a user interface can have issues and stop running, so you’ll learn how to manage these processes as well. You will also see how to open an application in 32-bit mode.
Force an Application to Quit via the Dock
1 If necessary, log in as Chris Johnson.
2 Open the Dead End application you installed in Exercise 16.3, “Use a Drag-and-Drop Install.”
The primary purpose of Dead End is to become unresponsive, giving you an opportunity to practice different ways to force an application to quit.
Dead End opens a window with a “Download the Internet” button.
3 Click “Download the Internet.”
Dead End becomes unresponsive. After a few seconds you may see the wait cursor (a colored pinwheel). Note that the wait cursor appears only when you mouse over the Dead End window or (if Dead End is in the foreground) the menu bar.
4 Control-click the Dead End icon in the Dock, and then choose Force Quit from the shortcut menu. Alternatively, you could click and hold the Dead End icon in the Dock and then choose Force Quit from the pop-up menu.
If Force Quit does not appear in the menu, repeat step 3 or hold down the Option key. When you hold down the Option key, Quit changes to Force Quit, and you can then choose it to force Dead End to quit.
Use the Force Quit Window
1 Open the Dead End application again so you can try another method of forcing an application to quit.
One way to open applications you’ve used recently is by going to the Apple menu and choosing Recent Items. By default, the system remembers the last ten applications you’ve opened.
2 Click “Download the Internet.”
3 Press Command-Option-Escape to open the Force Quit Applications window.
Note that it will take about 15 seconds before Dead End is shown as “not responding.”
4 Select Dead End, and click Force Quit.
5 In the confirmation dialog, click Force Quit.
6 If you are given the opportunity to send a report to Apple, click Ignore.
7 Close the Force Quit Applications window.
Use Activity Monitor
There may be times when you need another method to force an application to quit. Activity Monitor not only forces applications to quit but also allows you to review all processes running on the computer, gather information, and quit them when necessary.
1 Open Dead End.
2 Click “Download the Internet.”
3 Open Activity Monitor (from the Utilities folder).
Even though the wait cursor appears in Dead End, you can still click the desktop to make the Finder active or click in the Dock to use Launchpad. A single unresponsive application should not affect the rest of the system.
Activity Monitor displays a list of all running processes. When you open this window, it shows some processes that you will recognize as applications. It also shows other processes running in the background that do not have a graphical user interface.
4 If necessary, click the CPU tab above the process list.
5 If the “% CPU” in the table header is not already selected, click it twice to get a top-down (most to least) list of processes in terms of their CPU usage. The arrowhead that appears next to “% CPU” should point downward.
6 Look for the Dead End process by name. It should be at the top.
The name of an unresponsive application appears in red with a note declaring the application is “Not Responding.” As you look at the Dead End process, notice how the CPU usage is close to 200 percent. You can see how an application can hijack your CPU, even though the application is not responding and appears to be doing nothing.
Note that the % CPU statistic refers to the percentage of a CPU core being used. Current Mac computers have multiple cores and hyperthreading, so even “200%” CPU utilization is not fully using the computer’s CPU power.
7 Choose Window menu > CPU Usage. This opens a window that displays how many processor cores your computer has and how busy each one is.
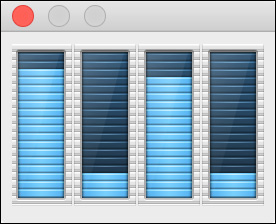
This example screenshot was taken on a computer with two physical cores, but hyperthreading allows each of those to do two things at once, giving it four virtual cores. As you can see, 200 percent is only half what it is capable of.
8 Select Dead End in the process list, and then click the quit process button (its icon is an “X” in an octagon) on the toolbar.
9 When asked to confirm, click Force Quit.
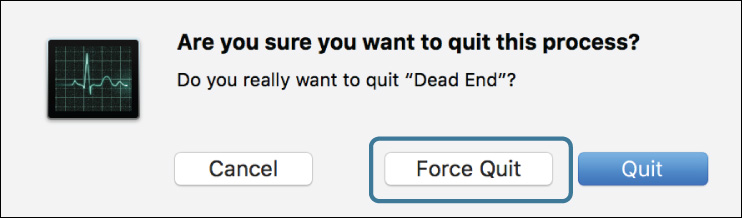
Note that Quit is the default option in the dialog that appears. However, since Dead End is not responding, it will not respond to a normal Quit command either. Therefore, you need to use Force Quit to stop this process from running.
Dead End disappears from the process list in the Activity Monitor window and from the Dock. After a few seconds, the CPU Usage window updates to show that utilization has decreased.
Unlike the Dock and Force Quit Applications window, Activity Monitor is capable of forcing background processes to quit. Background processes are generally programs that are launched automatically to provide some part of the system’s functionality. Normally, you will not have to manage them explicitly, but in a few cases forcing them to quit is useful.
10 Select SystemUIServer in the process list. It may help to use the Search field in the upper right of the window. Remember its process ID (PID) number, shown in a column to the right.
SystemUIServer manages the menu bar items on the right side of the menu bar. Each menu bar item runs as a plug-in inside of the SystemUIServer, and if one of them locks up, it might be necessary to force SystemUIServer to quit.
11 With SystemUIServer selected, click the quit process (“X”) button, and then watch the right side of the menu bar as you click Force Quit.
The right side of the menu bar goes blank, and then the menu bar items reappear. Examine your process list, and notice that SystemUIServer is running but with a different process ID than it had before.
What has happened is that the launchd process (another background process) has detected that SystemUIServer exited and has automatically relaunched it. launchd is responsible for starting and monitoring many of the system’s background processes and restarts them if necessary.
Not all processes can be safely forced to quit this way. For example, forcing WindowServer (a system process) to quit would immediately end your login session. Lesson 26, “Troubleshoot Startup and System Issues,” discusses launchd in more detail.
12 Leave Activity Monitor open for the next section.
Open an Application in 32-Bit Mode
Most applications that come with macOS Sierra can run only in 64-bit mode; however, some can run in either 32- or 64-bit mode but normally run in 64-bit mode. If you need to, you can run these applications in 32-bit mode (for example, in case they need to load a plug-in that runs only in 32-bit mode).
1 In Activity Monitor, choose View menu > Columns > Kind.
This adds a Kind column to the display, showing what mode each process is running in. Normally, all the processes run in 64-bit mode.
2 Open Dead End.
3 In Activity Monitor, find the Dead End process, and note that its Kind is also listed as 64 bit.
4 Quit Dead End.
5 In the Finder, select the Dead End application, and choose File menu > Get Info (Command-I).
6 In the General section of the Info window, select “Open in 32-bit mode.”
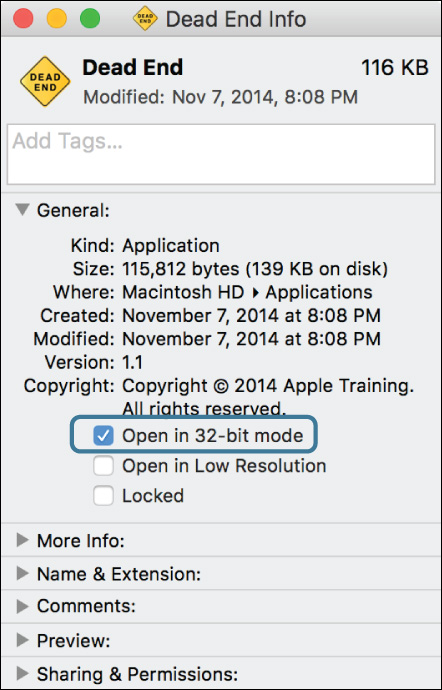
You will also see several other options; exactly which are available depends on the application, as well as whether you are using a Retina display.
7 Close the Info window, and reopen the Dead End application.
8 In Activity Monitor, find the new Dead End process.
Its Kind is now listed as 32 bit.
9 Quit Dead End.
View System Processes and Usage
1 In Activity Monitor, choose View menu > All Processes.
You see many more processes appear in the process list. In addition to the background processes within your user session (sometimes called agents), macOS has many background processes (sometimes called daemons) running outside of your login session.
2 At the top of the Activity Monitor window, switch through the CPU, Memory, Energy, Disk, and Network tabs, and examine the information they display for each process, as well as the overall statistics at the bottom of the window.
3 If you are continuing to Exercise 18.2, leave Activity Monitor running because you will use it again.
Exercise 18.2 Troubleshoot Preferences
![]() Prerequisite
Prerequisite
![]() You must have created the Chris Johnson account (Exercise 5.1, “Create a Standard User Account”).
You must have created the Chris Johnson account (Exercise 5.1, “Create a Standard User Account”).
Most application preferences are created and stored for individual users in their personal Library folder. This compartmental approach can help when you are troubleshooting application issues. You’ll learn how to set and restore a preference and see the effect of moving a preference file out of the ~/Library folder.
2 Open Preview from the Applications folder.
3 Open Preview preferences by choosing Preview menu > Preferences (Command-Comma).
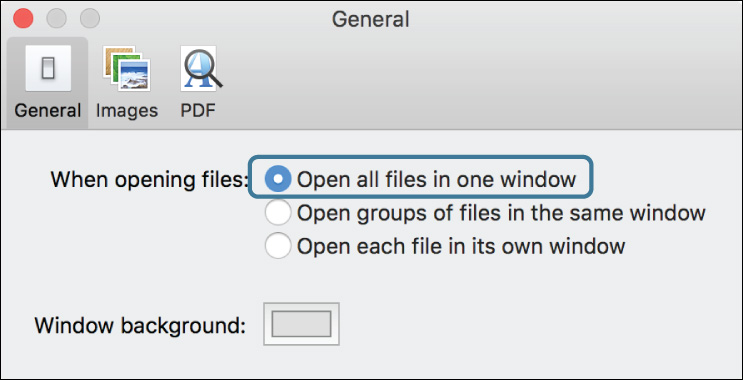
Note that the default setting for “When opening files” is “Open groups of files in the same window.”
4 Select “Open all files in one window.”
5 Close the Preferences window, and quit Preview.
6 In the Finder, open ~/Library.
Remember that since the user Library folder is invisible, the easiest way to navigate to this folder is to hold down the Option key and choose Go menu > Library.
Preview is a sandboxed application, so its real preference file is not in the ~/Library /Preferences folder but in a sandbox container. See Reference 13.1, “About macOS File Resources,” for more details about sandbox containers.
7 In the ~/Library folder, open the Containers folder and then the com.apple.Preview folder under that.
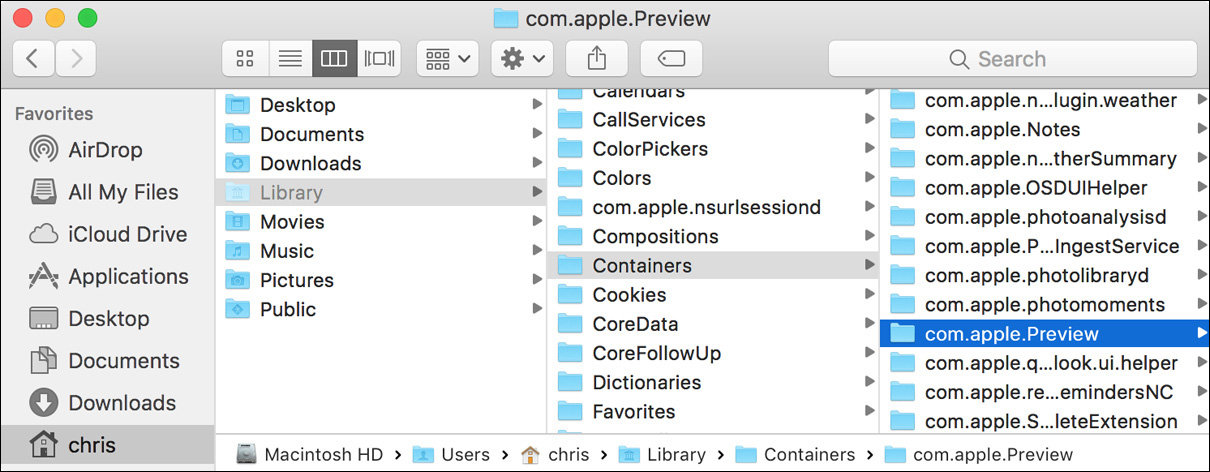
It contains a Data subfolder, with a structure that mirrors your home folder. Most of its contents are aliases, pointing to their “real” counterparts.
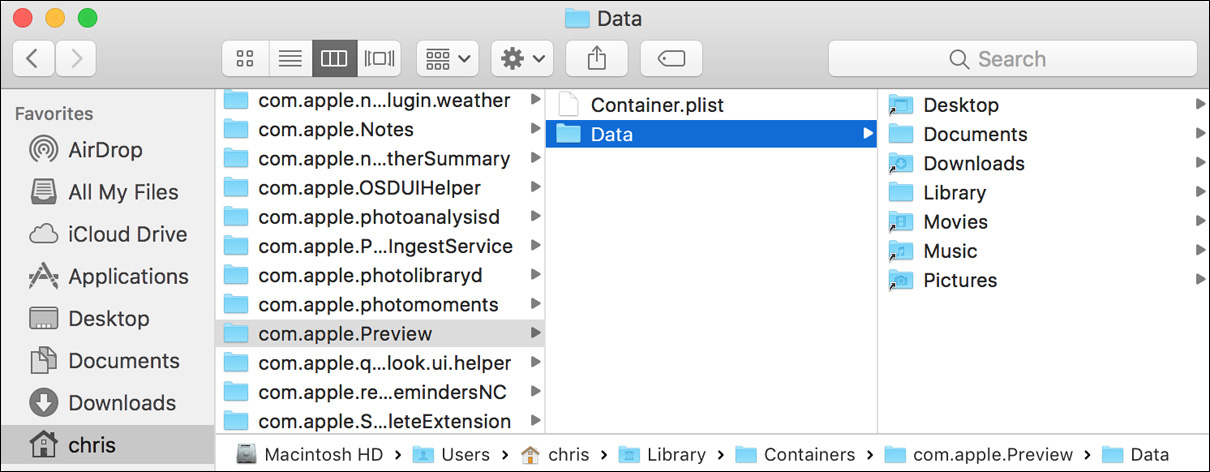
8 Navigate down to Data/Library/Preferences, and select the com.apple.Preview.plist file.
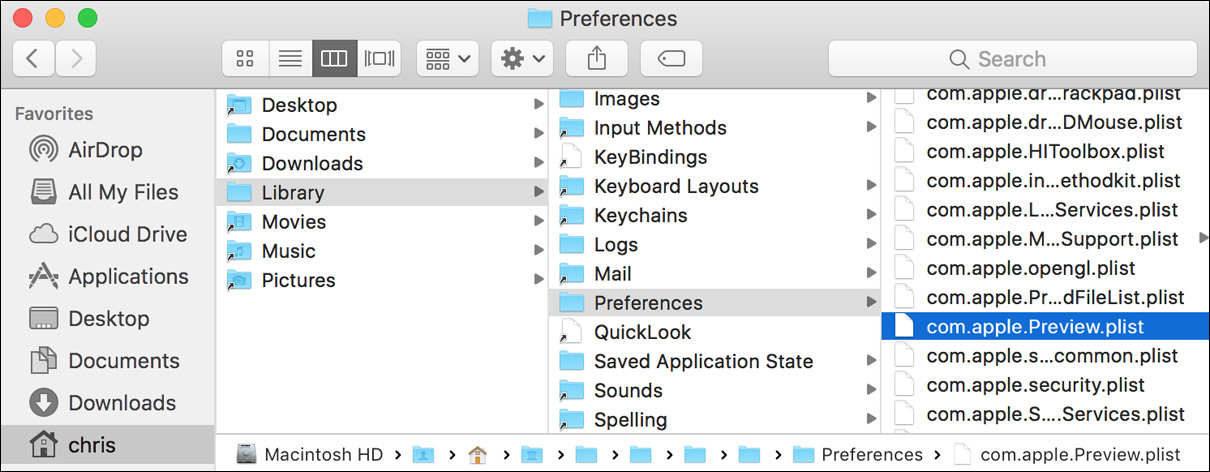
9 Use Quick Look to view the preference file’s contents (Command-Y).
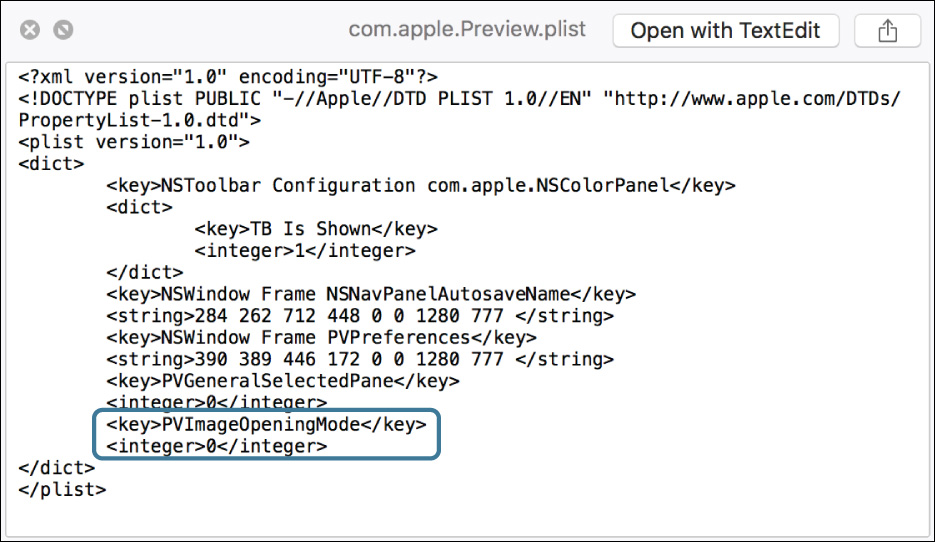
The preferences setting you made is listed here, although in somewhat cryptic form.
10 Close the Quick Look window.
Disable and Restore Preferences
Moving an application’s preferences file is not always enough to reset its preferences, since the preferences agent (named cfprefsd) may remember its old settings. To make sure the preferences reset, quit the program and then the preferences agent, and then move the file.
1 If the Activity Monitor utility is not running, open it.
2 In Activity Monitor, choose View menu > My Processes.
3 Make sure Preview is not running (it may help to sort the process list by process name, or use the Search field). If it is running, quit it.
4 Select cfprefsd in the process list, and then click the quit process button (the “X” in an octagon icon) in the toolbar.
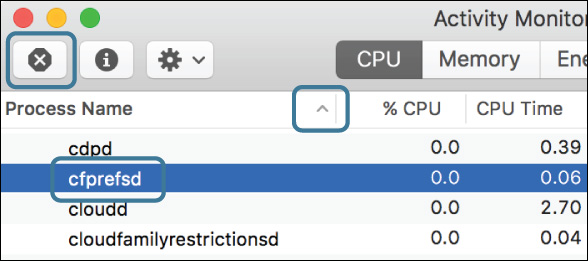
5 In the confirmation dialog, click Quit. Since the process is responding normally, it is not necessary to use Force Quit.
A new cfprefsd process will start automatically when it is needed. This sometimes happens so quickly that you may not see it vanish from the Activity Monitor list.
6 Switch to the Finder, and drag the com.apple.Preview.plist file to your desktop. Leave the Preferences folder open for later.
7 Open Preview again, and open its preferences (choose Preview menu > Preferences, or press Command-Comma).
The setting for “When opening files” has reset to its default of “Open groups of files in the same window.”
8 Quit Preview.
9 Switch back to Activity Monitor, and quit cfprefsd again.
10 In the Finder, move the com.apple.Preview.plist file from your desktop back into the Preferences folder.
11 If you are notified that a newer item named com.apple.Preview.plist already exists, click Replace.
12 Open Preview again, and open its preferences.
This time your custom preference setting (“Open all files in one window”) has been restored.
13 Quit Preview.
Manage Corrupted Preferences
macOS has some built-in features for dealing with corrupted preference files. You will explore what happens when a preference file becomes corrupted.
1 Use Activity Monitor to quit cfprefsd again.
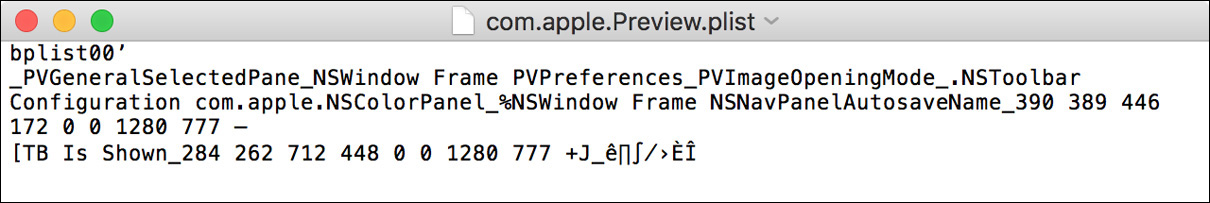
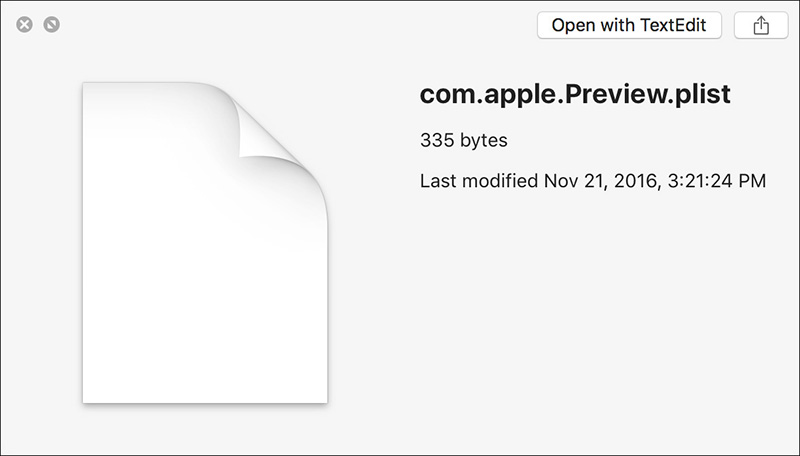
2 In the Finder, Control-click the com.apple.Preview.plist file, and choose Open With > TextEdit from the shortcut menu.
Some PLIST files are stored in an XML/text format, which TextEdit can edit like any other text document. This PLIST file, however, is stored in a binary format TextEdit cannot fully display or edit. As a result, you see only part of the file’s contents.
3 Add some new text anywhere in the document.
4 Quit TextEdit. Note that the changes are saved automatically.
5 Try to view the file using Quick Look (select it and press Command-Y).
By editing the file as if it were plain text, you have damaged its binary structure. As a result, Quick Look cannot display its contents and shows a generic view.
6 Close the Quick Look window.
7 Reopen Preview, and open its preferences.
Since the preferences file was damaged, the system has reset it, and the setting for “When opening files” has reset to its default of “Open groups of files in the same window.”
8 Quit Preview, Activity Monitor, and any other apps that are still open.
9 Log out as Chris Johnson.
Exercise 18.3 Examine Application Diagnostics
![]() Prerequisites
Prerequisites
![]() You must have created the Local Admin (Exercise 2.1, “Configure a New macOS System for Exercises,” or Exercise 2.2, “Configure an Existing macOS System for Exercises”) and Chris Johnson (Exercise 5.1, “Create a Standard User Account”) accounts.
You must have created the Local Admin (Exercise 2.1, “Configure a New macOS System for Exercises,” or Exercise 2.2, “Configure an Existing macOS System for Exercises”) and Chris Johnson (Exercise 5.1, “Create a Standard User Account”) accounts.
![]() You must have installed and forced the Dead End application to quit (Exercise 16.3, “Use a Drag-and-Drop Install,” and Exercise 18.1, “Force Applications to Quit”).
You must have installed and forced the Dead End application to quit (Exercise 16.3, “Use a Drag-and-Drop Install,” and Exercise 18.1, “Force Applications to Quit”).
The Console utility is the primary tool in macOS for viewing system activity and event logs. In this exercise, you will use it to view diagnostic logs and to search the system log for application events.
View System Activity
1 If necessary, log out as Chris Johnson.
2 Log in as Local Admin.
The log files you’ll examine in this exercise are readable only by administrators.
3 Open the Console utility.
Console is the primary tool in macOS for viewing logs. Its sidebar lets you view the computer’s general log, as well as specific log files.
4 If necessary, select your computer in the Devices section of the sidebar.
5 In the toolbar, make sure that Now is selected, and Activities is not selected.
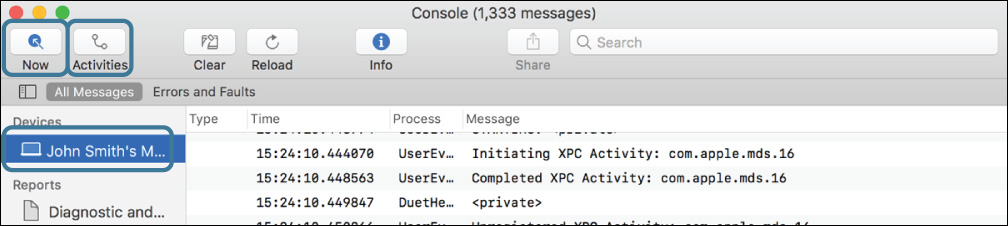
This view shows a wide variety of background events in macOS as they happen.
6 Select one of the events.
7 If necessary, select Info in the toolbar.
Details about the event are shown in the pane below the event list.
Gather Information About the Dead End Application
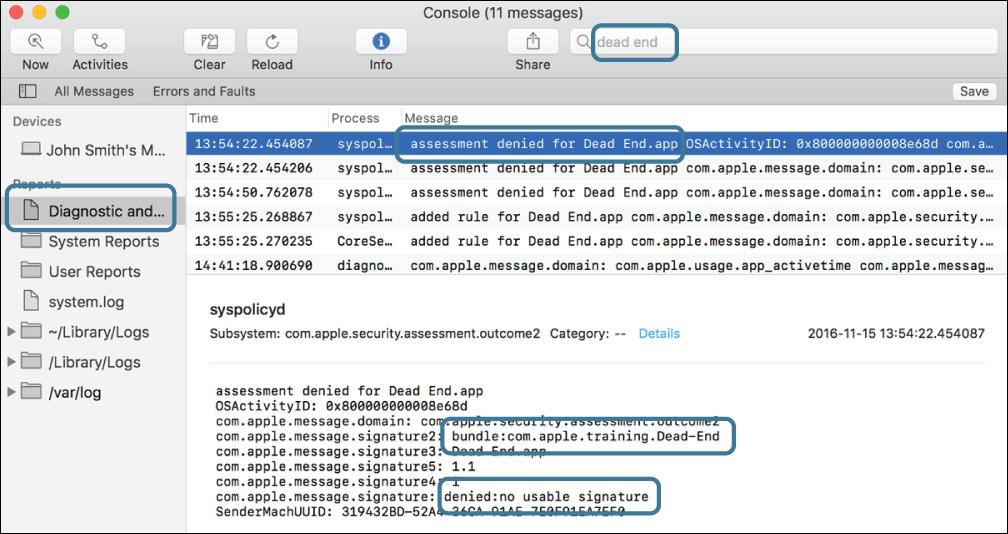
1 In the Reports section of the sidebar, select “Diagnostic and Usage Data” (the full name will not be visible).
2 In the Search field, enter dead end (the application you used in Exercise 18.1).
3 Scroll to the top of the message list.
If you performed Exercise 16.3 within the last few days, the first few messages relate to the first time you ran the Dead End application. The application was initially denied by the Gatekeeper policy, but then when you overrode that a rule was added allowing it to run.
4 If there are any “assessment denied” messages, select one.
Among other things, the message details will include the application’s bundle ID (com.apple.training.Dead-End) and the reason access was denied (“no usable signature,” because the application is not code-signed).
5 Click the Now button in the toolbar to show the latest messages.
The more recent messages relate to Dead End hanging or using excessive CPU time.
6 Select some of the recent messages and examine their details. Some of the messages from the spindump process will list the domain “com.apple.crashreporter.writereport .hang,” which means that spindump wrote out a report with details of Dead End’s status because it was not responding. You will view these reports shortly.
Note that although you see messages relating to Dead End hanging, you do not see anything about it being force-quit. To see that, you must look in a different place.
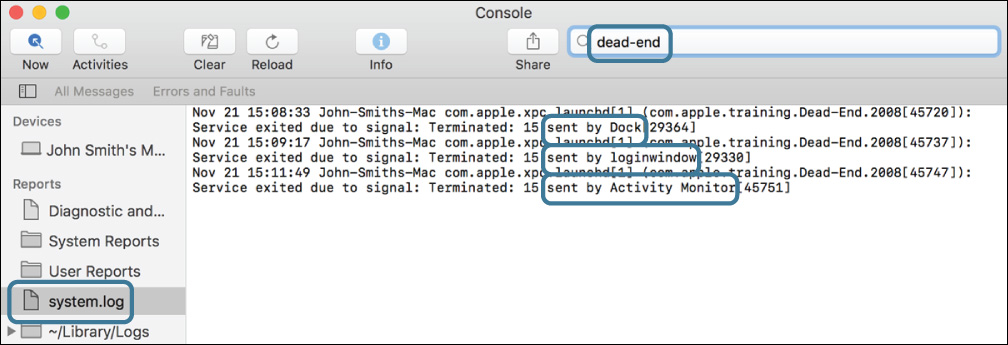
7 In the Console sidebar, select “system.log.”
8 In the Search field, enter dead end.
Here you also see messages relating to spindump saving reports about Dead End, but nothing about Dead End being force-quit. There are messages in this log about it being force-quit, but they identify the application by its bundle ID (com.apple.training.Dead-End) rather than its name.
It is normal to have to look through multiple logs and do multiple searches for relevant messages, in order to piece together the full story of a particular problem or event.
9 Change the Search field to dead-end.
Now you see messages relating to the Dead End application being force-quit, and in each case showing which other process did the force-quit. In addition to the Dock and Activity Monitor, you see “loginwindow,” the process that handles the Force Quit window.
10 In the sidebar, select System Reports.
A second column opens, listing log files in this category. Unlike the other logs you’ve viewed so far, which list sequences of events, each of these files contains a detailed report about a single event.
11 In the second column, select one of the log files that starts “Dead End.”
12 Erase the Search field to show the file’s full contents.
Each file here shows that the system detected a problem with Dead End—hanging, using excessive CPU resources, or both. They give details about what was happening inside the Dead End application, and also list other related processes and what they were doing.
13 Quit Console and log out as Local Admin.