
Let us step back and think again what we are trying to achieve here. Actually, we do not need a classifier that perfectly predicts good and bad answers, as we measured it until now using accuracy. If we can tune the classifier to be particularly good in predicting one class, we could adapt the feedback to the user accordingly. If we had a classifier, for example, that was always right when it predicted an answer to be bad, we would give no feedback until the classifier detected the answer to be bad. Contrariwise, if the classifier succeeded in predicting answers to be always good, we could show helpful comments to the user at the beginning and remove them when the classifier said that the answer is a good one.
To find out which situation we are in here, we have to understand how to measure precision and recall. To understand this, we have to look into the four distinct classification results as they are described in the following table:
|
Classified as | |||
|---|---|---|---|
|
Positive |
Negative | ||
|
In reality it is |
Positive |
True positive (TP) |
False negative (FN) |
|
Negative |
False positive (FP) |
True negative (TN) | |
For instance, if the classifier predicts an instance to be positive and the instance indeed is positive in reality, this is a true positive instance. If on the other hand, the classifier misclassified that instance saying that it is negative while in reality it is positive, that instance is said to be a false negative.
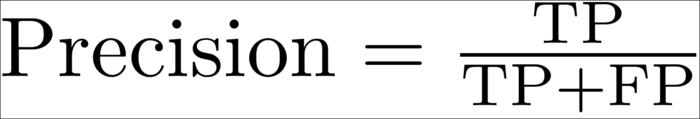
What we want is to have a high success rate when we are predicting a post as either good or bad, but not necessarily both. That is, we want as many true positives as possible. This is what precision captures:
If instead our goal would have been to detect as much good or bad answers as possible, we would be more interested in recall:
The next screenshot shows all the good answers and the answers that have been classified as being good ones:
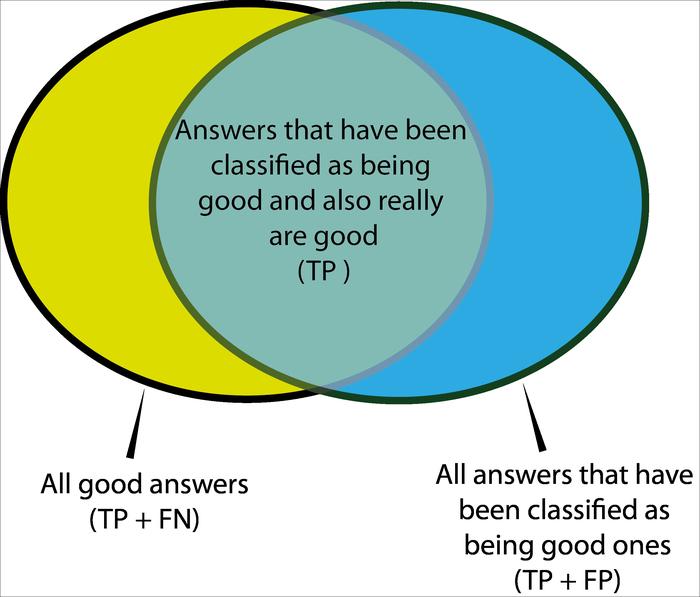
In terms of the previous diagram, precision is the fraction of the intersection of the right circle while recall is the fraction of the intersection of the left circle.
So, how can we optimize for precision? Up to now, we have always used 0.5 as the threshold to decide whether an answer is good or not. What we can do now is to count the number of TP, FP, and FN instances while varying that threshold between 0 and 1. With these counts, we can then plot precision over recall.
The handy function precision_recall_curve() from the metrics module does all the calculations for us as shown in the following code:
>>> from sklearn.metrics import precision_recall_curve
>>> precision, recall, thresholds = precision_recall_curve(y_test, clf.predict(X_test)
Predicting one class with acceptable performance does not always mean that the classifier will predict the other classes acceptably. This can be seen in the following two graphs where we plot the Precision/Recall curves for classifying bad (left graph of the next screenshot) and good (right graph of the next screenshot) answers:
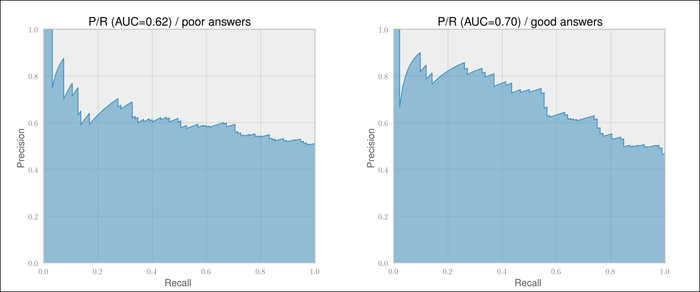
We see that we can basically forget about predicting bad answers (the left graph of the previous screenshot). This is because the precision for predicting bad answers decreases very quickly, at already very low recall values, and stays at an unacceptably low 60 percent.
Predicting good answers, however, shows that we can get above 80 percent precision at a recall of almost 40 percent. Let us find out what threshold we need for that with the following code:
>>> thresholds = np.hstack(([0],thresholds[medium]))
>>> idx80 = precisions>=0.8
>>> print("P=%.2f R=%.2f thresh=%.2f" %  (precision[idx80][0], recall[idx80][0], threshold[idx80][0]))
P=0.81 R=0.37 thresh=0.63
Setting the threshold at 0.63, we see that we can still achieve a precision of above 80 percent, detecting good answers when we accept a low recall of 37 percent. This means that we will detect only one in three bad answers, but those answers that we manage to detect we would be reasonably sure of.
To apply this threshold in the prediction process, we have to use predict_proba(), which returns per class probabilities, instead of predict(), which returns the class itself:
>>> thresh80 = threshold[idx80][0]
>>> probs_for_good = clf.predict_proba(answer_features)[:,1]
>>> answer_class = probs_for_good>thresh80
We can confirm that we are in the desired precision/recall range using classification_report:
>>> from sklearn.metrics import classification_report
>>> print(classification_report(y_test, clf.predict_proba [:,1]>0.63, target_names=['not accepted', 'accepted']))
                 precision    recall   f1-score    support
not accepted         0.63      0.93      0.75       108
accepted             0.80      0.36      0.50        92
avg / total          0.71      0.67      0.63       200