
The top program provides a continuously updated real-time view of the processes running on a system after every 2 seconds, until its execution is stopped by pressing q. It displays multiple pieces of information, including system uptime, a list of the running tasks, the CPU status, and a memory status summary, followed by the different resources consumed by each process. The top command is executed as follows:
$ top
The output on execution of the preceding command is shown in the following screenshot:
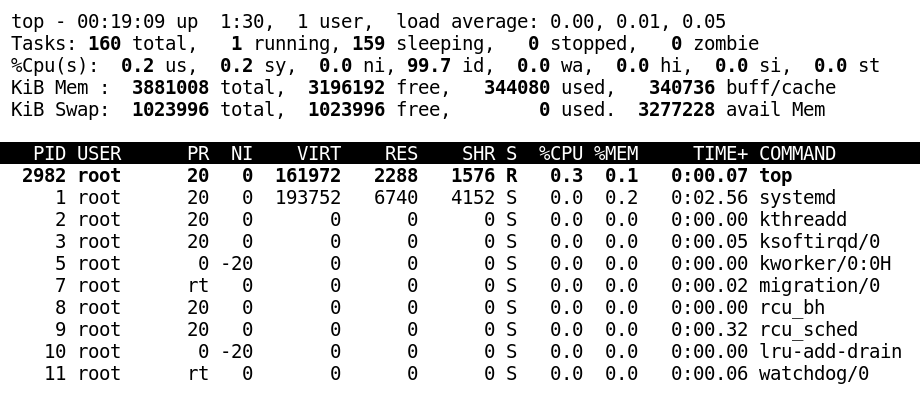
The output shows a system information summary, followed by each different processes' information in rows, with the descending order of CPU usage in the following columns:
|
System Information Summary |
|
|
1) The first line displays how long the system has been up, how many users are logged on, and what the load average is. |
|
|
2) The second line displays the total number of processes followed by the number of running, sleeping, stopped, and zombie processes. |
|
|
3) The third line displays the various CPU usage parameters: |
|
|
us |
Percentage of CPU time used running un-niced user processes |
|
sy |
Percentage of CPU time used running kernel processes |
|
ni |
Percentage of CPU time used running user-niced processes |
|
id |
Percentage of CPU time spent when the kernel handler was idle |
|
wa |
Percentage of CPU time spent waiting for I/O completion |
|
hi |
Percentage of CPU time spent serving hardware interrupts |
|
si |
Percentage of CPU time spent serving software interrupts |
|
st |
Steal time is the percentage of a CPU's idle time used by the virtual machine's hypervisor |
|
4) The fourth and fifth lines display memory usage. Line number four displays physical memory and line number five displays virtual memory. |
|
|
5) The sixth line contains the heading for the process information list in descending order of CPU usage. It has the following fields: |
|
|
PID |
Process ID number. |
|
USER |
Username of the owner of the process. |
|
PR |
System priority of the process. |
|
NI |
User priority value for a process, also known as the nice value. |
|
VIRT |
Total memory a process is using. Virtual memory is a combination of resident set, shared memory, and swapped memory. |
|
RES |
Physical memory used by a process. |
|
SHR |
Shared memory used by a process. |
|
S |
Process status codes are displayed here (D,R, S, T, and Z). |
|
%CPU |
Percentage of CPU used since the process started. |
|
%MEM |
Percentage of memory used by a process. |
|
TIME+ |
Execution time. |
|
COMMAND |
Command name used to start the process. |
The top command is like command line Task Manager in Linux. Using top, we can perform interactive monitoring and manage running processes. There are quite a few single-key shortcuts to manage the different attributes of a running process.
The following table lists various keyboard shortcuts that are used to manage the top command, as well as their descriptions:
|
Keyboard shortcut (on top)
|
Description |
|
t |
Toggle display of summary information |
|
m |
Toggle display of memory information |
|
l |
Toggle display of uptime information |
|
1 |
Toggle display of all CPUs' summary or individual CPU's summary |
|
H |
Toggle threads display in summary information of tasks |
|
s |
Change the refresh rate of the screen in seconds |
|
A |
Sort the process list by the top resource consumers |
|
r |
Renice (change the priority) a selected process, by providing PID and then the nice value |
|
k |
Send a signal to a specific process (the default signal is to terminate), by providing PID and then a signal number |
|
f |
Open the configuration screen of the top command |
|
M |
Sort processes by memory usage, in descending order |
|
P |
Sort processes by CPU utilization in descending order |
|
? or h |
Display help for interactive keystrokes |
|
U |
Filter display for usernames |
|
q |
Quit |
|
Enter, Space key |
Immediately refreshes the displayed information |
The following are examples to explain the usage of the top command:
- Display the process status of only the specified pid with the following command:
$ top -p pid
- Specify a delay between consecutive screen refreshes while running top commands with the following command:
$ top -d 2
- Display the top command's output for specified iterations only by using the following command:
$ top n <number>