
Chapter 15. Building the Help Desk Tabular Cube
We built a great application using LightSwitch that captures help desk tickets and groups them into queues. We deployed it to a server and wrote some T-SQL scripts to load in sample data from the Microsoft Adventure Works database. In this chapter, we will use Microsoft SQL Server 2012 PowerPivot for Microsoft Excel 2010 to build a tabular cube based on our LightSwitch-generated database. We will also source some additional data from the Windows Azure Marketplace DataMarket that we will use to enrich our model.
Just like developing in LightSwitch, using PowerPivot to develop our cube is a very iterative process and we will be using Excel pivot tables as a client to test our model and then switch back to PowerPivot to further refine the cube. This chapter will be heavily focused on building our cube in PowerPivot.
The prerequisites for this chapter are simple. You need Excel 2010 and the Microsoft SQL Server 2012 PowerPivot add-in installed and an account that has rights to access the SQL Server database containing our data. Let’s launch Excel and activate the PowerPivot ribbon. To learn how to enable the “Office Client Integration for PowerPivot” see Chapter 39.
Go ahead and launch the PowerPivot window, as shown in Figure 15-1.
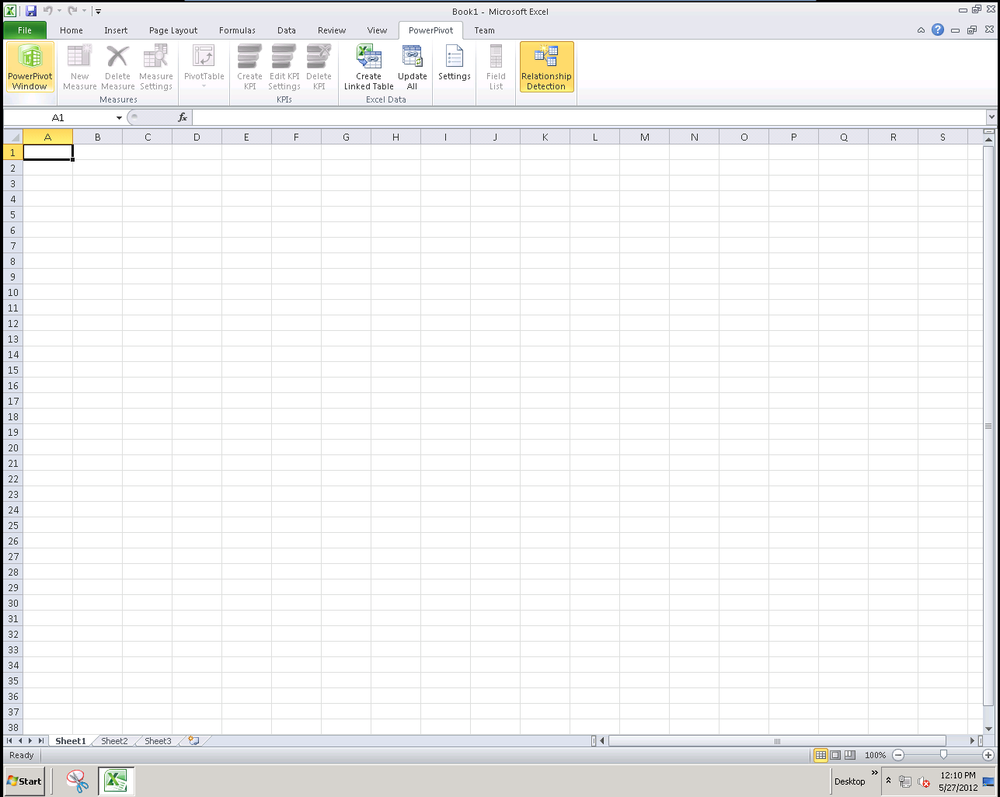
You’ll notice that a new window is launched for the PowerPivot for Excel add-in. The nice thing about PowerPivot launching as a separate application is that it’s easy to Alt-Tab back and forth between your model in PowerPivot and the Excel client where we consume the data.
Importing SQL Server Data into PowerPivot
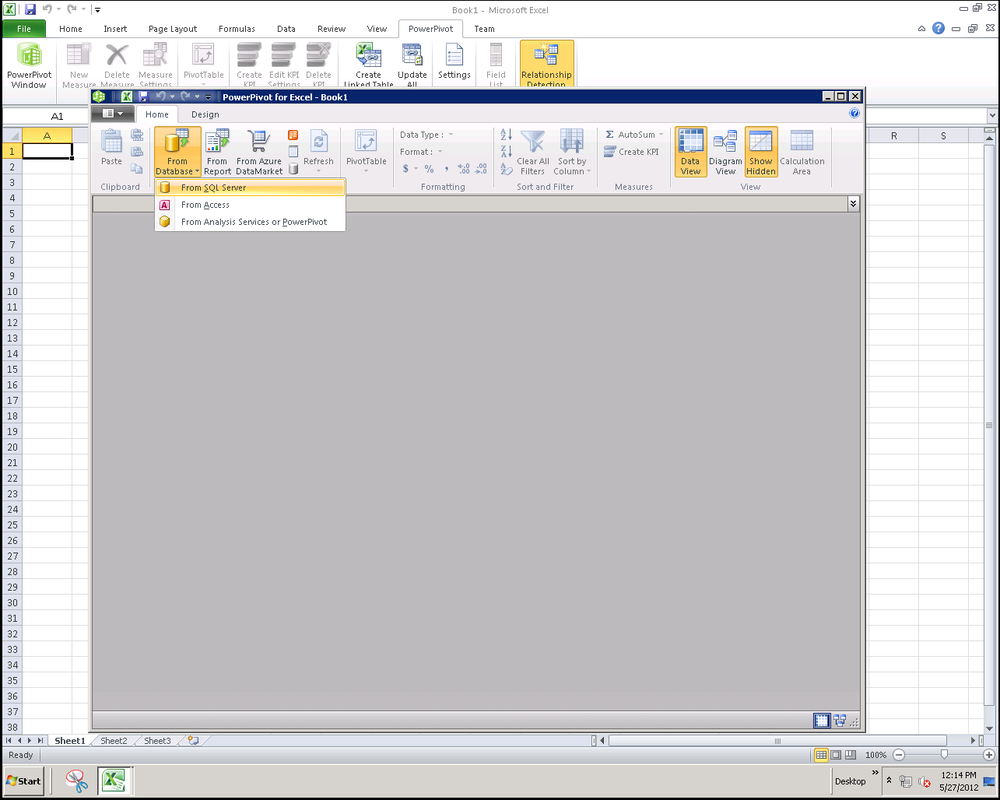
The ribbon in PowerPivot has a number of options for getting external data into our model. Choose From Database → From SQL Server to start the import process as shown in Figure 15-2.
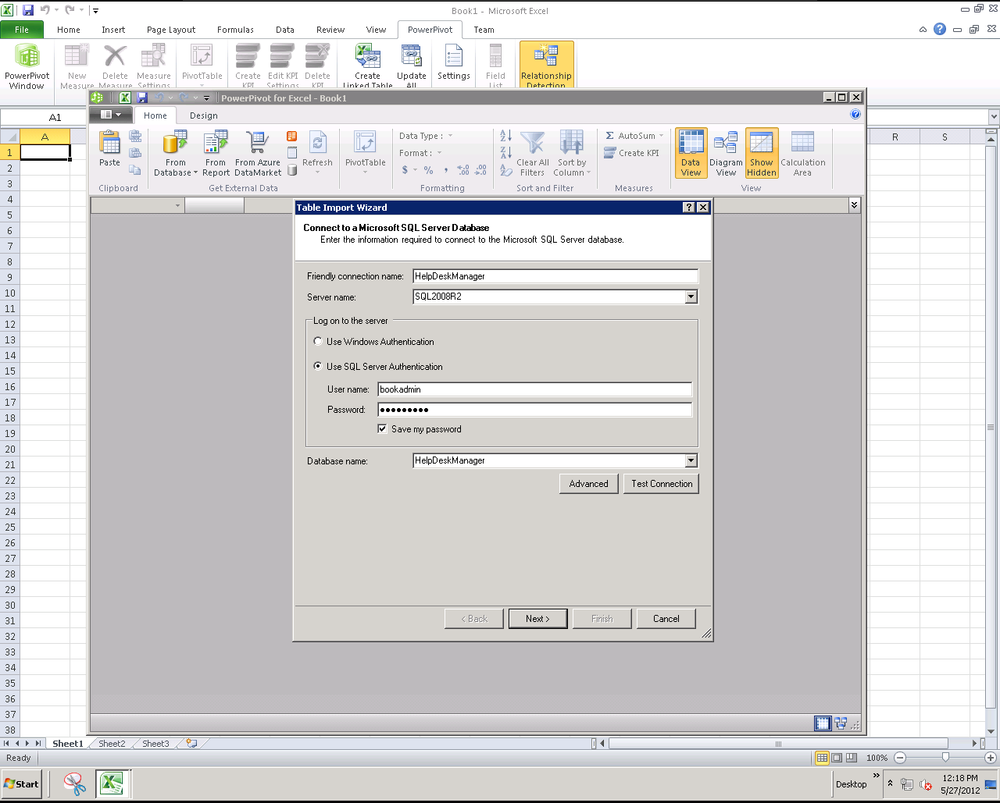
PowerPivot will now walk you through the Table Import Wizard to import our data. This should be pretty familiar now since we’ve used similar wizards throughout the development and deployment process for our LightSwitch application. In this case, the “Friendly connection name” is used to describe the data source if we go back to import more data from this connection in the future. You can provide either the server name or the fully qualified domain name for your SQL Server and provide credentials that have read access to the data we’re looking to import. Remember to click “Test Connection” to validate the connection information before proceeding to the next step. This should look very similar to Figure 15-3.
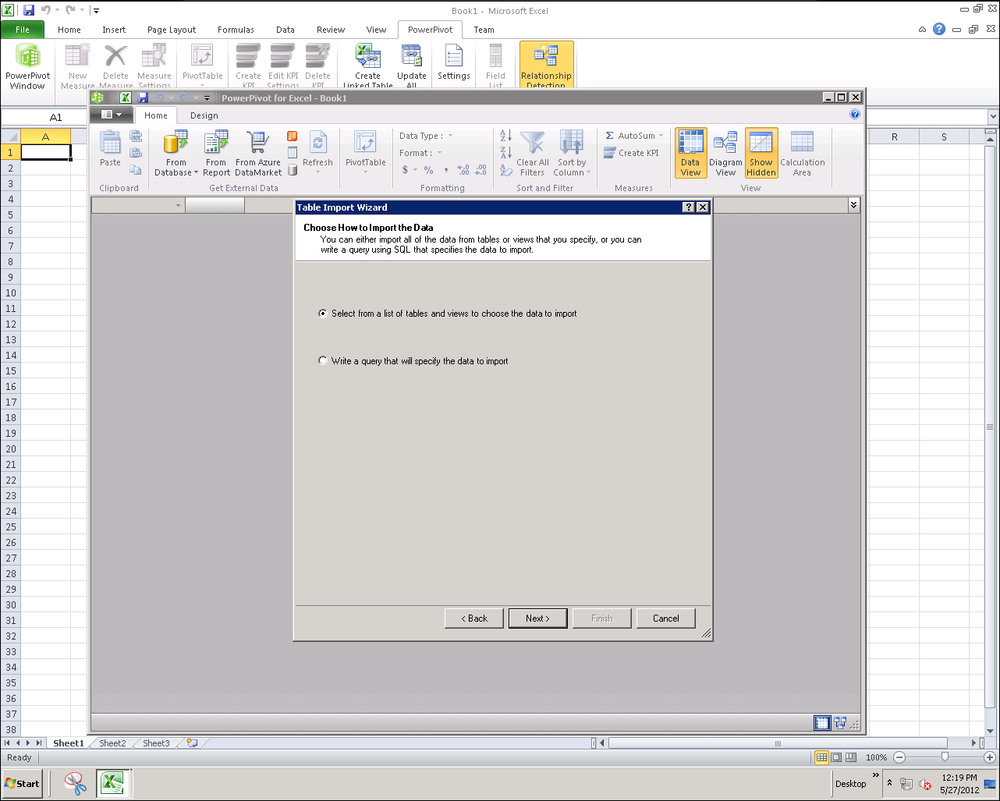
Now that we’ve established a connection to our database, we have a choice to either directly import tables and views into our model or to write a query to identify the data to import. In the real world, it’s likely that you’ll always be able to import the tables and views, but there are certainly some cases where it makes sense to write your own query. T-SQL is a powerful language. If you find yourself having a large number of highly normalized tables, you may want to de-normalize or flatten them a bit by writing your own custom query so you have fewer tables to work with in your model. The other use case that may drive you to write a query is having huge volumes of data. As an example, I’ve built solutions summarizing web server and SharePoint usage logs with 50 million rows of data. In this case, I was able to aggregate and summarize my hits at a week level per user in my SQL statement. This dramatically decreased the size of the cube without compromising the solution.
Note
If you are using the Visual Studio 2012 version of LightSwitch, you can also import data using the OData services on your application server in place of importing tables from the database
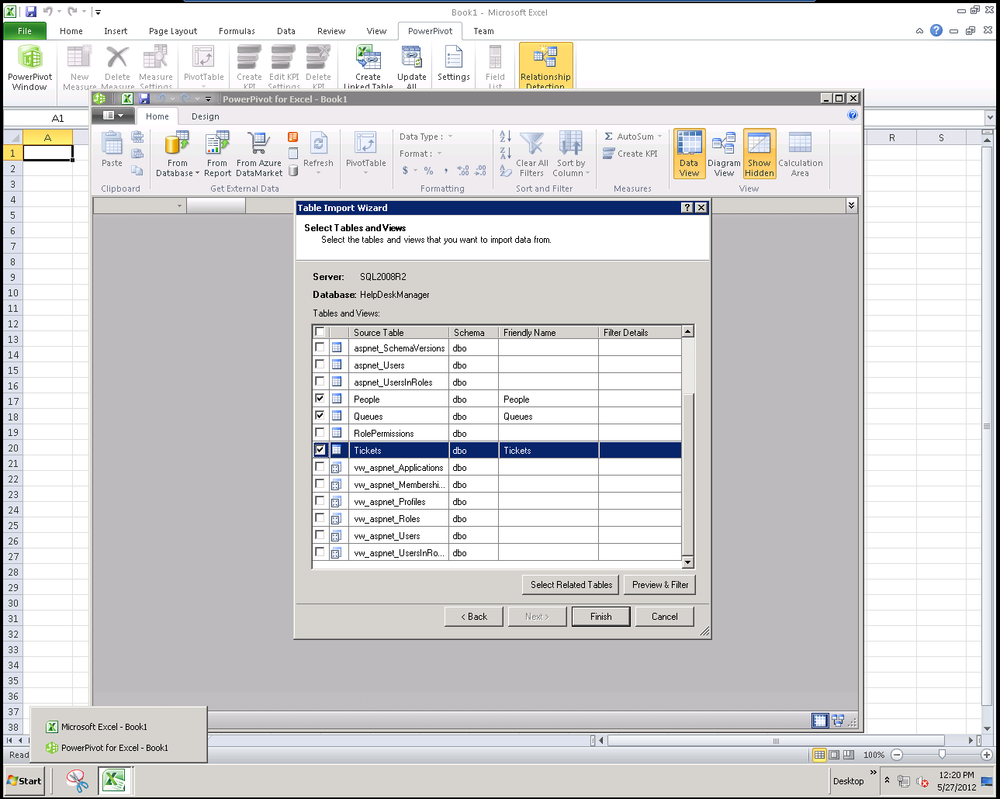
In summary, if you have many smaller de-normalized tables or several million rows, consider writing a query to simplify the data that you bring into your cube. We have neither of those scenarios in our cube so we’ll choose to pull in the tables in our LightSwitch database as shown in Figure 15-4 and Figure 15-5.
In Figure 15-5, we show that you have the ability to choose which tables or views in your database are imported into PowerPivot. We can manually choose all the tables to import or select a single table and choose to select the related tables based on foreign keys defined in SQL Server.
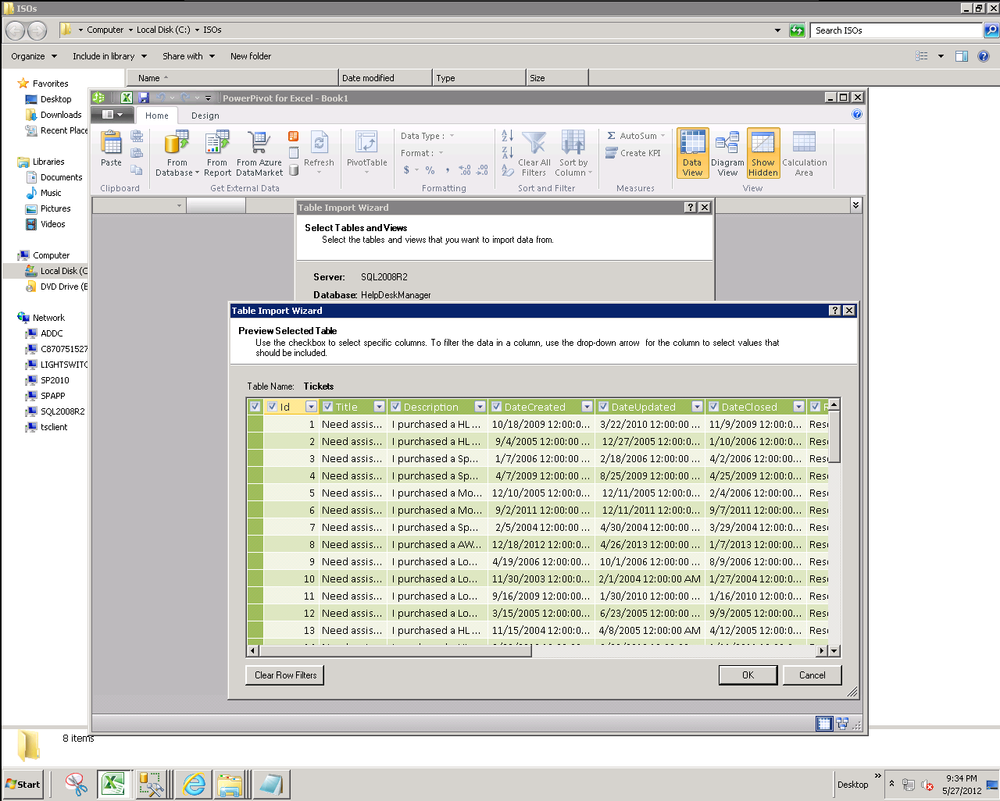
For a currently selected table, you can use the Preview & Filter button to view some sample data from the table and even apply additional filter criteria. Date filters are particularly interesting as there is support for filtering records for This Month, Last Month, or Last Year. which allow you to report on a relative time frame without needing to write a custom SQL query.
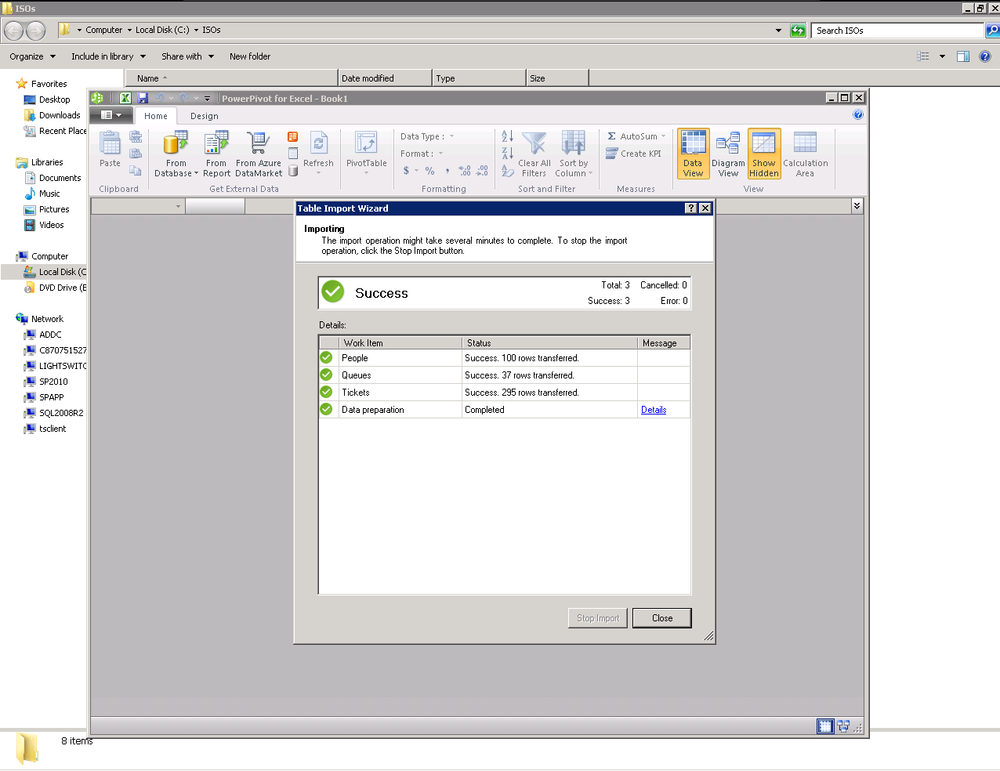
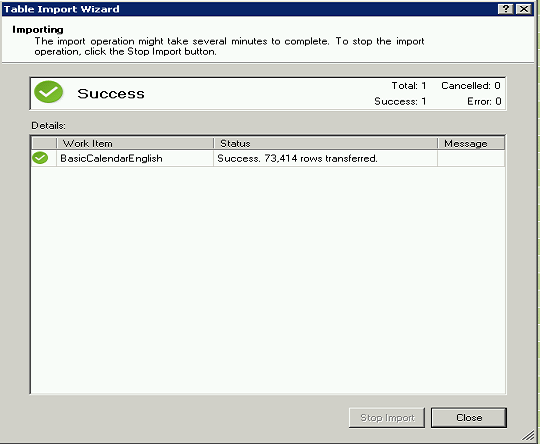
It’s that easy! Just click Finish and magic will happen. Behind the scenes of Figure 15-6 and Figure 15-7, which show the table importing, PowerPivot is running a query for each of the tables that we’ve selected.
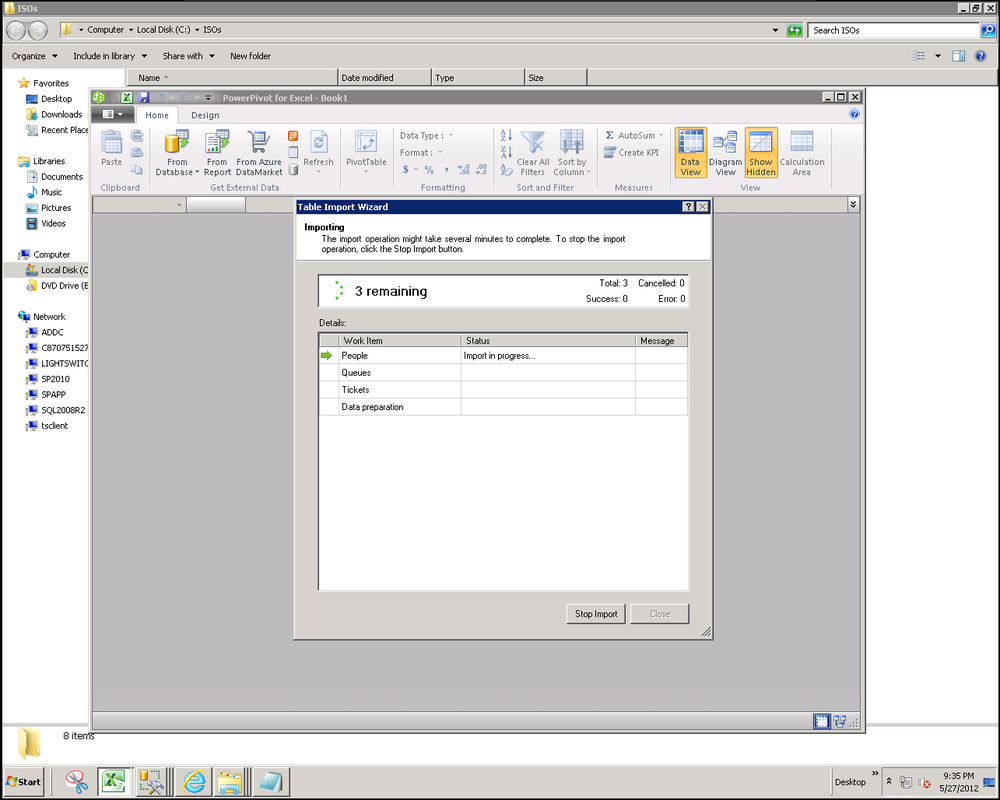
The data is pulled into the xVelocity in-memory analytics engine where the values of each column are stored, compressed in memory. The xVelocity engine uses in-memory column-oriented storage and innovative compression techniques to achieve these remarkable results. Once the processing is completed in just a few seconds or maybe minutes for larger data sets, all queries will happen against our in-memory representation of our model.
Connecting Excel to the PowerPivot Model
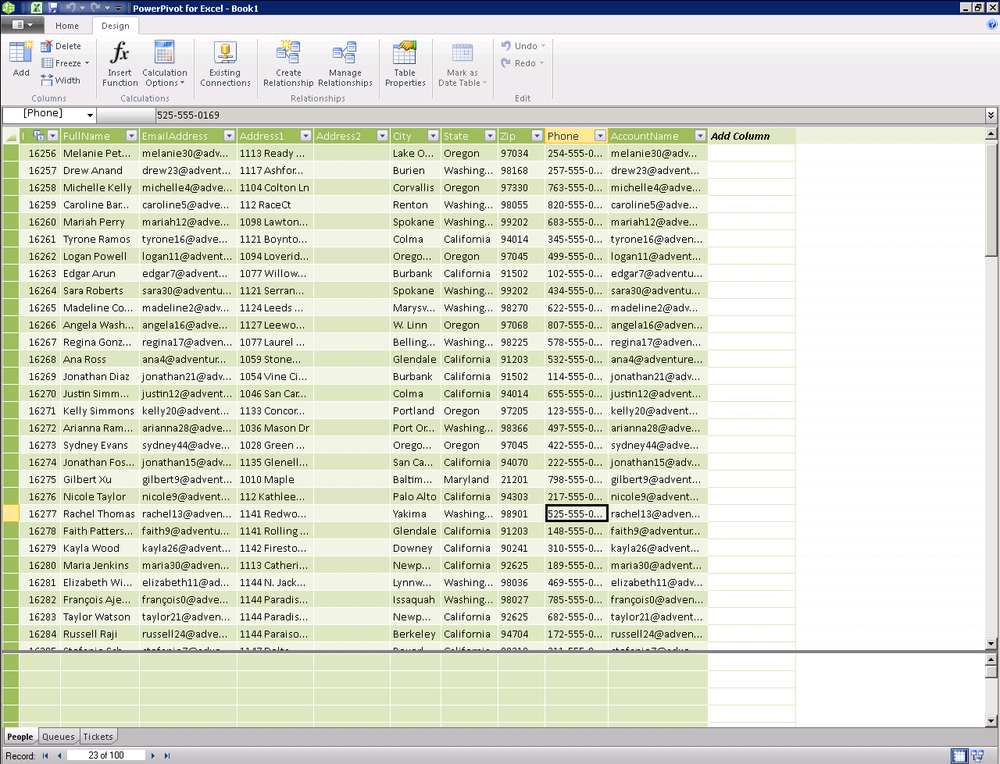
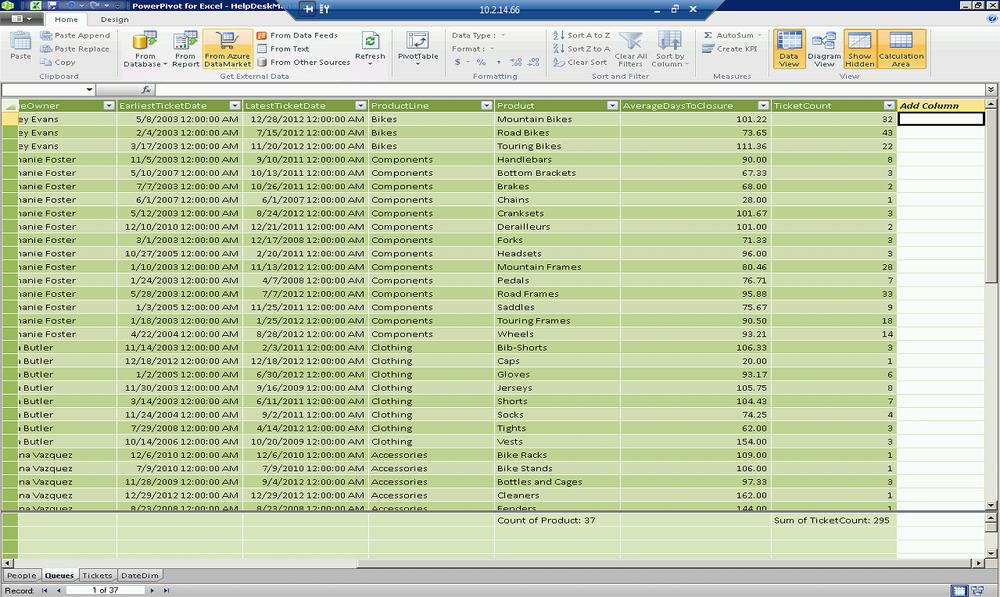
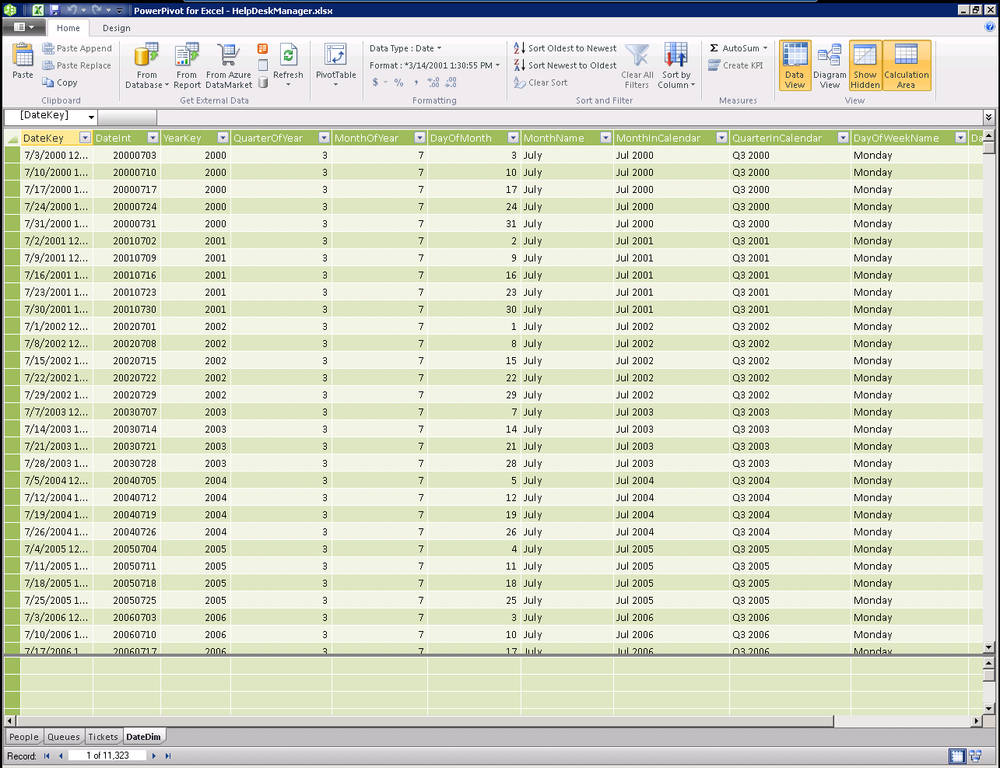
You’ve just built and processed your first cube with PowerPivot. Using the PowerPivot window as shown in Figure 15-8, you can browse through the data that you’ve imported. Regardless of the size of the data that you’ve imported, operations against this data-set are incredibly fast because they are acting on compressed data in memory. Often when Microsoft demos this, you’ll see a table with over a million rows and the presenter will sort a column by clicking the heading. Less then a second later a million rows of data have been sorted. Then they lift up the curtain and show you that the million row sort you just witnessed was done on a little netbook. You can also filter any column by clicking the down arrow in the column heading. This is great for previewing the data, and we may use this when writing some DAX expressions, but to do real work we’ll want to connect up more powerful clients. Let’s start with Excel PivotTables.
Moving data into Excel PivotTables is simple:
Highlight the Home tab on the ribbon.
Drop down the PivotTable menu.
Select PivotTable, as shown in Figure 15-9.
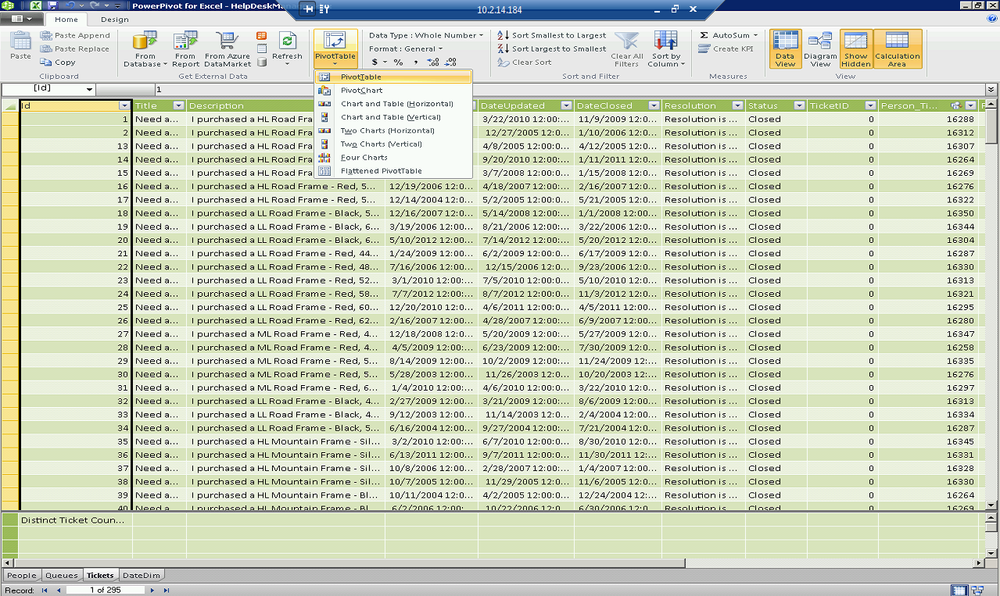
Once you click that, Excel 2010 is brought into the foreground and the Create PivotTable window is displayed as shown in Figure 15-10. You can place a PivotTable in a specific location on an existing table or you can create a new worksheet. We don’t have anything useful in our Excel workbook so we’ll just add a clean sheet.
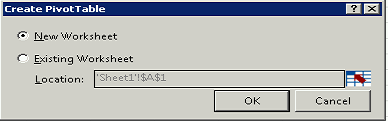
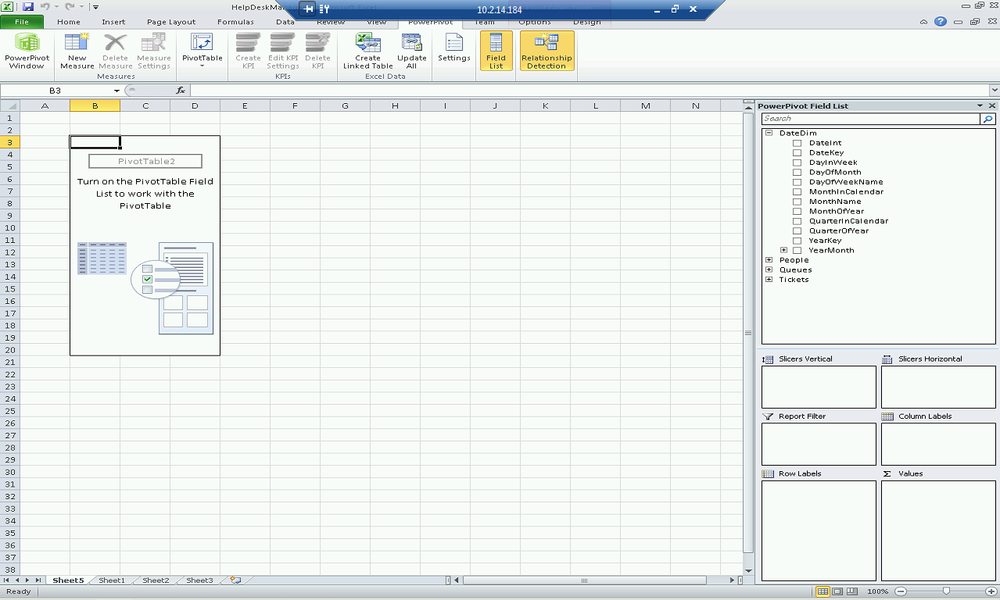
Figure 15-11 shows a new PivotTable displayed in Excel with the field list displaying our cube. Simply drag and drop dimensions and measures into the rows, columns, filters, and measures areas on the field list panel to consume the data from your cube. You can also check the box next to dimensions or measures and they will automatically be added as well. Shortly, we will be enhancing our cube with DAX. Each time we add some new functionality or feature you may want to come back here and add it to your PivotTable to try it out.
Importing Data from the Windows Azure Marketplace DataMarket
In the last section, we imported data from the database of our LightSwitch application. It was actually pretty trivial. In fact, you may notice that most things in this book are really pretty trivial to accomplish if you know how they work. One would think that securely importing a dataset from the cloud and relating it to our on-premises data application would be a difficult task to accomplish. Quite honestly, consuming data from Windows Azure is almost as simple as talking to our SQL Server.
Start by selecting From Azure DataMarket in the ribbon as shown in Figure 15-12.
This launches the Table Import Wizard. You can provide a friendly name if you like. The usability on this screen is not immediately obvious, but you’ll want to “View available Azure DataMarket datasets” rather than browse, which will launch the online catalog (Figure 15-13). Browse works for locally stored references that you may have saved.
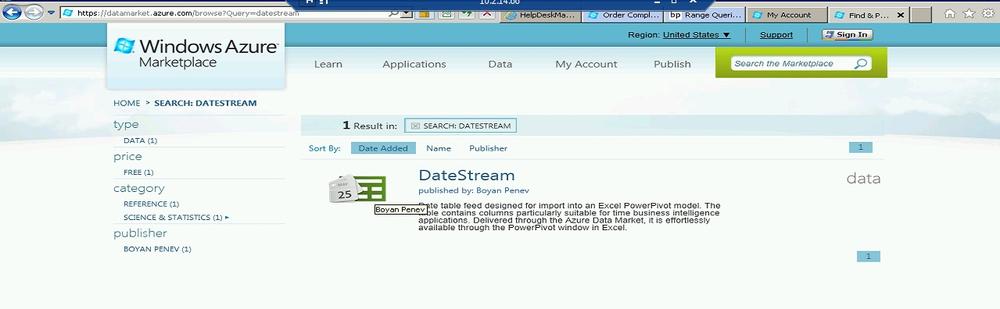
You can find free and paid subscription datasets that can be integrated into your solution in the Windows Azure Marketplace (Figure 15-14). For our business intelligence solution, we’re going to import a free date dimension that we can use to aggregate our help desk tickets over time. The dataset is branded as DateStream so you can just search for that whenever you need a date dimension.
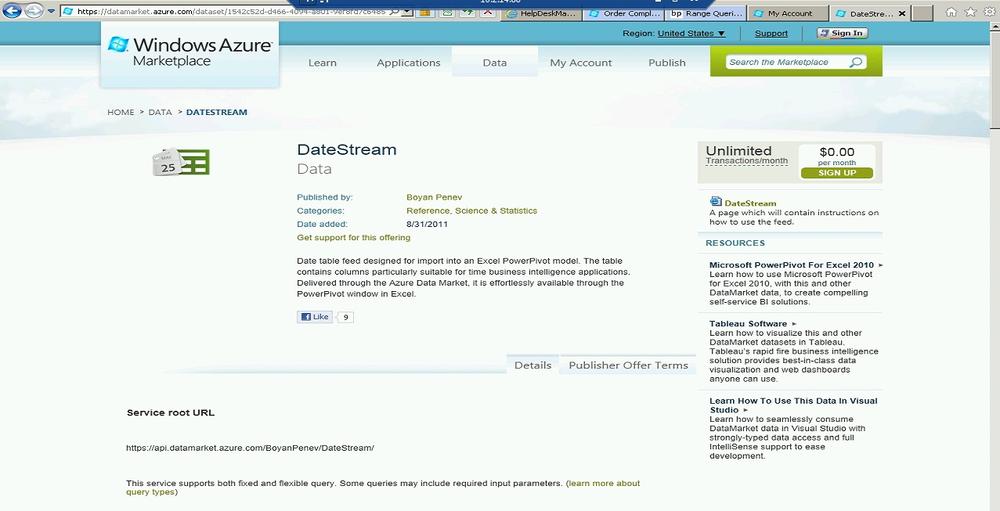
Each dataset in the Windows Azure Marketplace has a profile page that provides details on cost, publisher, description, and the service URL to be used to integrate the dataset into our PowerPivot model(Figure 15-15).
When you sign up for a feed, you will be asked to authenticate with your Windows Live ID or Microsoft Account. You can have one or more account keys associated with your Live ID or Microsoft Account and you’ll need that account key when you complete the Table Import Wizard.
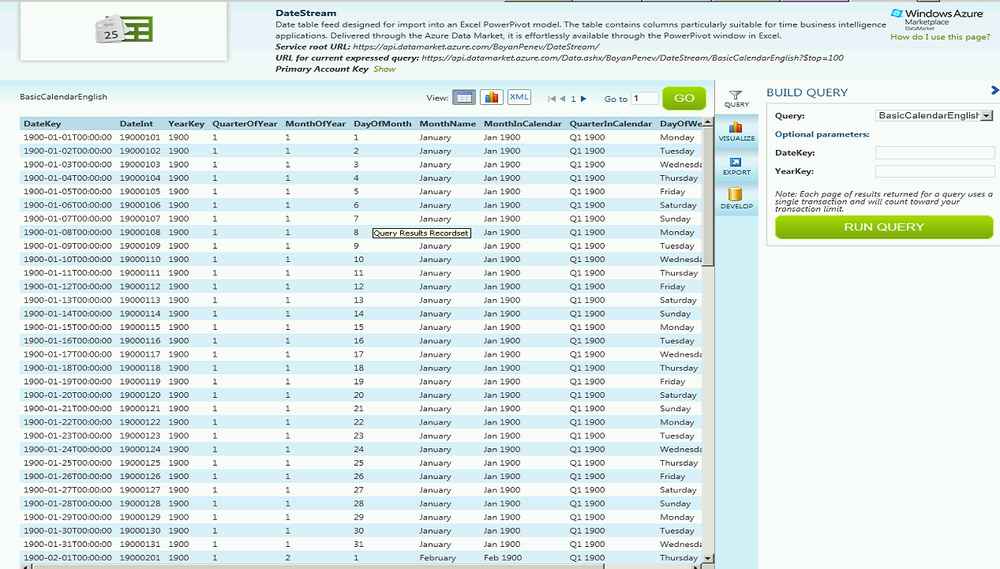
After you sign up for access to the dataset, you have the ability to explore the dataset and visually create filters that help you tailor the query to meet your needs (Figure 15-16). This is great for paid subscription services where you may be billed based on use.
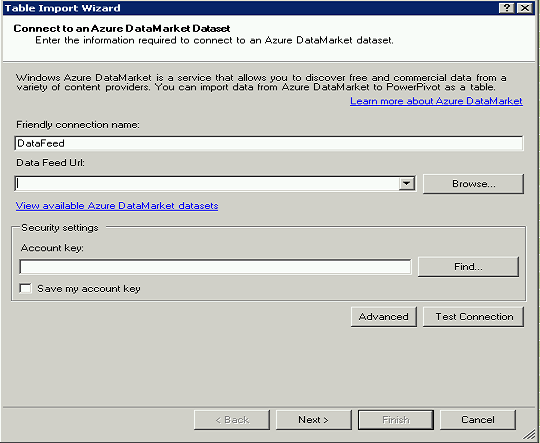
Next, back in PowerPivot, grab the Service URL and paste it into the Data Feed URL field. Also paste in your account key and choose to save it for future use when adding new datasets. Once you’ve completed the data feed URL and the account key, go ahead and Test Connection to validate your ability to connect and talk to the service.
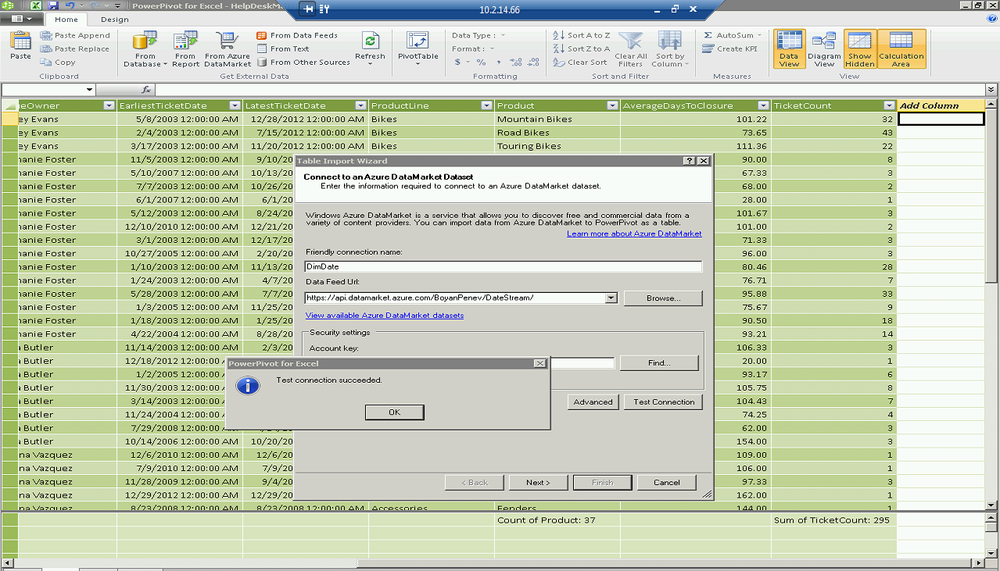
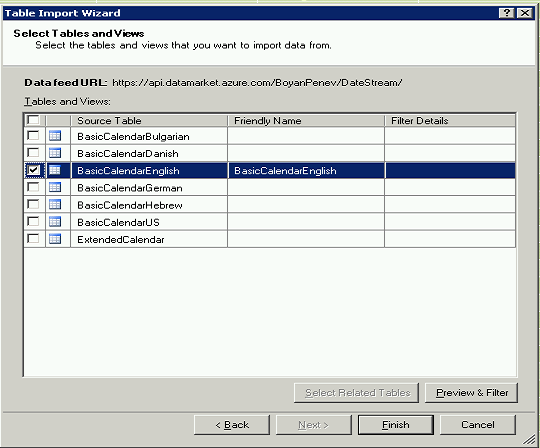
We are now back to the familiar user interface of PowerPivot’s Table Import Wizard where we can choose a table, preview the data, and click Finish to import the data (Figure 15-18, Figure 15-19, and Figure 15-20).
It’s that easy to import a cloud-based data source into our solution. In the next chapter, we will take this new date dimension and use it to relate to the other data in our tabular model (see Figure 15-21).
Summary
In this chapter, we used Microsoft SQL Server 2012 PowerPivot for Microsoft Excel 2010 to build a tabular cube based on our LightSwitch-generated database. We also sourced additional data from the Windows Azure Marketplace DataMarket that we will use to enrich our model. This will be the foundation for our PowerPivot model as we continue to build our BI solution over the next several chapters.