In our previous chapter, we covered how we can use a malware sandbox to dynamically analyze malware samples, log its behavior, and dissect it for maliciousness. We also spoke about how sandboxes automate the whole behavior analysis process. But one of the drawbacks of most behavior and API logging based sandboxes is that it is still susceptible to easy armoring techniques employed by malware, that can’t be circumvented unless we operate at the lowest possible level (i.e., machine instructions). This can be achieved using a technique or rather technology called binary instrumentation , that lets us analyze, operate, even modify a running sample program or a process at the instruction level.
In this chapter we explain what binary instrumentation means and its various internal concepts that lets it monitor programs at a machine instruction level. We also run through various code exercises that should get us started writing simple instrumentation tools to help us analyze malware samples and even automate reverse engineering them.
What Is Binary Instrumentation?

Categorization of different types of program analysis and where DBI lies in it
Now let’s pick a running process that you want to instrument. If you think about it, you can instrument this process passively using another process through various OS facilities, sampling events related to the process, sampling the interactions of the process with OS system calls, and so forth. But passive instrumentation does have some drawbacks, including granularity and detail of data one can unearth from the monitored process, and the ability to monitor it at the granularity of machine code instructions and so on. To deal with drawbacks and to have the ability to obtain very granular and detailed data about the program/process that we want to monitor, we can employ an active instrumentation technique, that involves modifying the code in a program or a process, to provide a microscopic view of the execution of the process.
Now we mentioned that an active method of instrumentation involves the modification of code of a program or a process. If the source code of a program is available, then you can modify the source code to add any instrumentation code, in which case it is called source instrumentation . But most of the time, when we deal with programs, including malware, we don’t have its source code. Instrumenting binary programs can be done by modifying its machine code, and that’s binary instrumentation.

Static binary instrumentation adds instrumentation code into the program to the file on disk before running it as a process
As seen in the figure, with static binary instrumentation, the program file on disk to be monitored is modified by the help of various instrumentation frameworks/libraries to generate a new program file, that includes the original program code, plus the instrumentation code. This newly generated program is then run as a process, which ends up executing both the original program code and the instrumentation code.

Dynamic binary instrumentation runs a program as a process and then adds instrumentation code into the running process dynamically
Now that you understand what DBI means, in the next set of sections let’s look at the various concepts and terminologies that make up DBI and look at how it works internally.
DBI: Terminologies and Internals
DBI involves adding instrumentation code into a running process. To put all of this into action and make it possible, there are various DBI frameworks available, some of the notable ones being PIN, Dynamo RIO, Frida, and Valgrind. These DBI frameworks are the ones using which we can modify the code in a running process by adding our own instrumentation code, using which we can monitor the running process.

DBI breaks a process’s instructions into two constructs—basic blocks and traces

Various conditions that govern how a DBI framework breaks up instructions in a process into basic blocks and traces

Example of how a DBI framework splits instructions into basic blocks and traces
Inserting Instrumentation Code

DBI frameworks inserting user instrumentation code among the basic blocks and traces to monitor them
Most DBI frameworks allow the insertion of user instrumentation code via their callback APIs, which then invokes these callbacks at various events and stages of execution of the instrumented process. We can write analysis programs with the help of these DBI frameworks/libraries, where we can register our user instrumentation callback functions with the DBI frameworks’ APIs, instructing it to invoke our callback functions at various stages of the process execution.
For example, we can register a callback function with the DBI framework requesting it to invoke the callback before a basic block or a trace executes. Similarly, we can register a callback function requesting the DBI framework to invoke the callback after a trace executes. Most DBI frameworks even allow us to register callbacks to our instrumentation code at a per instruction level and subroutine level.
In the next set of sections, we explore the various use-cases where DBI can be useful for malware analysis. We also try out various hands-on sample code exercises that help us learn how to use DBI frameworks like Intel PIN and even extend them to analyze and automate malware analysis.
DBI for Malware Analysis
Profiling code for performance
Error diagnosis
Code flow analysis
Taint analysis
Memory allocating and leak tracking
Vulnerability detection
Debugging
Malware reverse engineering
Patching vulnerabilities
Exploit development
Error diagnosis
It’s use-case extends beyond the list. It is also a great for malware analysis and automating reverse engineering for malware samples. There are various tools developed using DBI to help with analyzing malware samples; one tool that we developed is called Trishool. It is available at https://github.com/Juniper/trishool. You can explore it once you through with the exercises in this chapter.
Win32 API logging
Unpacking
Defeating armoring using code and process state modification
Memory signatures scanning
Path fuzzing
Application memory allocating tracking
Malicious code segments backtracking
Code blocks flow graph similar to IDA Pro graph view
In the next set of sections, we explore writing simple tools using DBI that should get us started in the direction of using it for automating reverse engineering malware samples.
Cons
We spoke about how DBI is great for automating malware analysis and reverse engineering. But it has its drawbacks, that doesn’t let it be used as a straightforward replacement to API logging tools in our detection products’ malware sandbox VMs.
Most malware sandboxes are run in emulation mode, which can be slow, even for API logging tools like APIMiner, which means we can’t or rather don’t want to do CPU intensive tasks inside the Sandbox. Instead, it is preferable to transfer the obtained analysis logs and data from inside the Sandbox to the Host outside and carry out CPU intensive log dissection and other tasks on the host.
Now DBI is also extremely CPU intensive especially compared to API logging tools like APIMiner. As a result it may not be practical to use DBI for analyzing every single sample. Instead while implementing the malware sandbox VMs in our detection products, we still want to use less CPU intensive tools like API loggers like APIMiner that use less CPU intensive hook-based techniques, to obtain the first set of API logs and other analysis data for the samples. Only if the obtained analysis logs are inadequate should we then resort to other complex analysis tools and techniques like DBI to reanalyze the sample. This way we can limit using DBI to cases where regular analysis tools fail, thereby saving valuable CPU time.
Tool Writing Using DBI
Let’s now explore writing simple analysis tools using DBI for various use-cases we mentioned, and for other use-cases as well. For our purposes, we use the Intel PIN binary instrumentation framework. Do note that the same is achievable as well using DynamoRio, Frida, and other frameworks as well. We leave it as exercises to try out all these sample exercises using these other DBI frameworks.
Setting up PIN
We already have our Cygwin and Microsoft Visual Studio setup in Chapter 21. Let’s now set up the exercises and Intel PIN framework needed by our exercises. First let’s download Intel PIN Framework from the Intel site. For the exercises in this book we have used Intel PIN 3.6, but you can use the latest version of PIN available, with some minor tweaks to the exercises (i.e., if needed).

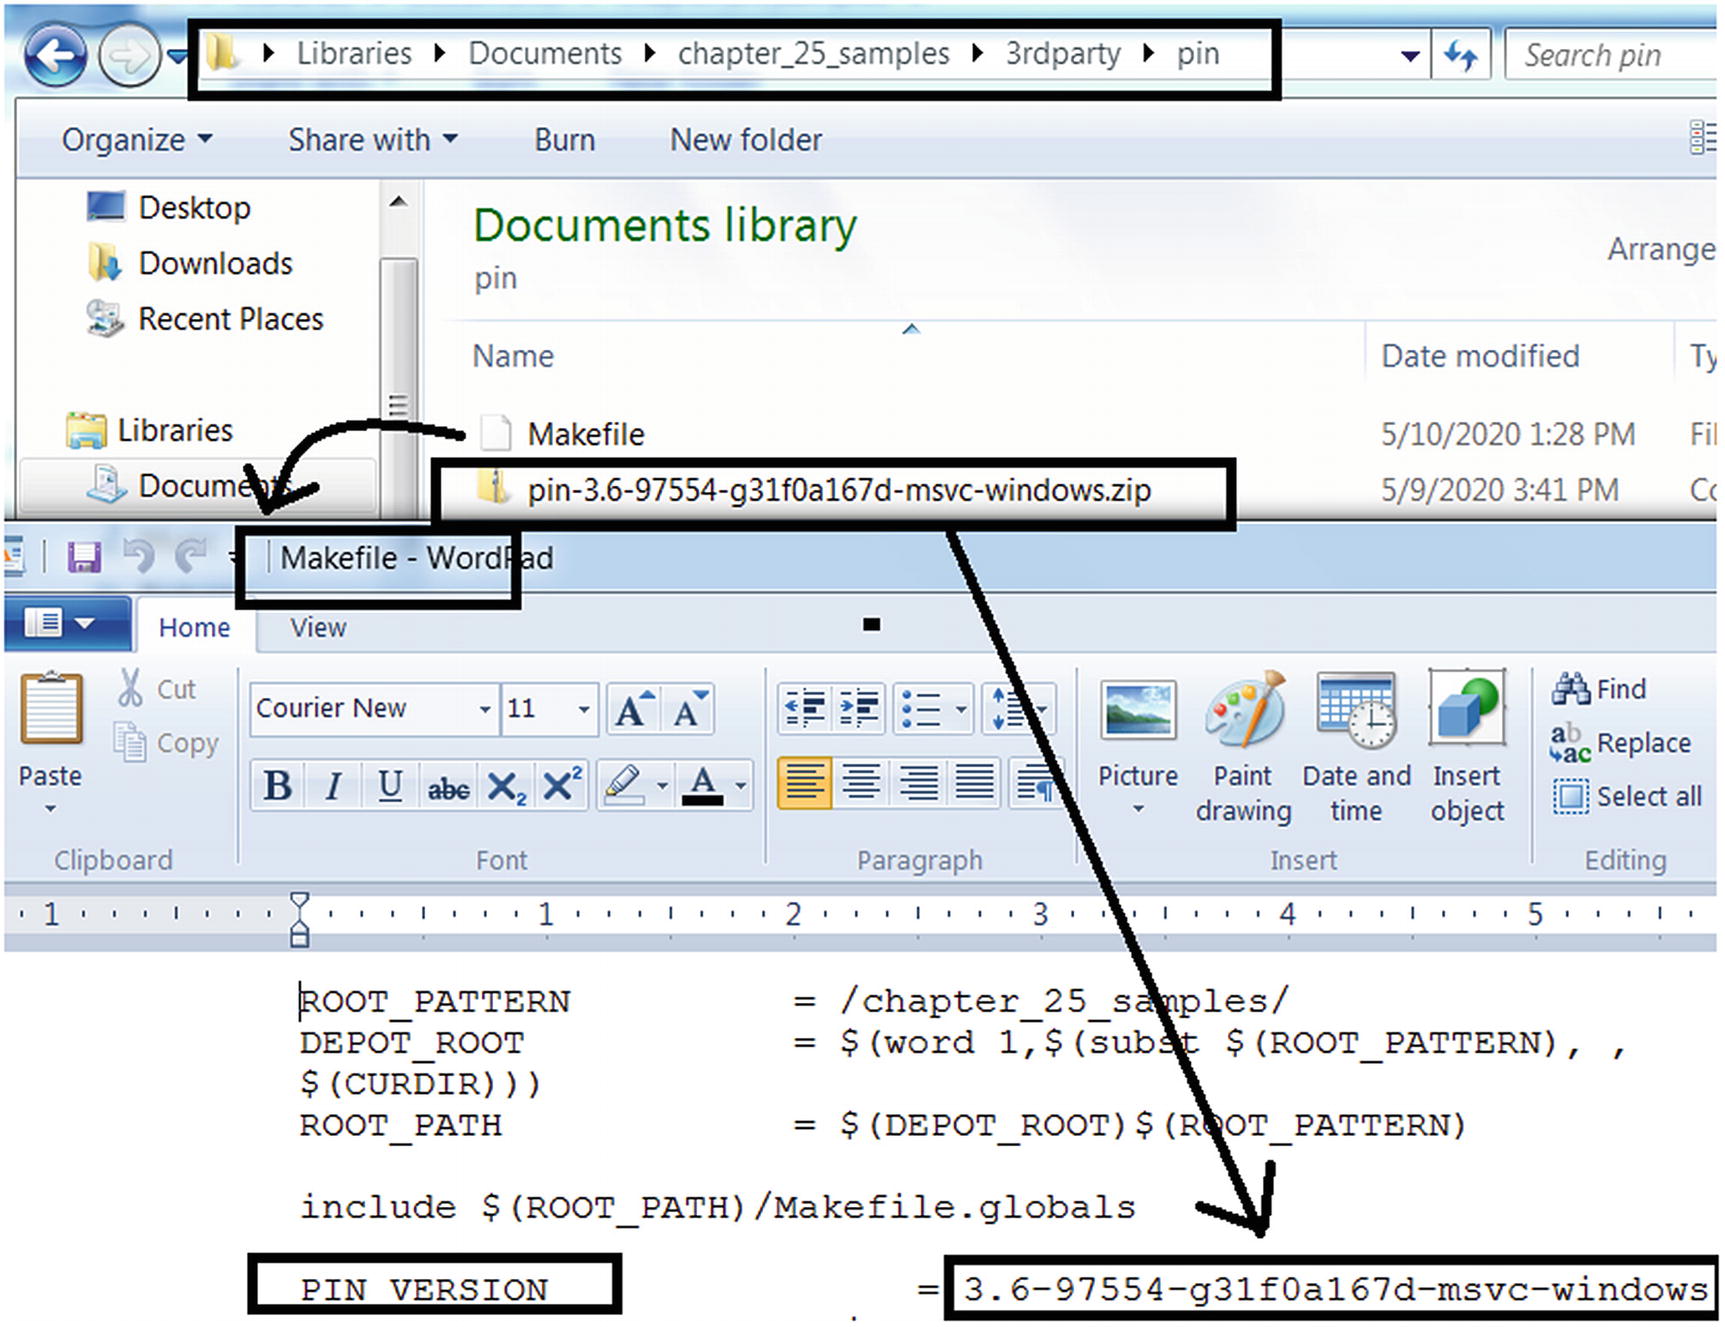
Contents of chapter_25_samples in the Documents folder after unzipping it
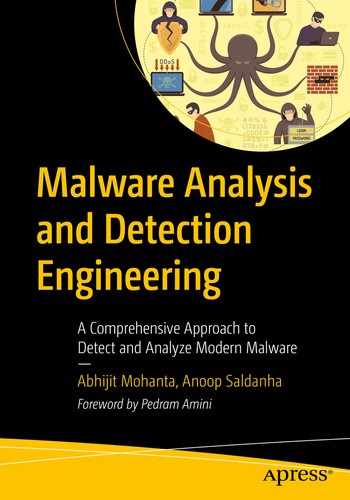
Updating PIN_VERSION variable in the Makefile to hold the version of PIN used
Now we have three PIN sample exercise tools that we have provided, Sample-25-03-pin.c, Sample-25-04-pin.c, and Sample-25-05-pin.c, located under chapter_25_samples/src/samples folder, using which we are going to instrument two application samples Sample-25-01 and Sample-25-02, both of which are available in our samples repo.

Command to build our Intel PIN tool Sample-25-03-pin.c
Output folder created by our build make command, where the output files are put

The tool built from the command in Figure 25-10 is located in the folder
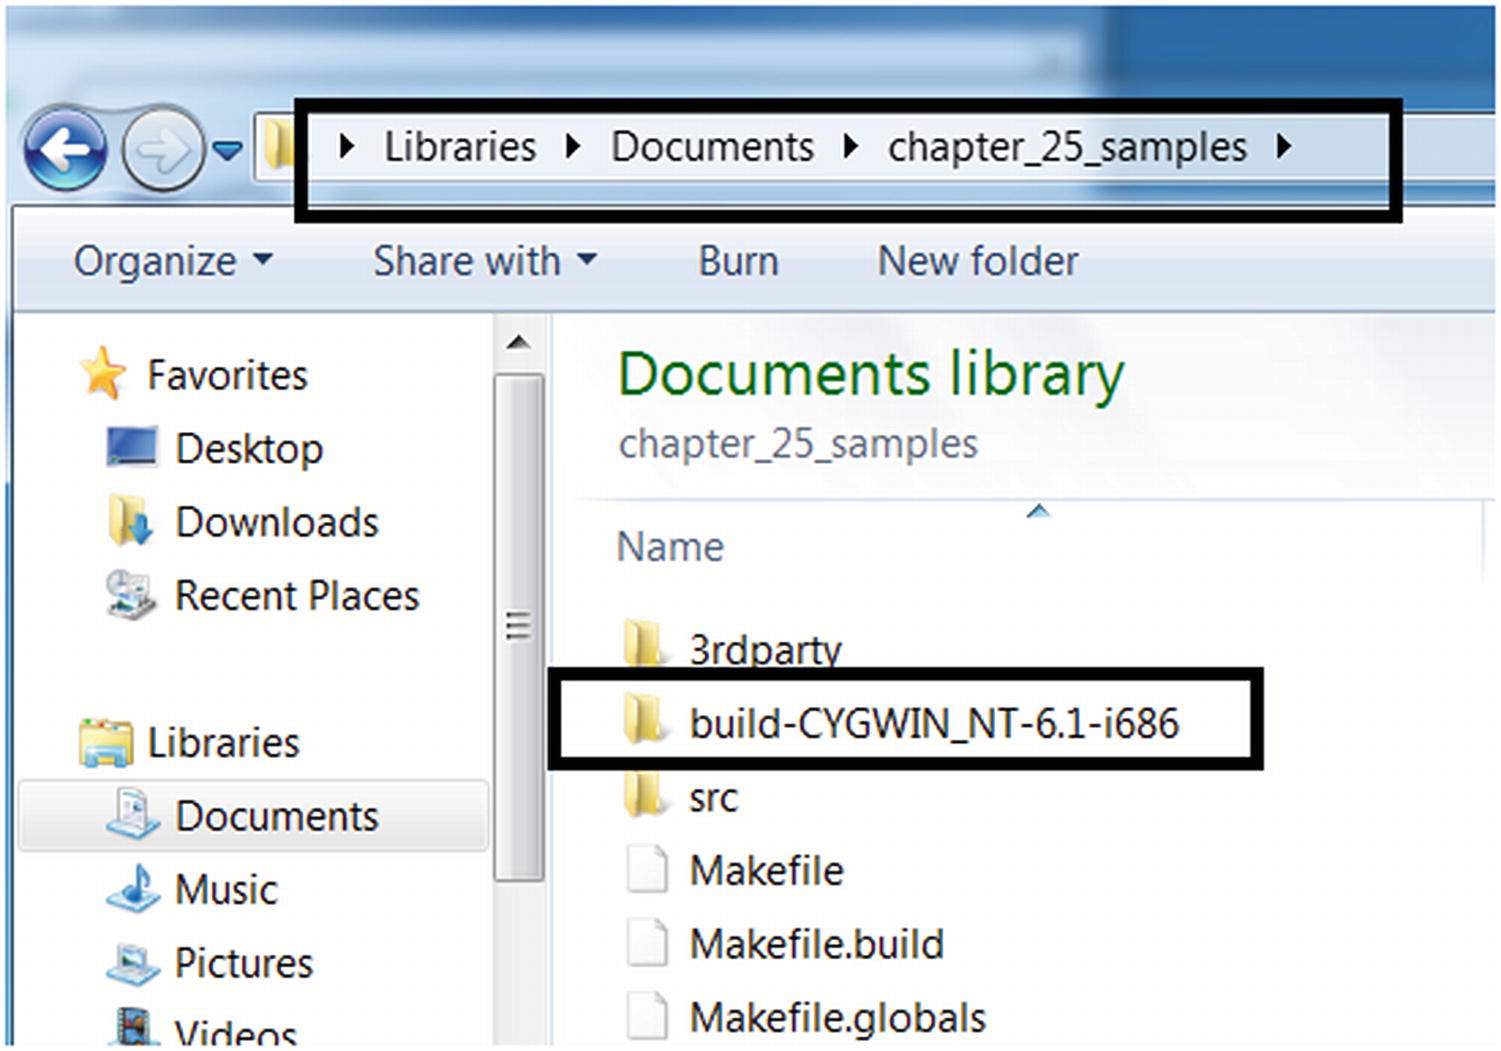
Copy the tool we built Sample-pin-dll.dll and our samples into the pin folder
And that’s pretty much it. Next when we want to build our other two PIN tools Sample-25-04-pin.c and Sample-25-04-pin.c, just delete the chapter_25_samples/build-* folder and rerun the build steps.
Tool 1: Logging All Instructions
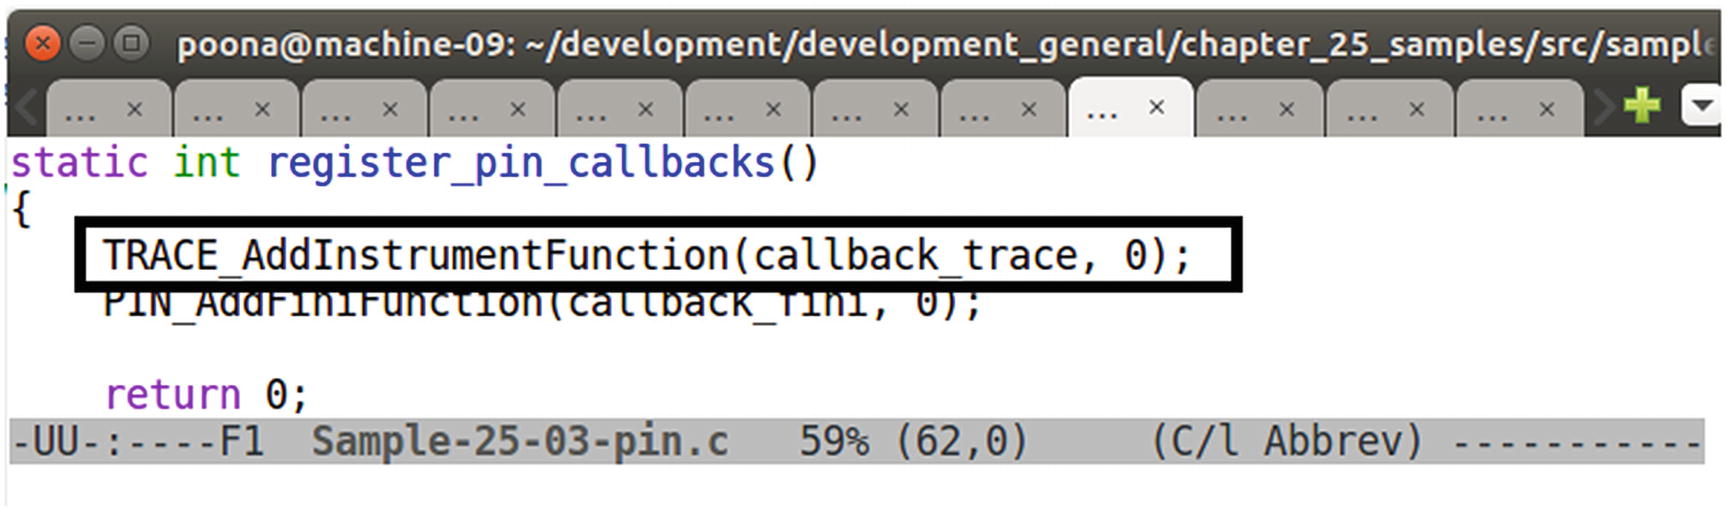
PIN API invoked by Sample-25-03-pin.c to register a callback function to receive all TRACES from PIN

The callback function of our tool when invoked by PIN, then loop through the instructions in the TRACES and log them

Instruction disassembled using PIN API INS_Disassemble to be logged
To build this tool, delete the build-* folder in the chapter_25_samples folder and rerun the command in Figure 25-10, which should build and output this tool executable to Sample-pin-dll.dll, which you can then copy into the build-CYGWIN_NT-6.1-i686/3rdparty/pin/ folder as seen in Figure 25-12 and Figure 25-13 from our previous section. Also, copy Sample-25-01 and Sample-25-02 from our samples repo into the same folder, as seen in Figure 25-13, and make sure you add the .exe extension to these samples.

Instrumenting our application Sample-25-01.exe using our PIN Tool that we built
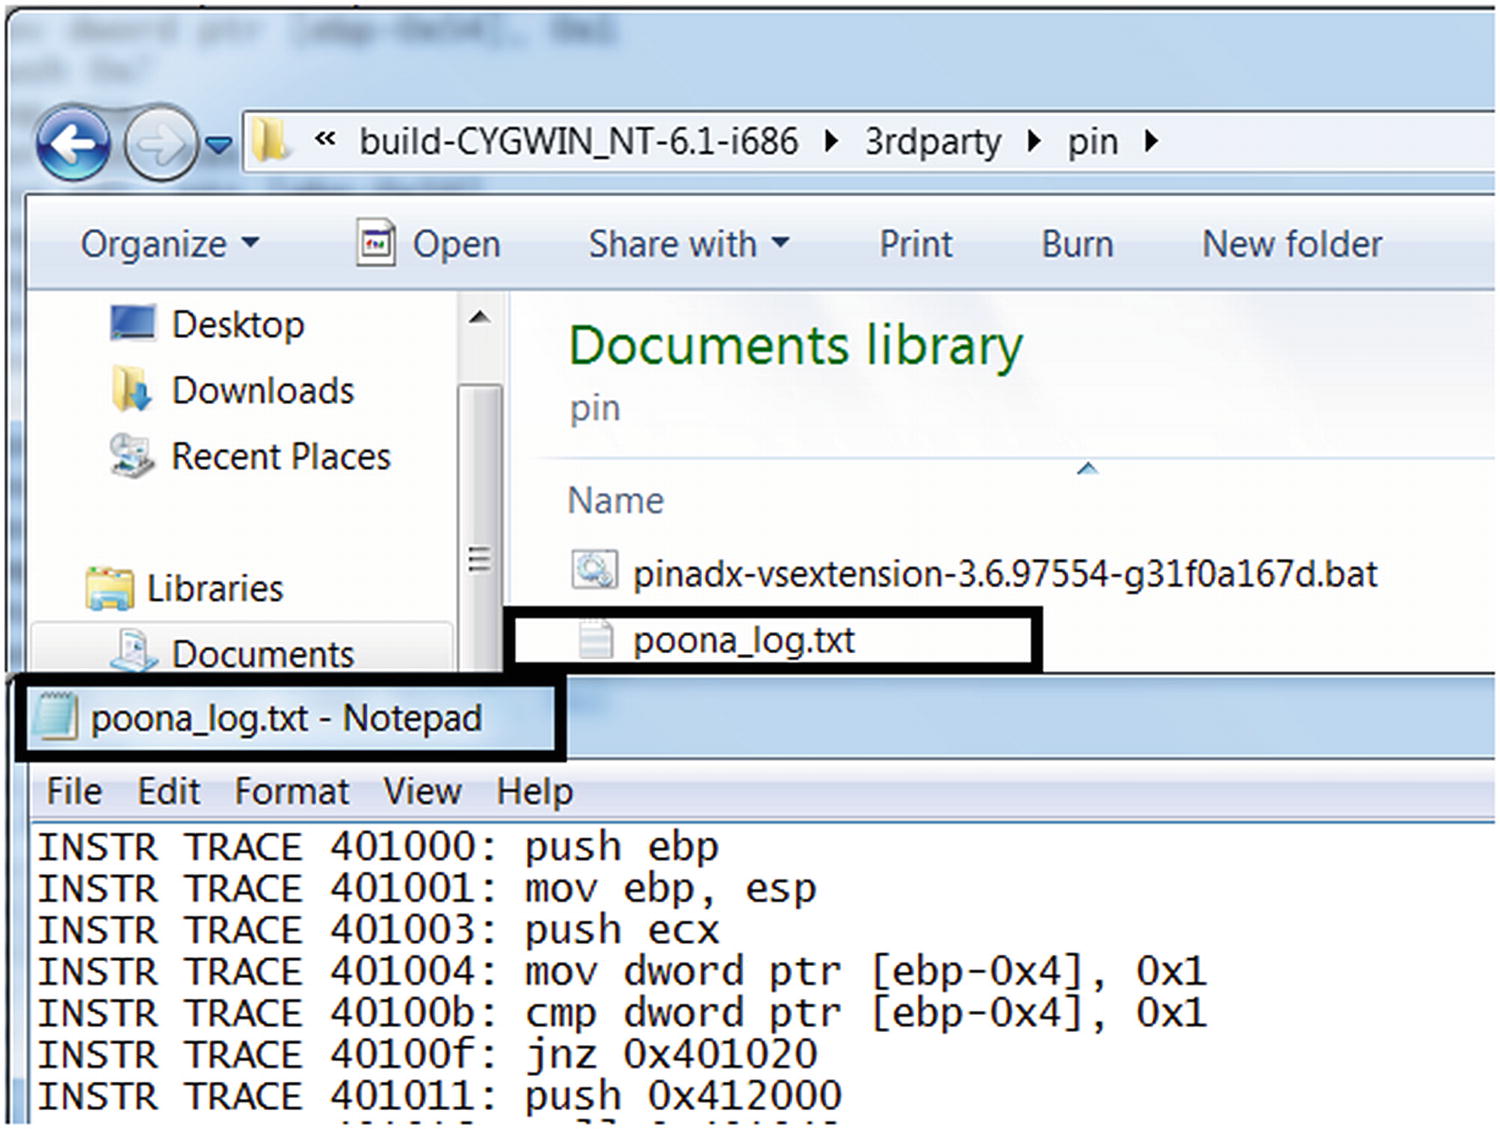
The instructions from Sample-25-01.exe logged by our tool Sample-25-03-pin.c
Tool 2: Win32 API Logging
In this book you learned how to use tools like APIMiner and Cuckoo Sandbox to log the Win32 API logs used by malware samples. We can do the same using a DBI framework as well, and this is what our second PIN tool sample tool located at chapter_25_samples/src/samples/Sample-25-04-pin.c does.
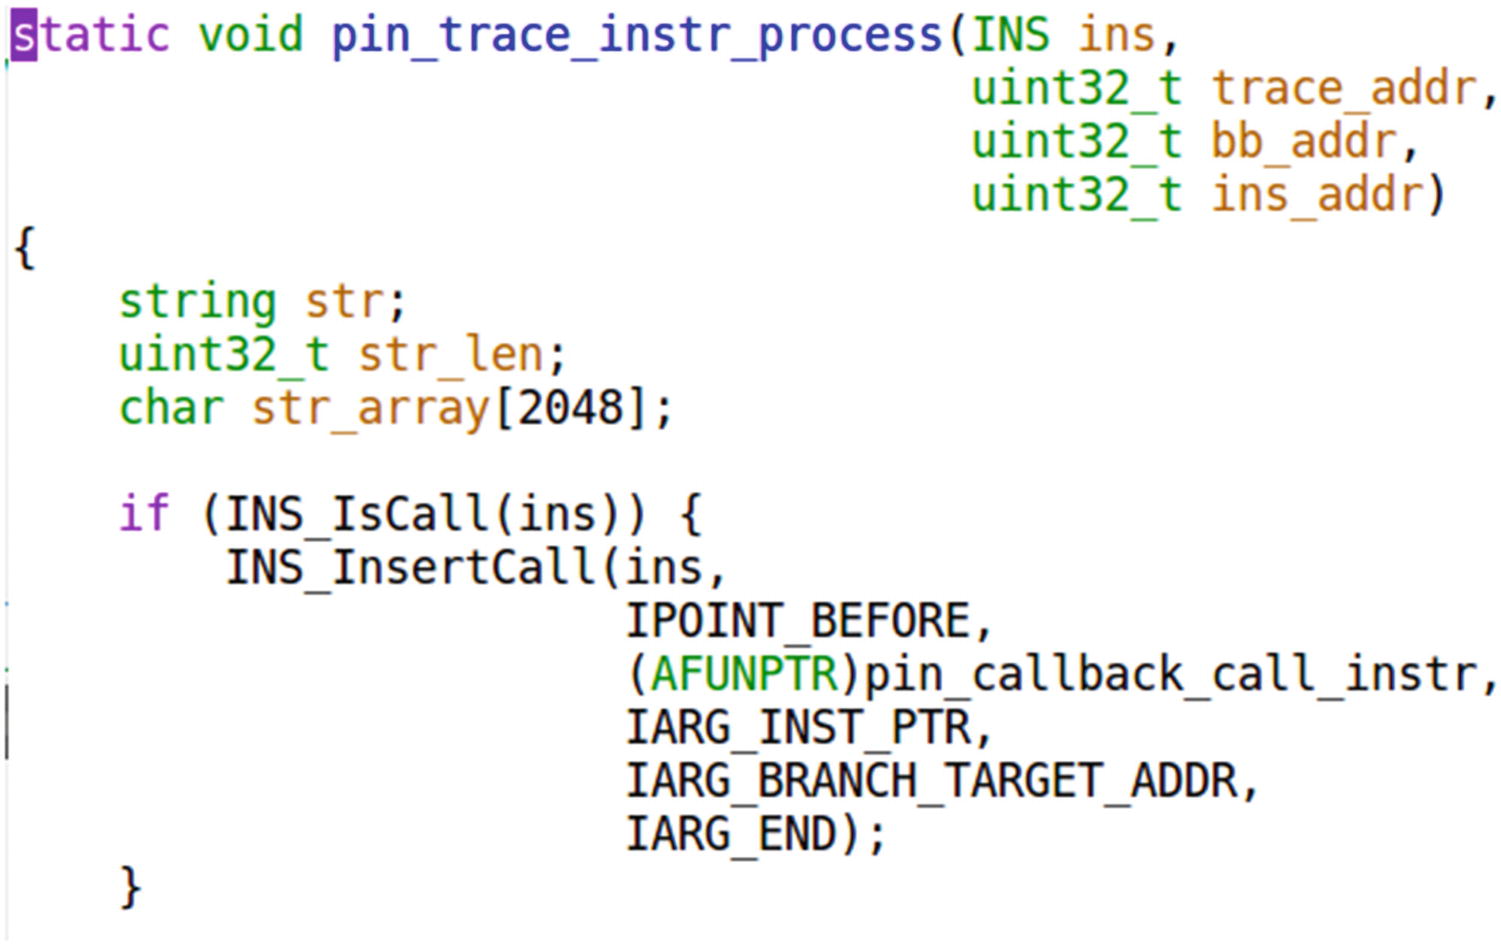
Sample-25-04-pin.c registers its own instrumentation code with the PIN tool to be invoked against this particular CALL instruction
The goal of this tool is to log APIs used by applications like APIMiner, and we know that API calls are nothing but function calls, which in machine code or assembly is the CALL instruction. Rightly so, as seen, our function which is invoked against every instruction, check if the instruction is CALL instruction using INS_isCall() pin API and if so register a new callback function pin_callback_call_instr with the PIN framework against this very specific instruction, basically asking PIN to invoke this callback function before this instruction is executed. When we say this instruction, we don’t mean any CALL instruction, but rather this specific CALL instruction located at this address in the application. Basically we end up registering this callback function for every CALL instruction in the application we are instrumenting.
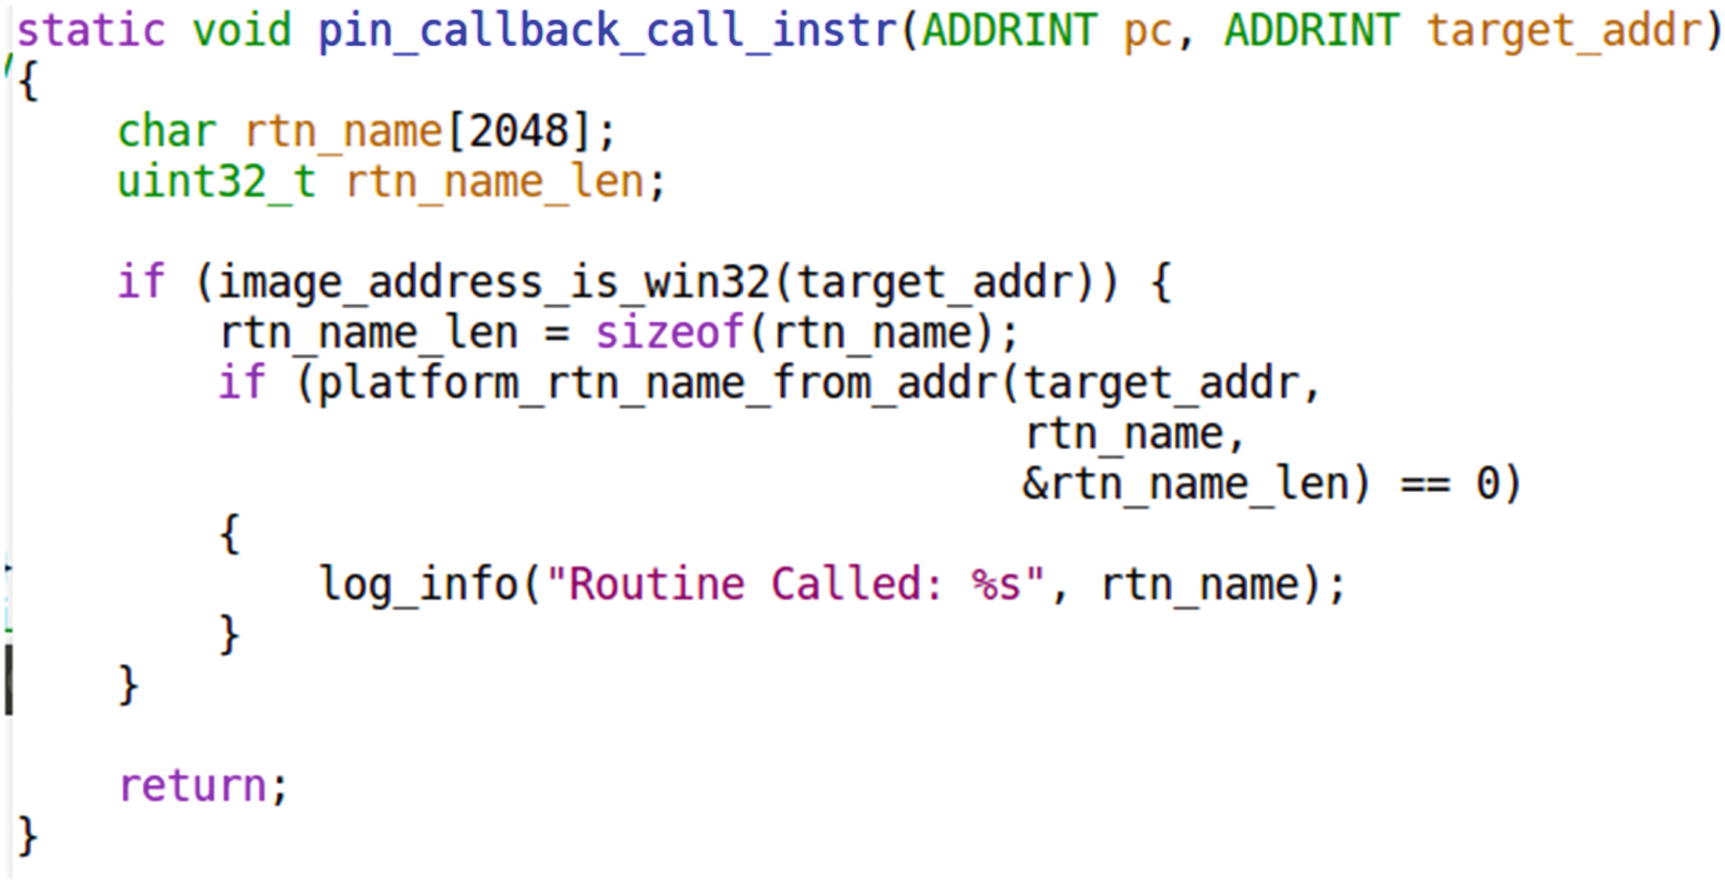
The callback function registered against CALL instruction obtains the name of the Win32 API invoked by our application by taking the help of PIN API RTN_FindNameByAddress(), which is invoked by platform_rtn_name_from_addr()
To build the Sample-25-04-pin.c tool, delete the folder build-* in the chapter_25_samples folder, and then rerun the steps to run the make command in Figure 25-10, but make sure you change the name of the file in the make command to Sample-25-04-pin.c. This should build the tool Sample-pin-dll.dll, which you can then copy into the build-CYGWIN_NT-6.1-i686/3rdparty/pin/ folder as we did in Figure 25-12 and Figure 25-13 from our previous section. Also, copy Sample-25-01 and Sample-25-02 from our samples repo into the same folder, as seen in Figure 25-13, and make sure you add the .exe extension to these samples.
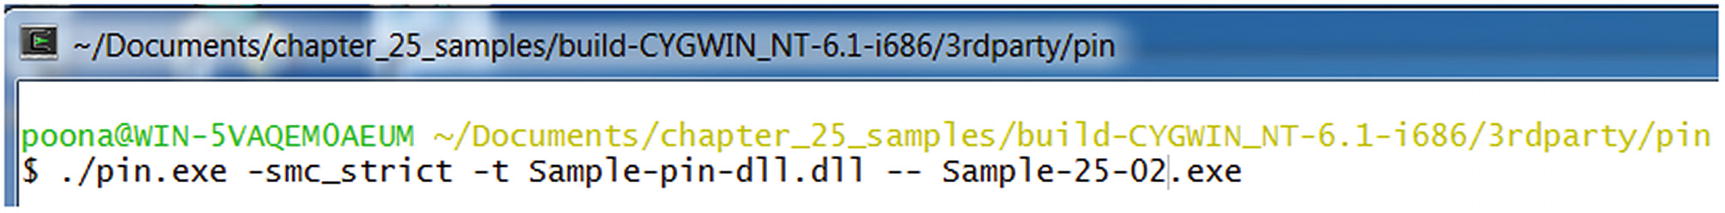
Instrumenting our application Sample-25-02.exe using the PIN tool that we built

Our tool Sample-25-04-pin.c logs the APIs used by our app Sample-25-02.exe
Go through the code and make a note of all the PIN APIs that our tool implements its functionality. Go through the PIN API Reference document, understand the meaning of the APIs, and even tweak and play with new APIs. See if you can update this exercise tool, to also log the arguments to these APIs and bring its output as close as possible to APIMiner.
Tool 3: Code Modification and Branch Bypass
Fuzzing all the code flow paths of the malware, which is otherwise not possible while you analyze with a hook-based API logger tool like APIMiner, since it execute most often a fixed code flow path.
Bypassing armoring.

Our app Sample-25-01.c is coded to always take the if branch
Can we modify the state of this program live using DBI to manipulate it into taking the else branch? Yes, we can, and this is what our tool chapter_25_samples/src/samples/Sample-25-05-pin.c does.

The JNE instruction in Sample-25-01.exe decides which branch to take

Our Sample-25-05-pin.c PIN tool modifies the EFLAGS register value to manipulate the branch code flow in Sample-25-01.exe
With our tool right at the JNE instruction at address 0x40100F in Figure 25-24, we register a callback function modify_flag_for_branch that we request PIN to invoke right before executing this instruction. If you trace/search for the implementation of this function modify_flag_for_branch in Sample-25-05-pin.c you notice that it modifies the value of the flags register to alter the code flow of the process.

Running Sample-25-01.exe using our PIN tool Sample-25-05-pin.c shows that it has successfully manipulated it into altering its code flow, forcing it to take the ELSE branch
There are various other and more complex tools that we can implement using DBI, case in point is a tool that we implemented. Trishool (https://github.com/Juniper/trishool) that can do a lot of other things, including point you to the location in the code that malware sample unpacks, scan the memory for strings, and so forth. Going through how Trishool implements these various features is a great exercise on learning how to automate reverse engineering.
Also go through the PIN API Reference available on Intel’s site. Learn the various APIs and what it means. Also go through various GitHub projects that use DBI for automating program analysis. Don’t confine yourself to PIN. There are other frameworks like DynamoRIO, a personal favorite of ours and Frida as well, all of which come with different features from Intel PIN. Getting to develop with DBI is all about more practice using the APIs and writing more proof of concepts. Practice and you should soon be automating various other tasks in malware reverse engineering.
Summary
Dynamic binary instrumentation (DBI) is a great technology that is leveraged across various domains to automate instrumentation and analysis of samples, clean and malware alike. In this chapter, you learned what instrumentation means and the various subtechnologies under it, including DBI. You learned how DBI works, understanding its internal concepts and the various terminologies common to most DBI frameworks including traces and basic blocks. Building on the lab set up in Chapter 21, we update our lab setup to include the PIN tool and exercises which we use to compile various instrumentation exercise tools that we built. We explore writing simple PIN tools, including a PIN tool that logs APIs like APIMiner and another tool that allows us to modify the live state of a process with the aim to alter its execution code flow path.