In the previous chapter, you learned about static analysis, which lets us analyze a sample without executing it. In this chapter, you learn the other side of the analysis coin: dynamic analysis. It involves executing a sample using the aid of various tools and recording not only the behavior but also observing the various artifacts generated by the executed malware. Combined, it can help us analyze and make conclusions about the sample more accurately.
Although dynamic analysis and static analysis sound like two different phases in the analysis process, they are not. As you run through the various dynamic analysis steps and tools, you might have to go back and run through the various static analysis steps that you learned, and then come back to dynamic analysis again. This cycle might continue several more times.
In the chapters in Part 3, we cover various dynamic analysis techniques along with hands-on exercises. In this chapter, we rehash many of the techniques that we introduced earlier in the book. As you read this chapter, we suggest you go back and forth between this chapter and the previous chapters and their various hands-on exercises and content so that you can solidify everything you learned earlier. Practice makes perfect.
Keep Your Base Snapshot Handy
During the execution of the sample, the sample might make some changes to the system, dropping some hints for itself in case it is re-run later. If you re-run the same sample later again in the same environment without resetting your VM, the malware might start up, check for the existence of hints that indicate that it has already run in that environment, and if so, behave differently or exit. Some hints/artifacts from malware are registry entries, config files, or dummy files on the disk, mutexes, and so forth
Sometimes malware you analyzed earlier in the analysis VM might still be running even though you think you killed it. When you re-run the sample, it might clash with the existing process, or it might check for the hints/artifacts it left inside the analysis VM, so it now behaves differently or exits. As a result, you may not get the malware’s true behavior and events.
If you reuse a VM environment that you used to analyze a different sample, then there might be artifacts and events from that earlier malware that you might mix up and confuse as those generated and belonging to any new malware you analyze. Resting the VM ensures that you have a clean environment to analyze a new sample, with no stray events and artifacts from any older analyzed sample that you could get confused with.
First Run: A Bird’s-Eye View
A lot of samples, like ransomware, have very public or explicit behavior. Running the sample and observing the effects that the malware had on the system, and the files on disk might be enough to conclude that the sample is malware and figure out the type and intent of the malware.
Casually observing the behavior of the malware under execution, helps us set a tone, and our expectations, and prepare ourselves for the next set of tools needed to continue with its analysis in depth.
We might have to repeat this process and casually re-run the same sample multiple times, since a single execution may not help us observe enough about its behavior. Every time we casually re-run the sample, it is highly recommended that we reset the VM to the pristine base snapshot. While we carry out this process, we also want to take the aid of a few simple tools like Process Hacker and the file browser, that help us observe the sample’s behavior passively.
Whoa! The Sample Refuses to Run!
Sometimes the samples might need a certain environment or a certain SDK/framework installed, which might be missing in your analysis VM. For example, the sample you are analyzing might be a .NET sample that requires a particular version of the .NET Framework, which may not be installed on your system.
Or the sample might be Java malware that requires the Java Runtime Engine (JRE), which is not installed on the system.
The malware might have certain dependencies on DLLs and config files that it needs to run, which might be missing from your analysis VM.
A lot of these dependencies, frameworks, environments needed by a sample to run can be figured out from the static analysis phase. Once we figure out these missing dependencies and install and set them up, the sample runs as expected.
Keep in mind is that when PE Executable samples fail to run, the easiest way to figure out the issue is to run the sample using a debugger like OllyDbg. Using a debugger helps you figure out the issue very quickly and efficiently, saving your precious time. You don’t have to be a super reverse engineer to use OllyDbg or any other debugger. You learn more about using OllyDbg and the reverse engineering process in Part 4 of this book.
Run as Administrator or Not
By default, if you double-click any sample on the system, it runs as a non-administrator, with fewer privileges, functionalities, features available for the running process. Some malware requires administrator privileges to perform certain operations that require special privileges. For example, if malware wants to copy a file into the protected OS system folder C:WindowsSystem32, it needs administrator privileges.
While running any malware sample, you want to test it by running both with and without administrator privileges. Start by running it without administrator privileges, which is easy to do, since all you need to do is double click.
Reset your VM and run the sample as an administrator, which you can by right-clicking the sample and selecting Run as an Administrator.
Each of the scenarios might provide different sets of events and behaviors for the running malware process, which you may not see with the other, and the difference might be crucial in your figuring out if the sample is malicious or not.
Now let’s play with some hands-on exercises that involve real malware samples and see how having a casual eye on the execution of the sample is all that we need most of the time to conclude enough about a sample.
Case Study 1
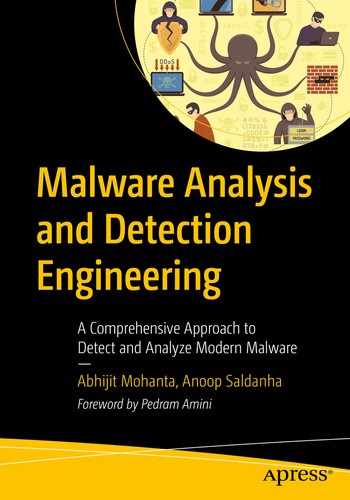
The state of the system before and after running Sample-13-1
Now that you have that in place, run the sample. A new process called svchost.exe opens, as you can see on the right side of Figure 13-1. This is suspicious, and from what we have covered so far in this book, it points to malware-related behavior, where malware uses system programs like svchost.exe for stealth (see Chapter 11) using code injection/process hollowing (see Chapter 9).
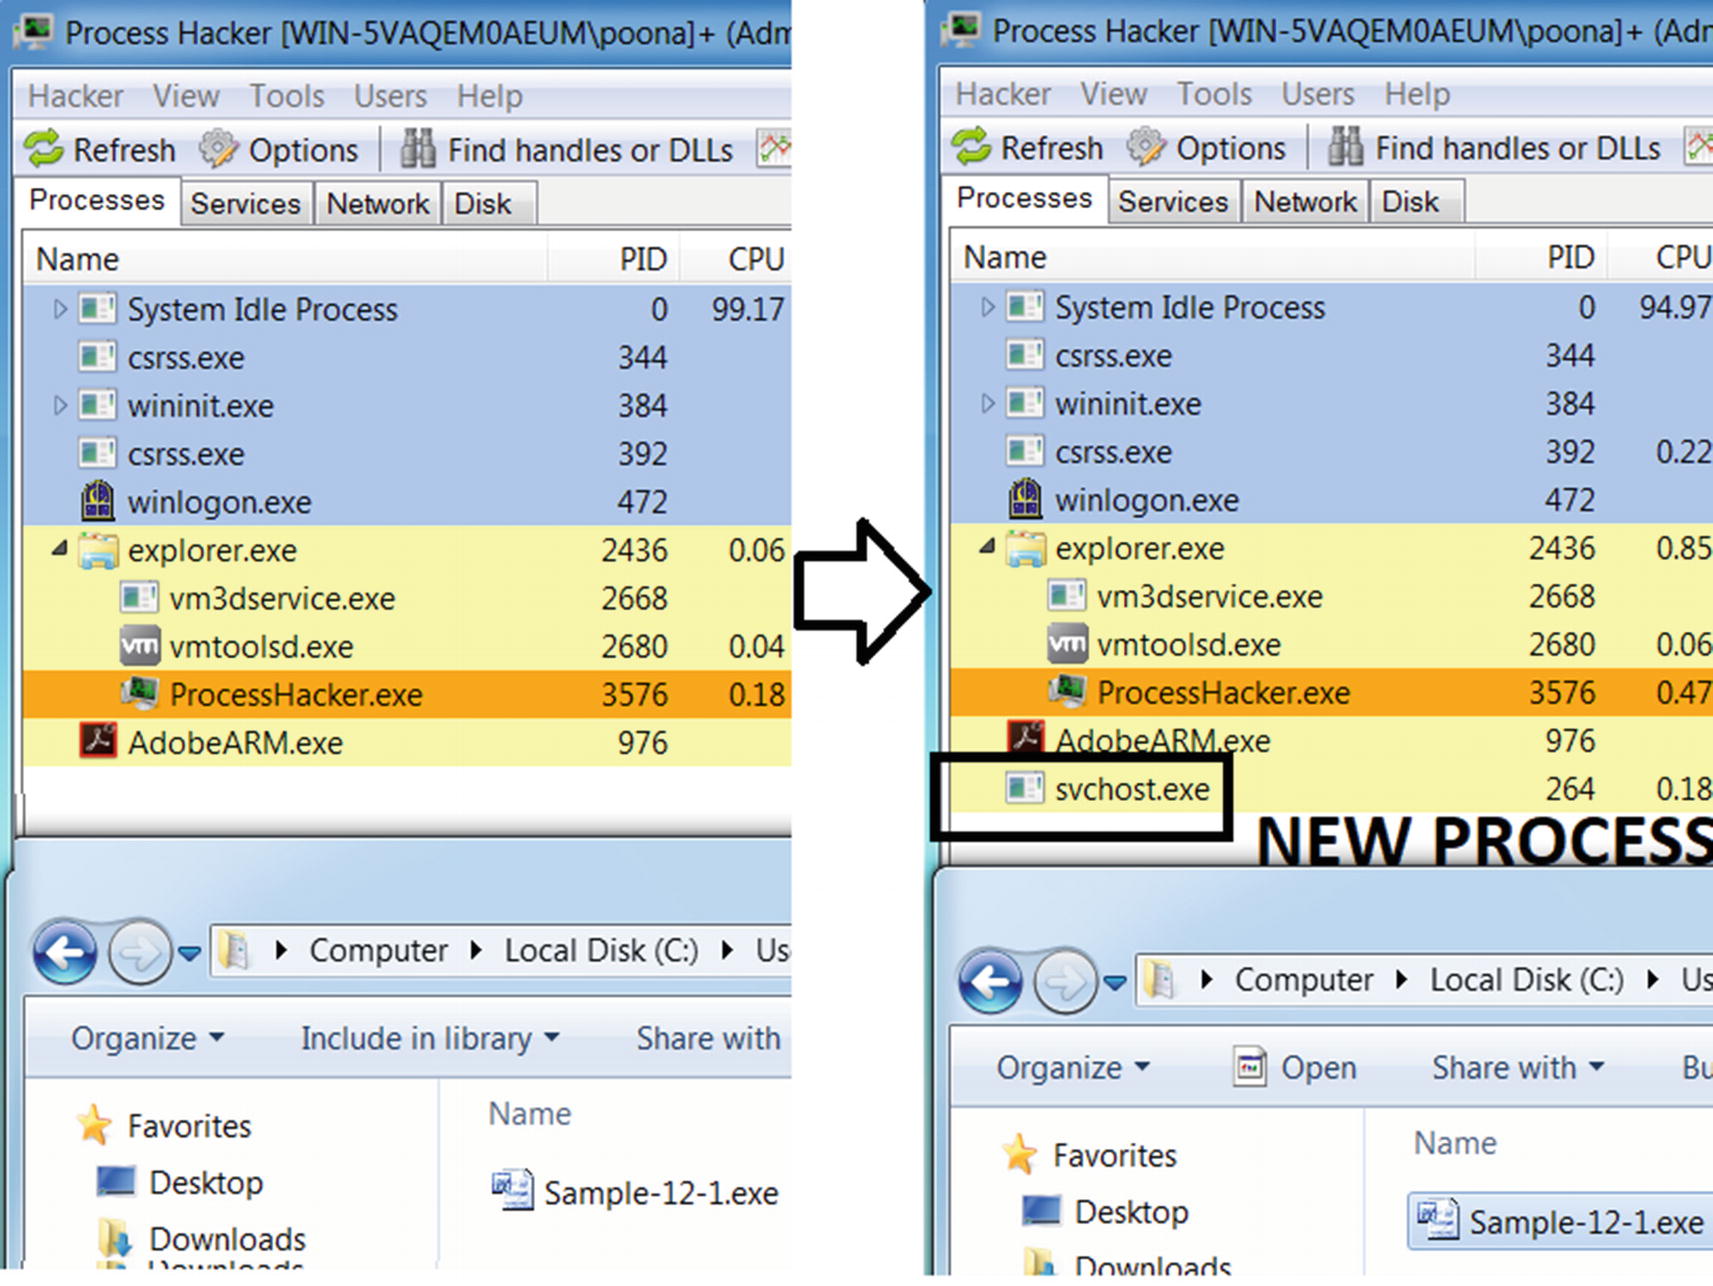
The properties, the absent parent process, session 1 for the newly created process indicate suspicious behavior and points to it being malware
Case Study 2
Let’s now play with Sample-13-2, to which you can add the .exe file extension. In the samples repo, it is named Sample-13-2.txt because it is a text file that holds instructions that you need to download the real malware sample. Don’t run the sample yet. Start Process Hacker and open the folder that holds the sample file, which should look similar to the left side of Figure 13-2.

The state of the system before and after running Sample-13-2
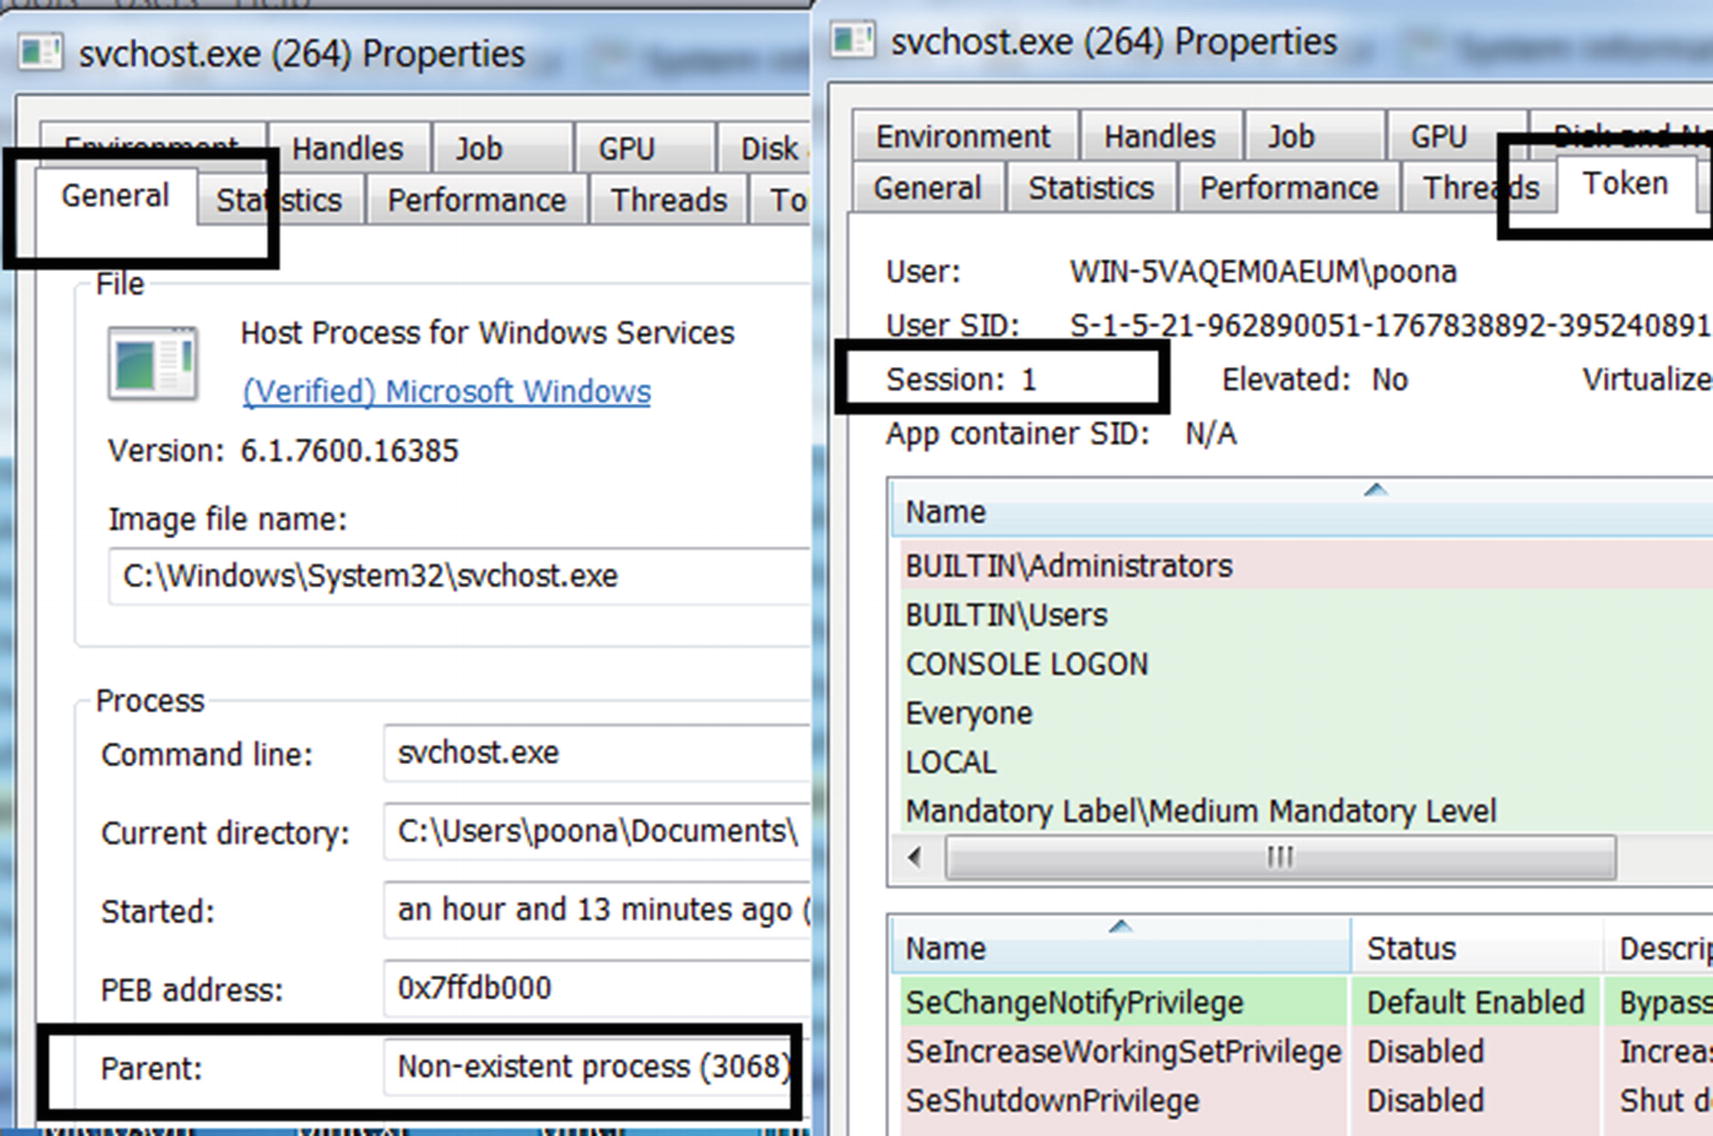
Both symptoms are suspicious. The name of the new process SVOHOST.EXE is suspiciously similar to the OS process svchost.exe, which is like the psycholinguistic technique, a stealth technique explained in Chapter 11. The deletion of the executable file on the disk is also a classic technique used by a lot of malware, which we explain later in the chapter.
Path of the newly created process is located in the protected OS system folder
All the observations made so far—both visually or through some minor inspection—all but point that the sample is malicious.
Case Study 3

The state of the system before and after running Sample-13-3
Now that you have that in place, run the sample. What do you see? From the right side of Figure 13-5, we see that suddenly all the files have been modified and a .doc file extension added to them. We also see a new file created in the same folder called Read___ME.html. Both indicators point to the Sample-13-3 being ransomware.
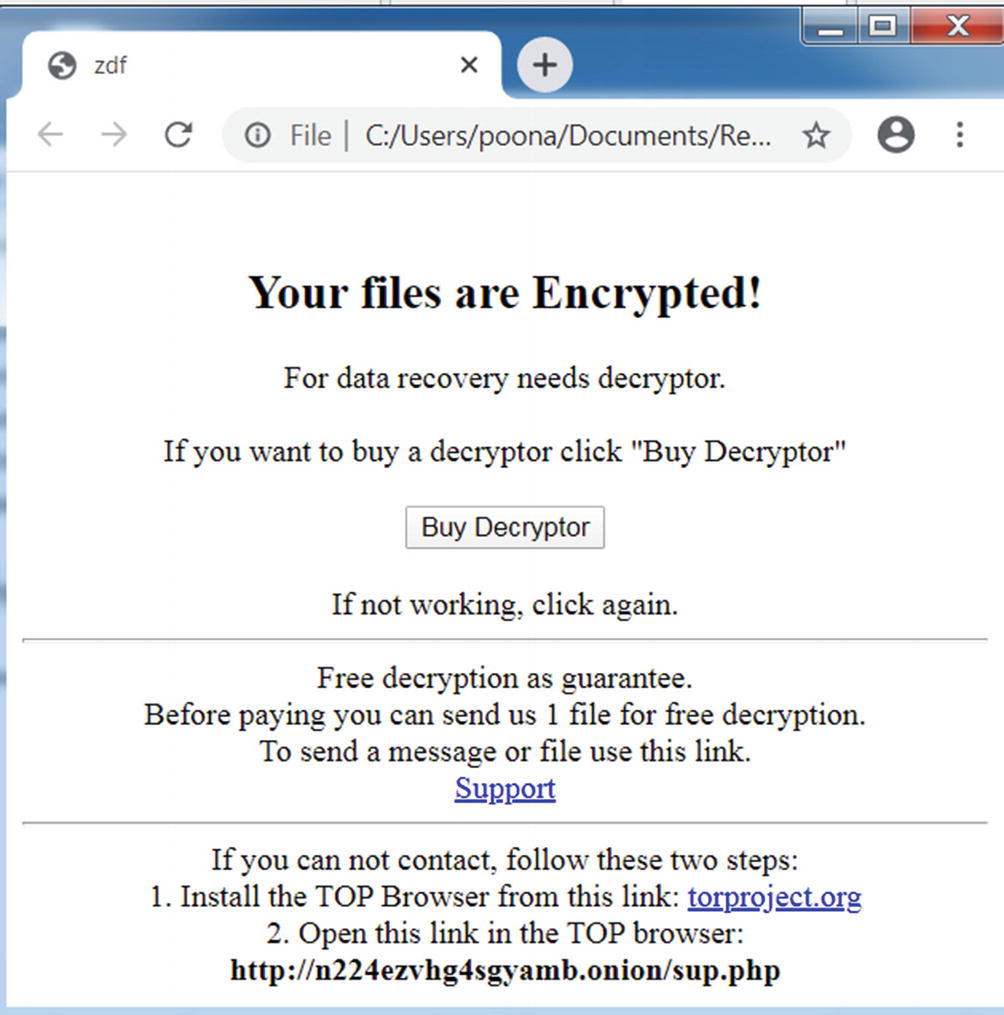
The ransom note created by our ransomware Sample-13-3.exe
These exercises taught that by casually running a sample and viewing its behavior and properties from a high level without using complex analysis tools, you can typically conclude whether a sample is malware or not, and in some cases, classify the type of malware.
APIMiner: API Log Behavior Identification
Malware carries out its activities that result in Win32 APIs being invoked. By using an API logger tool like APIMiner or Cuckoo Sandbox, you can obtain the APIs used by a sample. Based on the APIs, you can conclude if the sample is malware and figure out its category.

APIMiner command line issued from the command prompt to analyze Sample-13-1
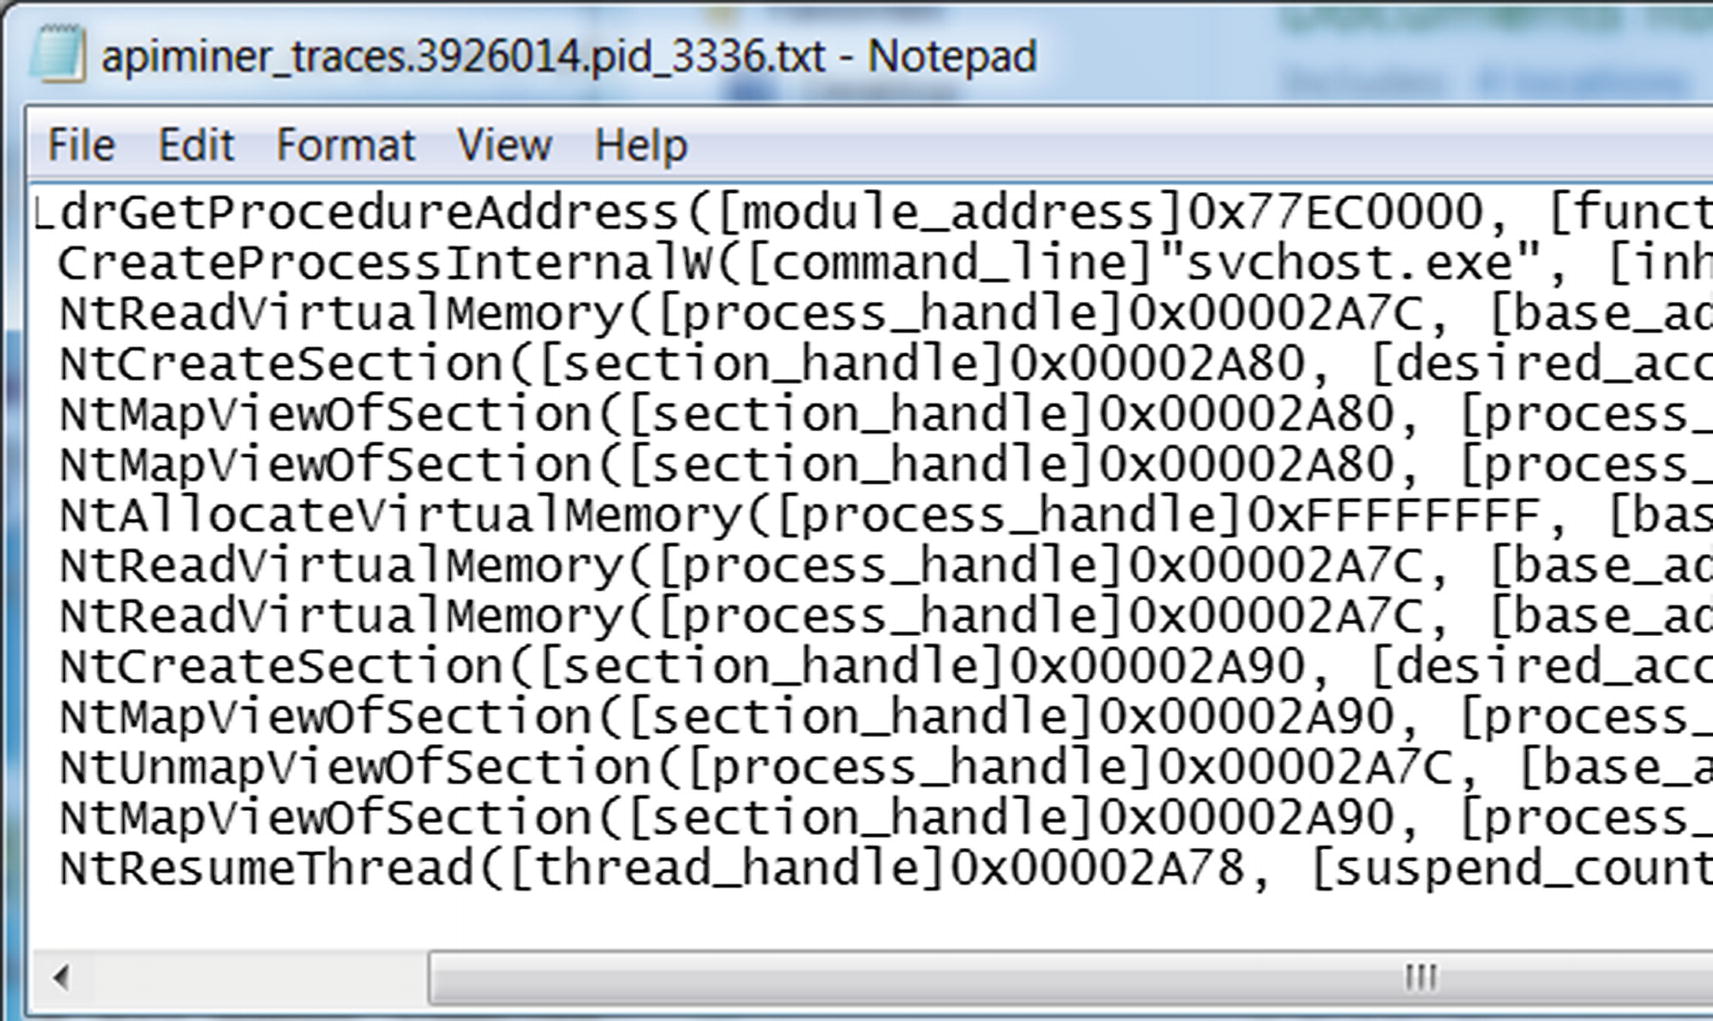
APIMiner API logs for Sample-13-1 shows a malicious sequence of APIs
A replica off Figure-13-8 above, holding a part of the APIMiner API trace output obtained by executing Sample-13-8 using APIMin
The sample using the CreateProcessInternalW API creates a new process for the program svchost.exe, which as you know is a system process located at C:WindowsSystem32svchost.exe
The process created is in a SUSPENDED state, identified using the argument value of 4 using [creation_flags]4. How do we know that the value of 4 means SUSPENDED? Check out the API description in MSDN for CreateProcess API and check for the CREATE_SUSPENDED flag.
The handle of this newly created process and thread are 0x00002A7C and 0x00002A78.
The sample using the NtReadVirtualMemory API then reads the memory from the remote process identified using the process handle 0x00002A7C.
The sample using the NtMapViewOfSection API then creates a section and maps a view of it into the remote process again identified using the handle 0x00002A7C.
It resumes the SUSPENDED thread/process using ResumeThread API, identified using the thread handle 0x00002A78, and process identifier 4080.
What does this entire sequence of APIs look like? If you go back to Chapter 9 and check the APIs in the section on process hollowing, you see the same set/sequence of APIs, which means the sample is using process hollowing, which is a feature mostly used by malware, if not only used by malware, thereby allowing us to conclude that it is malware.
Classify the Malware Family
Excerpt from the APIMiner API traces obtained by executing Sample-13-1.exe that shows the mutant related Win32 API being invoked
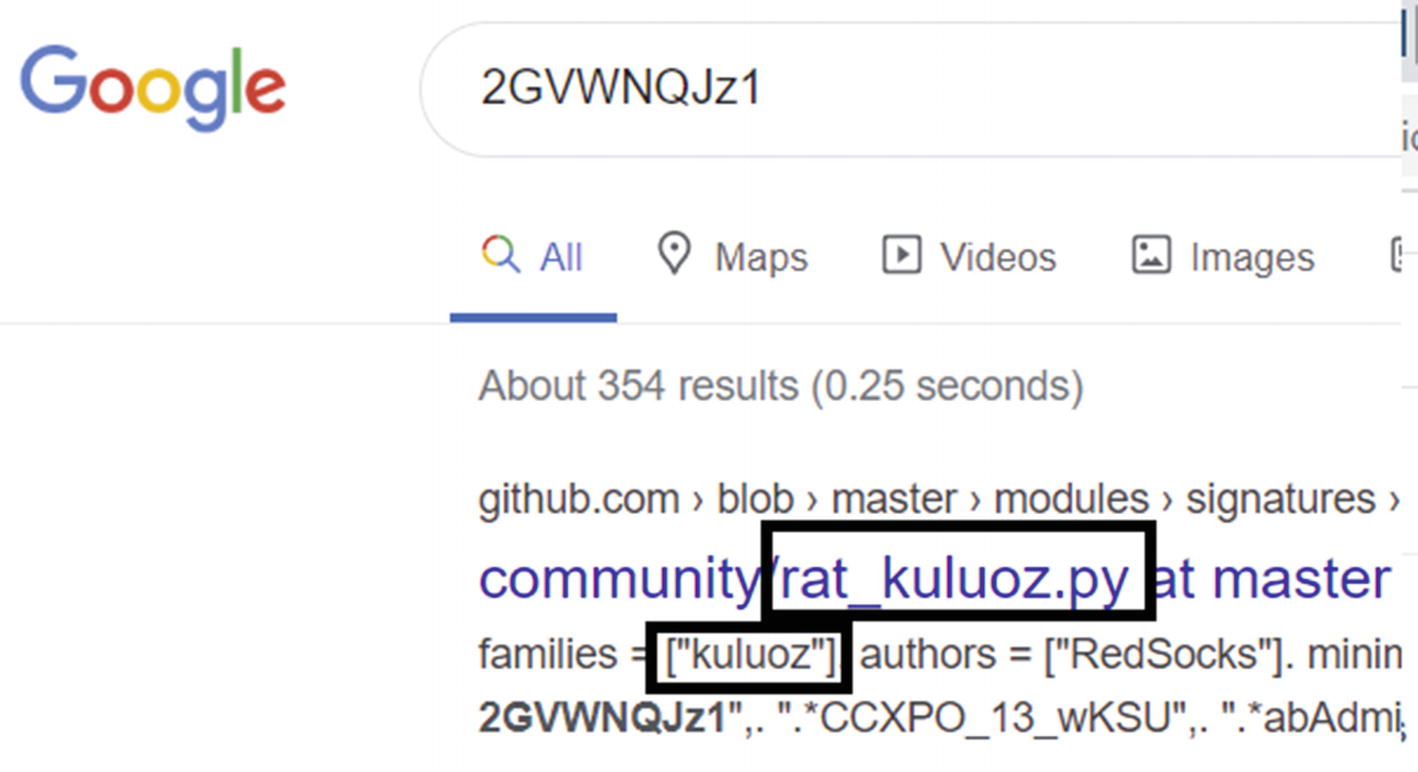
Mutex created by Sample-12-1 reveals it belongs to kuluoz family and is a bot
As an exercise, go through the API logs of various other malware samples, including Sample-13-2 and Sample-13-3. Note that we mention the most basic Win32 APIs used by malware throughout various chapters in this book. But the APIs that we listed are not extensive. As you analyze new categories of malware that carry out their dirty work through various sets of Win32 APIs that have never used before by other malware you have seen before, make a note of these API sequences so that you can use them to detect and classify other malware in the future.
String Analysis Dynamically
We covered strings extensively in Chapter 7 and Chapter 12. Continuing from where we left off in Chapter 12, you can use string analysis on running processes. Using strings for malware analysis is probably the most powerful tool in dynamic analysis. With it, you learn if a sample is malware or not, but also how to classify it (more on this in Chapter 15).
In Chapter 7, you saw that most malware is packed, which means most of the strings are obfuscated in the static malware file. This makes static analysis of strings using BinText useless. When we run packed malware, they unpack themselves in memory. After unpacking itself, all its obfuscated strings are now deobfuscated. The malware process’s memory becomes the buffer that contains various strings that we can use for string analysis.
Let’s play with Sample-13-4. Note that in the samples repository, it is named Sample-13-4.txt because it is a text file that holds the instructions you need to download the real malware sample. Before we get to analyzing strings in memory, let’s start with some preliminary static analysis on this sample.
File Type
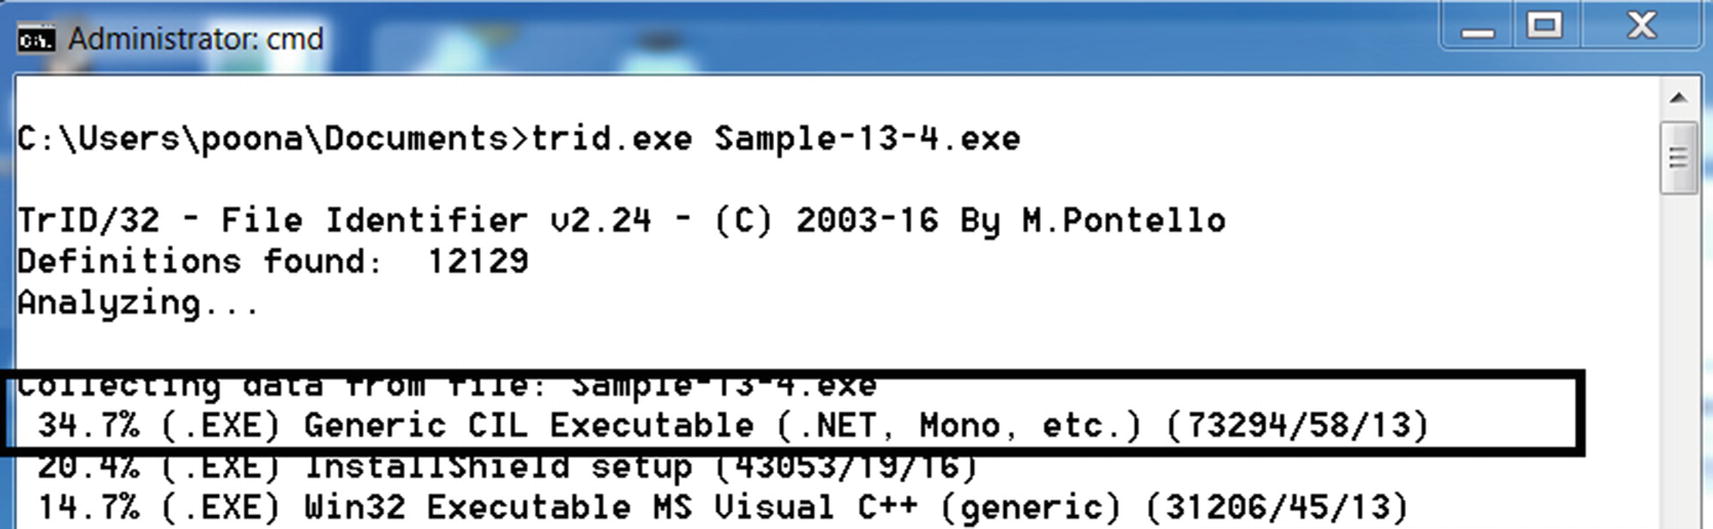
trid.exe reports that Sample-13-4 is of .NET type
In our Windows 7 analysis VM, it is fully updated. It installs the latest .NET Framework, which proves to be enough to run the sample, as you see later on. But if you are unable to run the sample, verify if you have the .NET Framework installed and, if so, check if it is the right version.
Version Information/Details
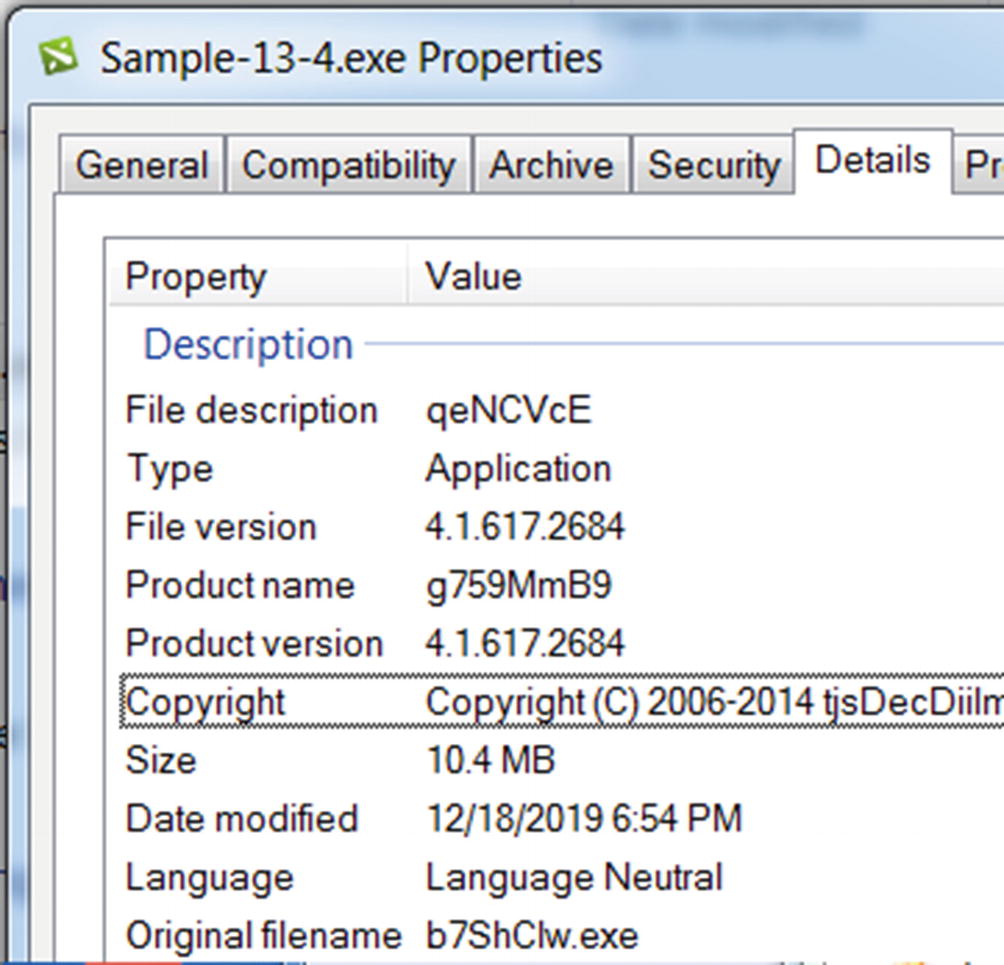
Sample-13-4 can be categorized as suspicious a sit holds junk property values
Packed or Unpacked?
The first step in the string analysis is to figure out if it is packed or not. We covered this in Chapter 7, where we had three main methods to identify if a sample is packed: entropy, static observation of strings in the file, and dynamic observation of strings in memory.
Entropy Check with PEiD
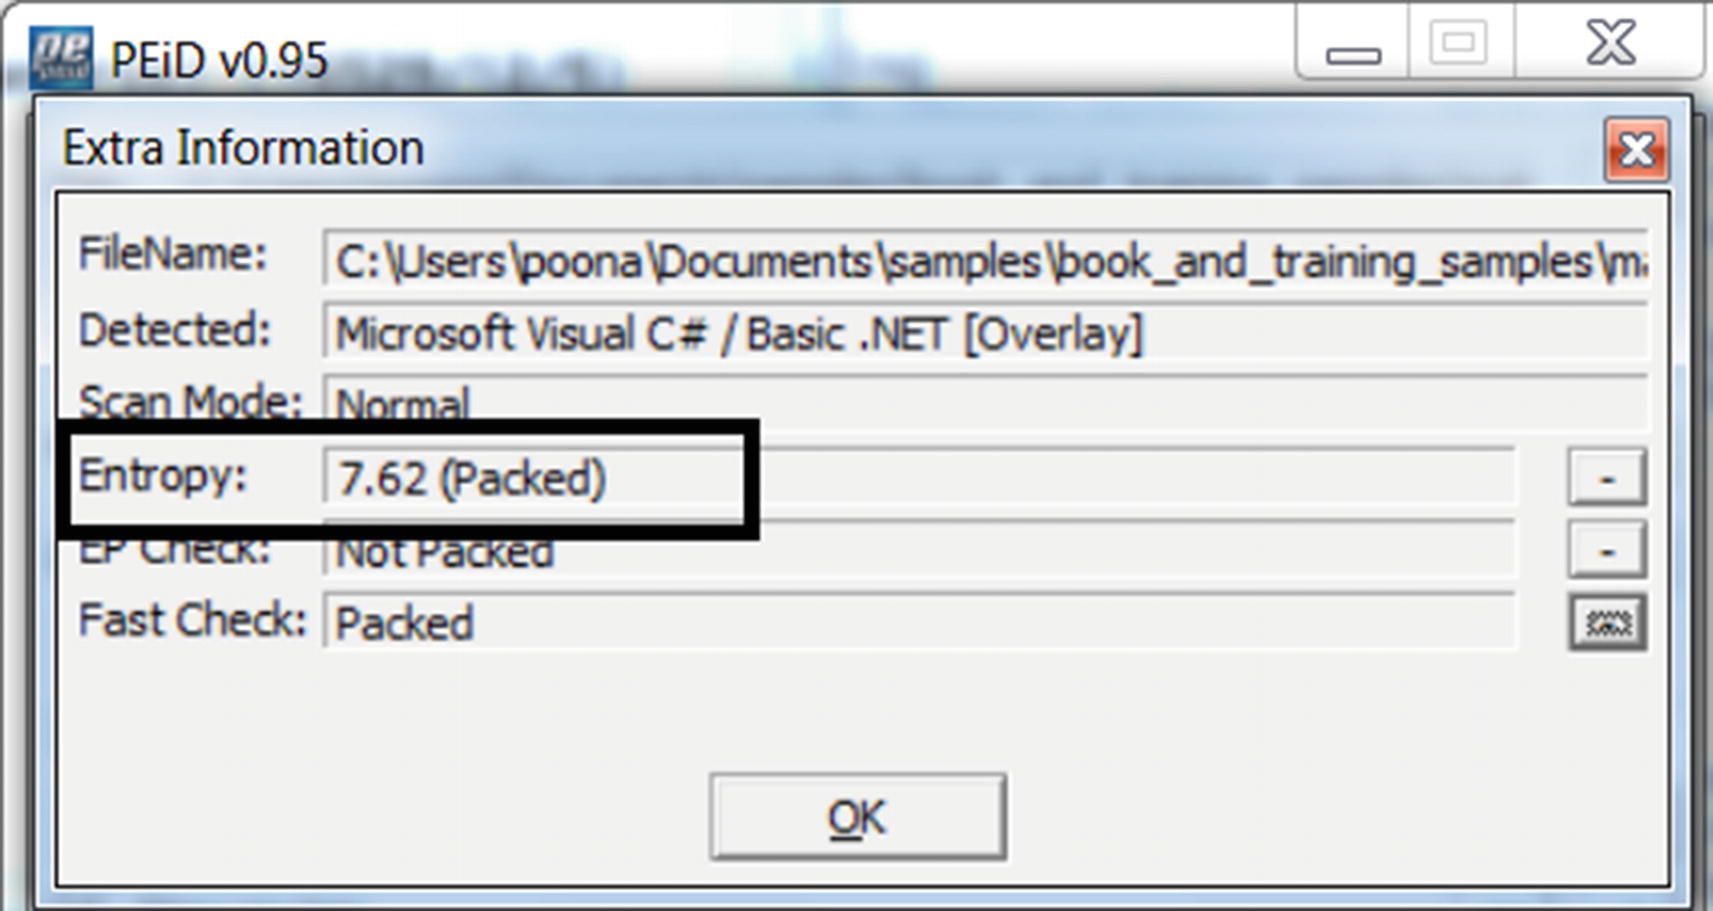
PEiD says Sample-13-4 has an entropy of 7.62 which indicates it is packed
Static Observation of Strings in File
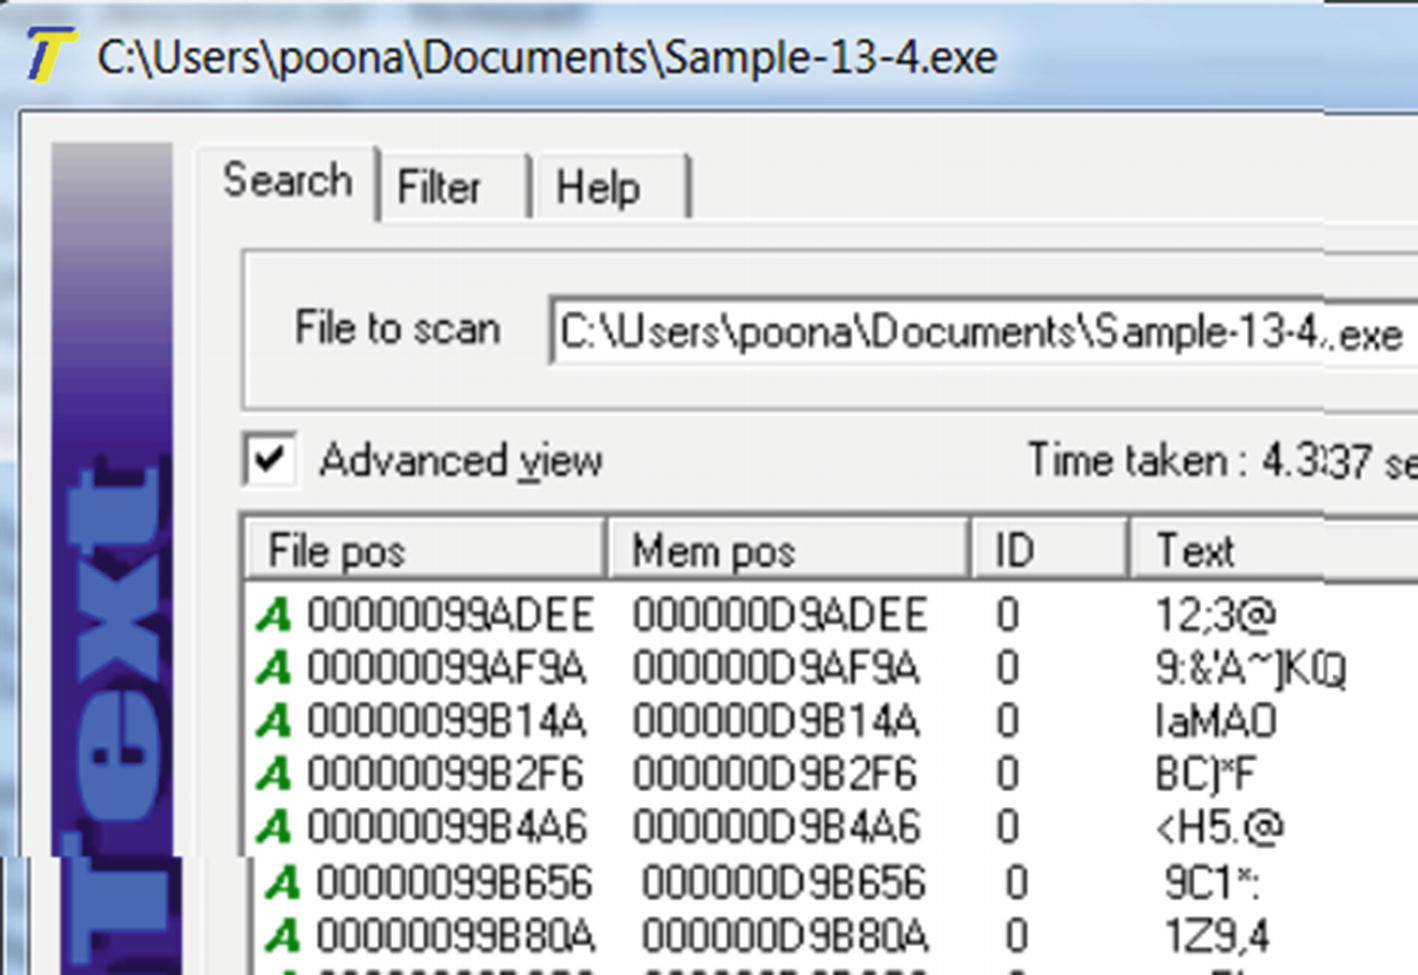
BinText reveals static strings that look like junk confirm it is indeed packed
Dynamic Observation of Strings in Memory
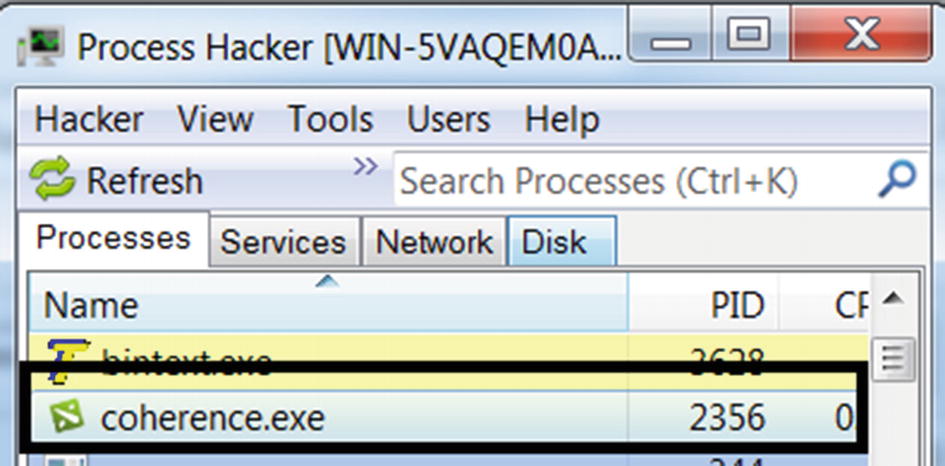
Running the sample eventually creates a new process called coherence.exe
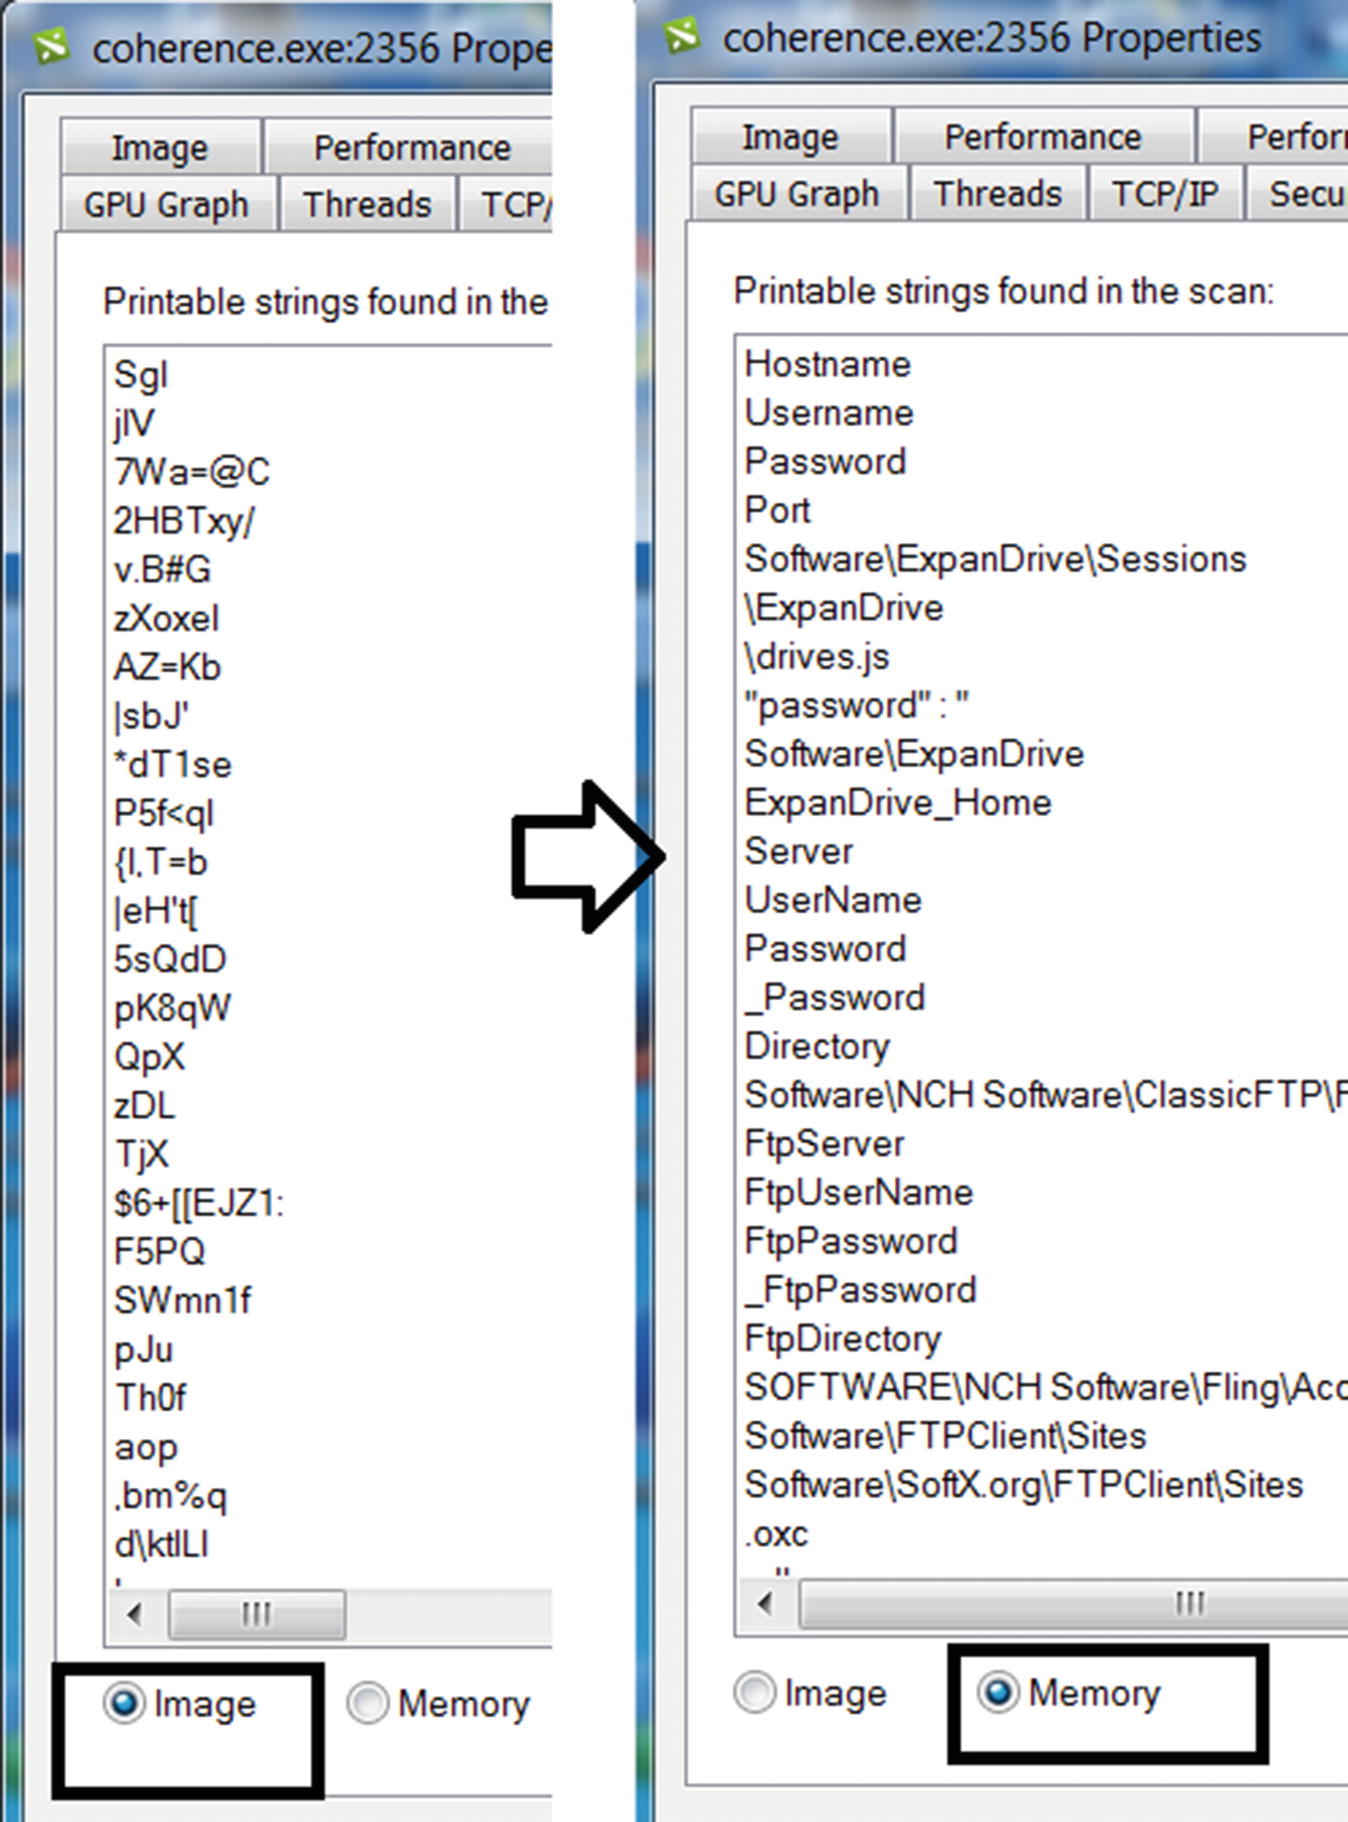
Sample-13-4 unpacks in memory as seen in the difference between its static strings in the file and dynamic strings in memory
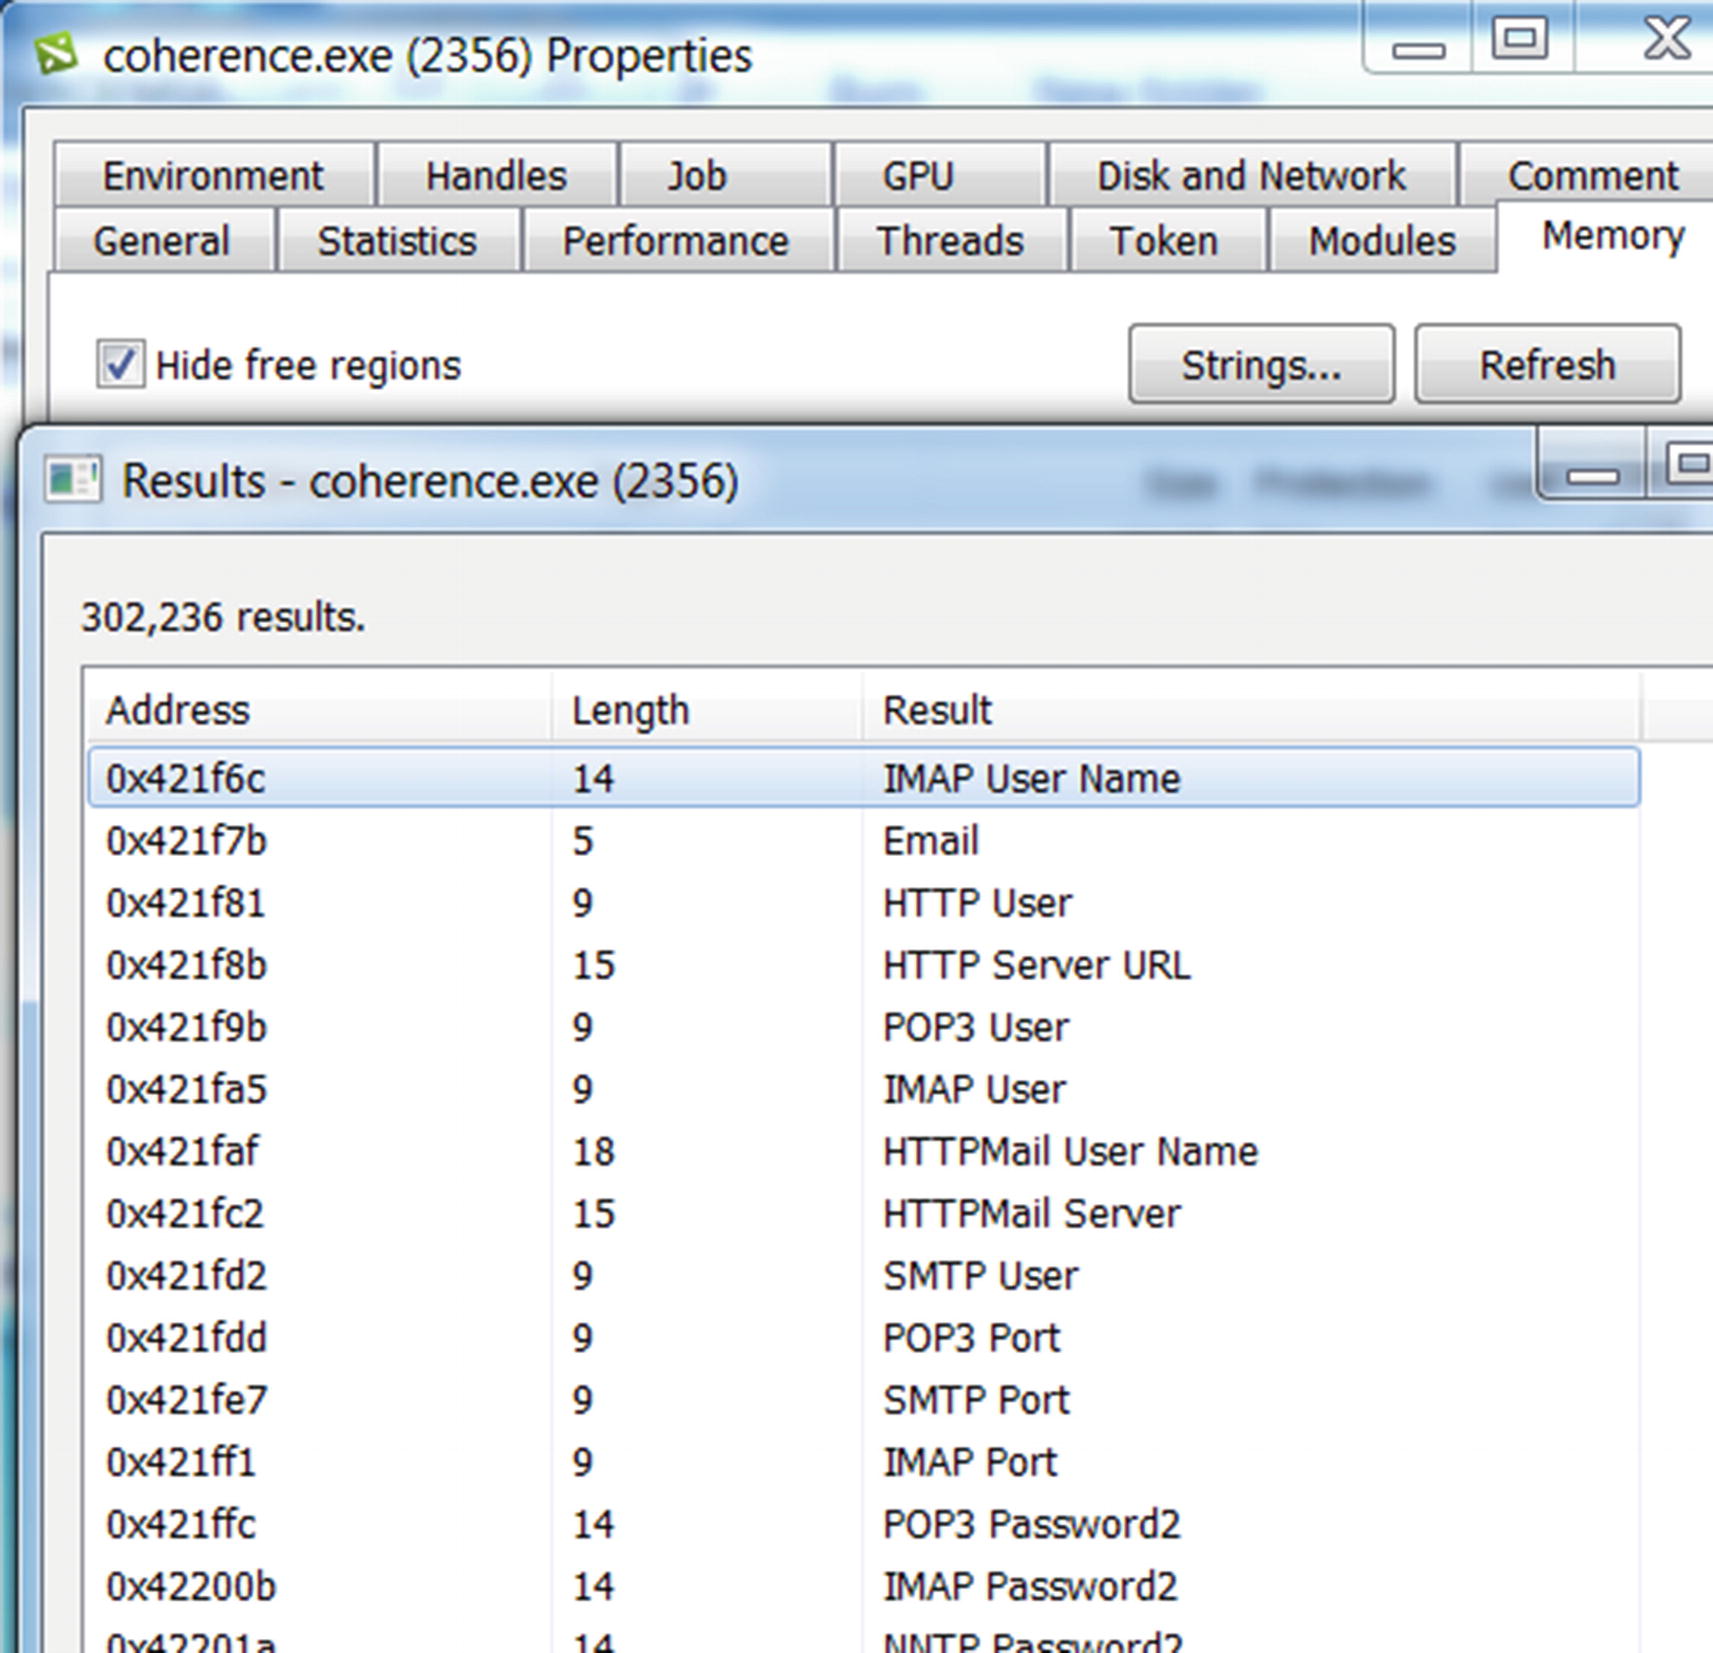
Sample-13-4 strings using Process Hacker that reveals a lot about this malware
What do you think we can infer from these strings? Go through the strings slowly, taking your time. Do you notice a lot of strings referring to Username and Password, in combination with various protocols, like SMTP and POP, and various tools, like Filezilla and Internet Explorer? This refers to a category of malware called InfoStealers that tries to steal credentials from various tools that the users use.
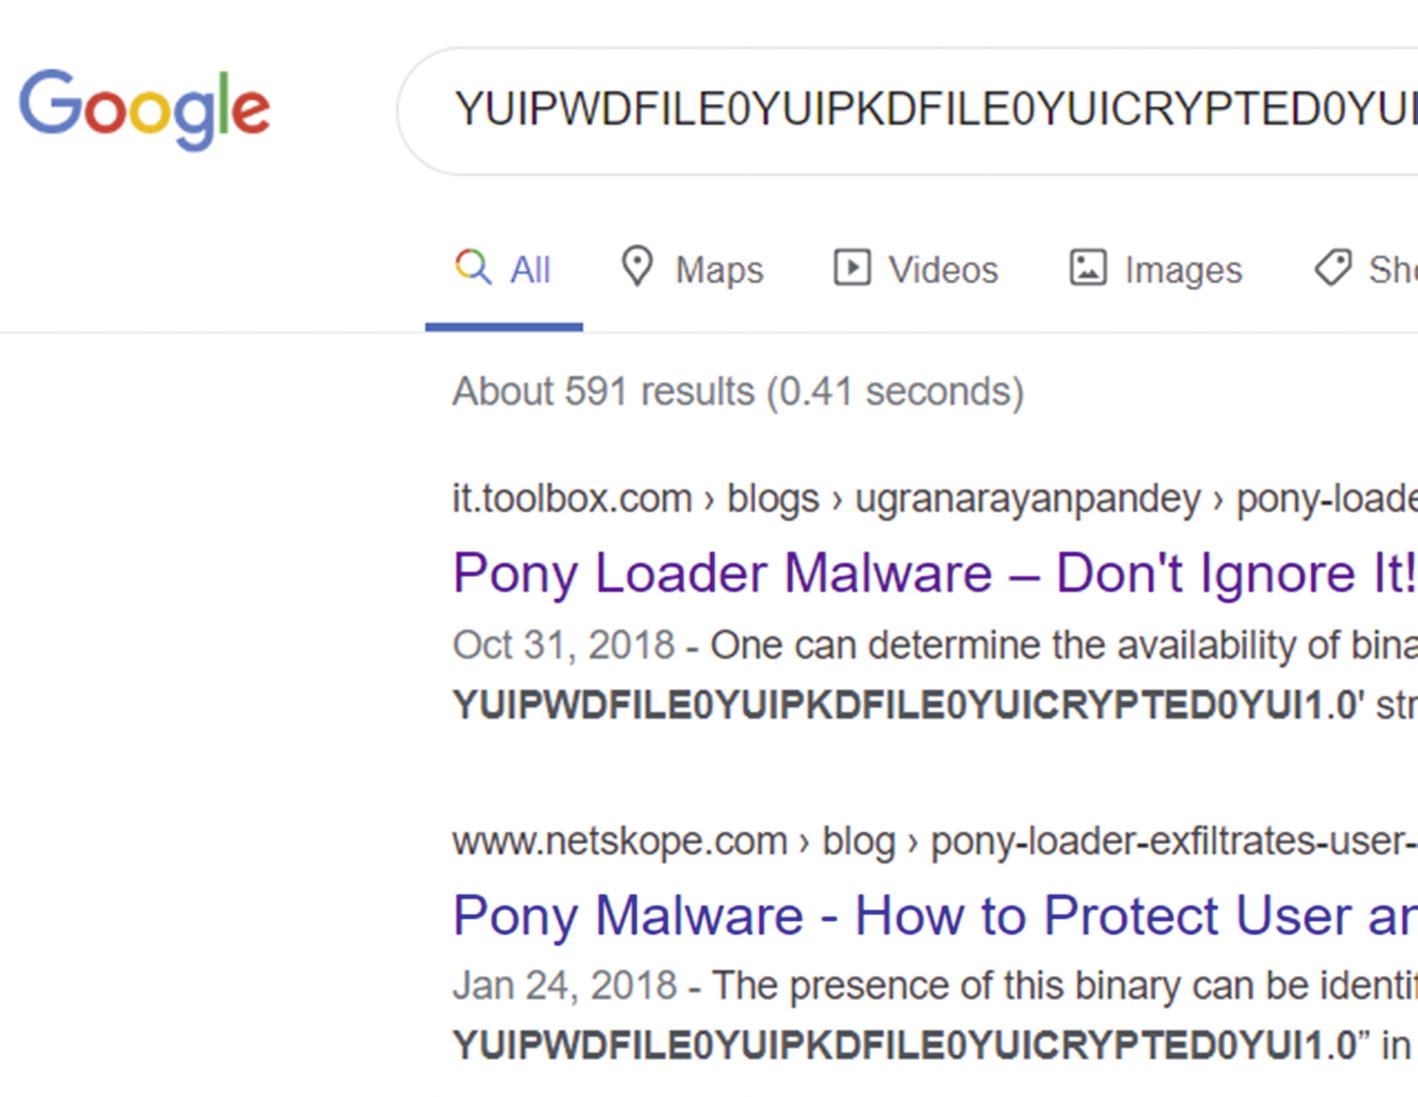
A string from memory for Sample-13-4 points to analysis reports on the web indicating it belongs to malware family Pony Loader or Fareit
ProcMon: Behavior Events Analysis
We have gone through various dynamic analysis techniques and tools like APIMiner, string analysis, and most importantly, a casual inspection of the malware’s behavior. Most of these techniques should be vastly sufficient in concluding this sample.
In this section, we show you how to use ProcMon, another very important analysis tool that can catch various events carried out by our sample when we analyze it and run. We ran through ProcMon in Chapter 11 and other chapters in Part 3, so it is useful to refer to those exercises whenever you want.
- 1.
Start Process Hacker so that you have an eye on the process(es) that are started when you run your sample.
- 2.
Start ProcMon and hit Ctrl+E to stop capturing events. By default, ProcMon captures all events on the system, and sometimes you have too many events.
- 3.
Hit Ctrl+X so that you can clear the existing events displayed by it.
- 4.
Hit Ctrl+E so that you can start the capture of events.
- 5.
Run Sample-13-2.exe, while making sure via Process Hacker that it is running or at least it has created other child processes.
- 6.
Let the sample run for a while, and then hit Ctrl+E in ProcMon. You don’t want to run it too long, however; otherwise, you are inundated with too many events to analyze.
Let’s go through the events and see if we can notice any malicious events/indicators from events related directly or indirectly to our sample process. Note that you want to look for events from the main malware process, Sample-13-2.exe, and from all the child processes created by this sample process and from other processes that our sample or its children possibly code inject into. You can filter events first to start with only Sample-13-2.exe.

ProcMon events show the sample copying itself into system folder as a new file SVOHOST.EXE
- 1.
Creating a new file called SVOHOST.EXE, which is named very similar to the system program svchost.exe, which from our experience indicates the psycholinguistic technique, a stealth technique explained in Chapter 11.
- 2.
Creating a new file from step 1 in the protected system folder C:WindowsSystem32. Third-party applications don’t make modifications to any content in the OS system folder.
- 3.
Copying and pasting its contents into this new file, which is a commonly used malware technique, where malware copy themselves into a new file in another folder on the system so that they can run as a new process from this new file located in this new folder.

ProcMon events show the sample creating RUN persistence keys in Registry
AutoRuns
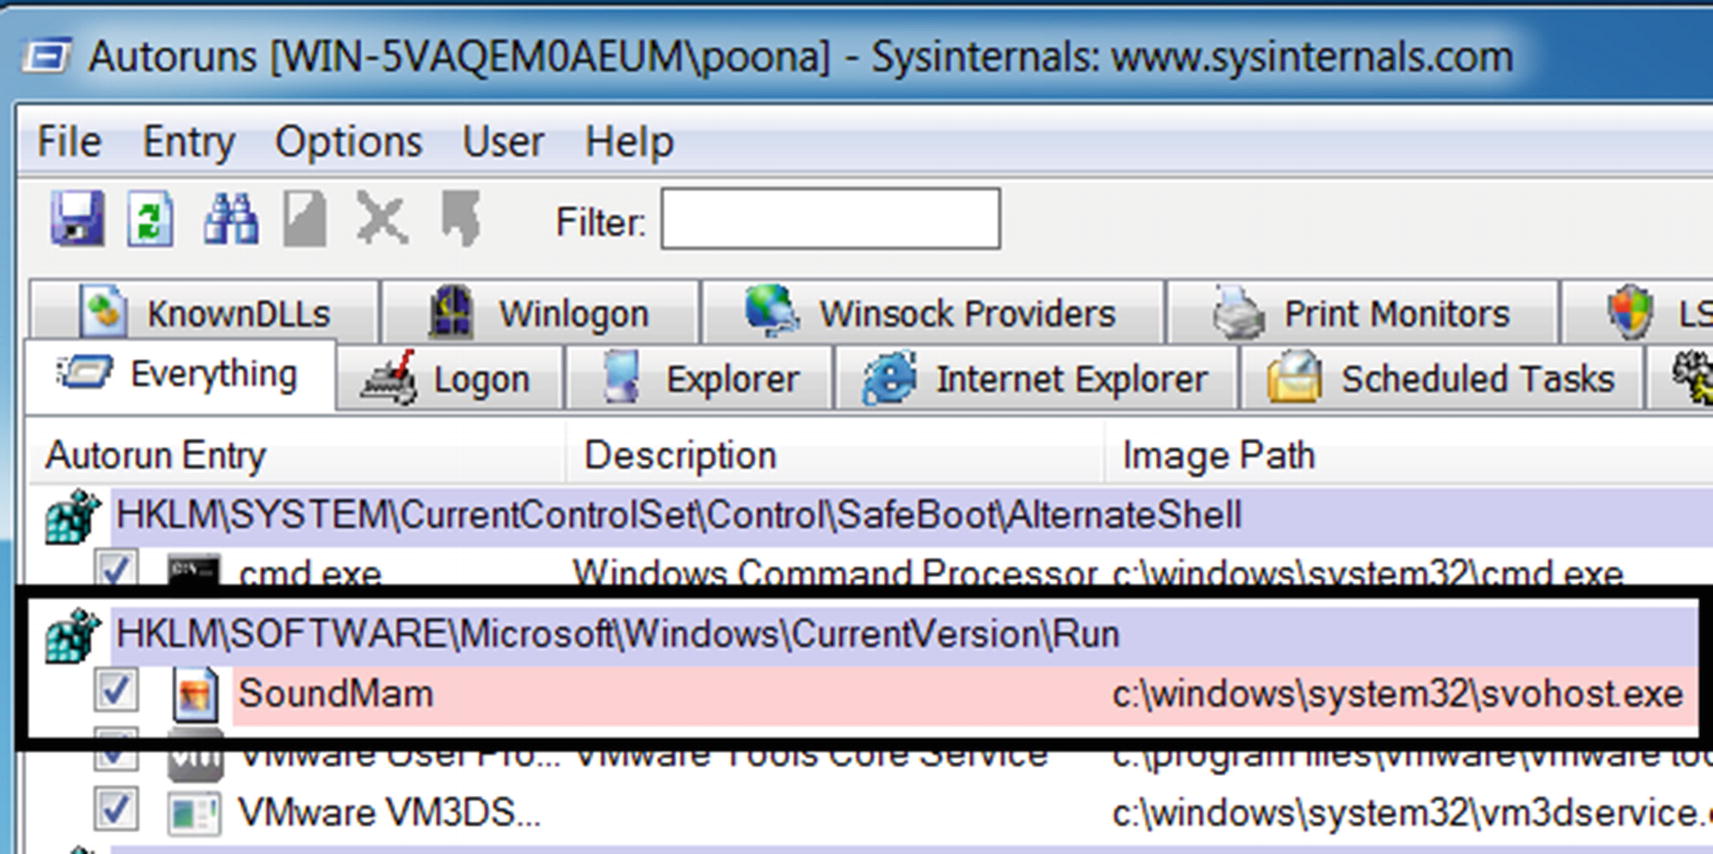
Autoruns picks the RUN entry persistence created by Sample-13-2.exe

Process creation events from ProcMon shows Sample-13-2.exe creating a new process out of SVOHOST.exe which it created earlier in the Windows system folder
- 1.
Creates a new file C:WindowsSystem32SVOHOST.exe in the system folder, using a file name similar to the system program svchost.exe.
- 2.
Copies itself into this new file from step 1, SVOHOST.exe.
- 3.
Creates a persistence RUN entry in the registry for this new file from step 1.
- 4.
Starts a new process out of this new file from step 1, SVOHOST.exe.
Combined, there are enough indicators to conclude that Sample-13-2.exe is malware. We can continue with our event analysis by going through the events of SVOHOST.EXE, which is a child process of Sample-13-2.exe. We leave that as an exercise for you.
We have covered the various basic dynamic analysis power tools. In the next set of sections, let’s go through other tools and other malware properties and dynamic events that we can extract in combination with the basic dynamic analysis tools to draw a conclusion on the sample we are analyzing.
Detecting Code Injection
Code injection is one of the most prevalent features used by malware, so detecting it is important.
Code injection is caught using various techniques. One method detects the use of certain Win32 APIs. We listed the various APIs used by different code injection techniques in Chapter 10. Keeping these APIs in mind, and by using a tool like APIMiner, you can easily detect code injection.
Similarly, we can also detect code injection by using ProcMon. Certain code injection techniques involve creating a remote thread in another process, which pops up as an event in ProcMon. Usually, remote thread injection doesn’t always mean it is malware, since even clean software like debuggers can create a remote thread in another process. But if seen, you can treat it as suspicious and possibly code injection in progress and investigate it further. On seeing such an event, you should investigate both the process that created the remote thread and the remote process in which the new thread was created. Another effective method to detect certain code injection techniques is by searching for page properties where injected code pages most often have RWX permission and are private pages. Also, a good means of analysis at this point is to inspect the strings in the remote process memory searching for any malicious memory artifacts.
GMER and Ring3 API Hook Scanner
At this stage, let’s assume you have figured that the malware sample carries out code injection. Not every code injection technique indicates that the malware intends to do API hooking or is trying to use rootkit functionality. But it is a high possibility at this point that one of the intentions of the malware might be API hooking or rootkits. At this stage, it is best to run tools like GMER and Ring3 API Hook Scanner, both of which can easily tell you if any APIs have been hooked and if a rootkit has been detected. For more on this, you can refer to Chapter 10 and Chapter 11 for rootkits.
Yara on Live Processes
In Chapter 12, we explored how you can write YARA rules and run them on files on disk. You can also use the YARA tool. Run it with YARA rules against live running processes, which then use the process’s memory as a buffer to run the rules against. Try the YARA exercises in Chapter 12, but run the exercise samples against the live process by using the command line yara32.exe <yara_rules_file_path> <PID_OF_PROCESS>. The third parameter (<PID_OF_PROCESS>) is the PID of the process whose memory you want to scan with the YARA rules.
Other Malicious Behavior
Throughout Part 3 of this book, hands-on exercises demonstrated the various features and behaviors displayed by malware. We used various tools, both static and dynamic, for detecting malware features and events and not only concluded that a sample was malware but also determined its intent.
In this section, we rehash some of these notable malware features and how to identify them. To catch these malware features, we need static and dynamic analysis tools. It is important to know how to use these tools and all the malware features and events. Please refer to prior chapters when asked and play with the hands-on exercises. The more these concepts are ingrained in your mind, the more they become second-nature.
Stealing System File Names for Stealth
We covered stealing system file names for stealth in Chapter 11. In this technique, the malware uses the names of various OS system programs to name their malware files and processes in a bid to fool users into thinking they are clean OS programs and processes.
This mechanism of the malware can easily be noted by casually observing its behavior, the path of the process’s program file on disk, and other process properties by using tools like Process Hacker and Process Explorer.
Weird File and Process Names
We covered weird file names and process names in Chapter 11. With these techniques, malware uses enticing and misleading names to fool the user into clicking its files or ignoring process names in Task Manager.
This mechanism of the malware can easily be noted—first, by a good dose of common sense, and second, by having good knowledge of what normal programs and processes are named on your clean system. If you know how most OS system programs and processes are actually named, this will help you catch anomalous files and process names that look similar to the real ones.
ProcMon, APIMiner, Process Hacker, and casual observing file and process properties using a file browser are easy ways to obtain malware-event information, on top of which you can apply your common sense to catch anomalous behavior.
Disappearing Executable
A very common mechanism used by most malware is to copy itself to another location and then delete its program file on disk. You saw an example of this in Figure 13-3.
This malware technique easily pops up in the file browser if you casually observe its behavior when you run it. Similarly, ProcMon catches the event when the file is deleted. APIMiner catches the same events through CopyFile() and DeleteFile()Win32 API calls.
Number of Process Instances
Malware has a habit of using OS program/process names for its programs/processes. But we can catch this malware technique by exploiting the fact that there are only a certain fixed number of OS system processes that run at an instance of time. We see more processes than the fixed number for that OS system process name, and we can conclude we have something malicious going on.
We talked about this in Chapter 5. This technique can be easily caught by a tool like Process Hacker by casually observing the name of every process created when you run your analysis sample. If the newly created processes have a system program/process name, manually counting the number of instances with that process name.
Process Session IDs
Malware often names its programs/processes after OS system programs/processes. But most OS system programs run under session 0, as you learned in Chapter 5.
We can easily catch this malware behavior using Process Hacker by casually observing the name of every process created when you run your analysis sample. If it has a system program/process name, and verify if its session ID is 0 or not.
Summary
Continuing from Chapter 12, where we explained how to statically analyze samples, in this chapter, you learned how to run a sample and observe its behavior dynamically. We rehashed the dynamic analysis tools and techniques that we covered in Part 3. These techniques and tools help us identify a sample as malicious and then classify and categorize them. We extended your knowledge of string analysis, and you learned how to use it to dynamically search for malware string artifacts in a process’s memory. We also rehashed the other important malware behaviors that you can detect with the aid of dynamic tools.