
Code injection is a feature used by almost all malware for various reasons, including stealth. In Chapter 10, we explained the various types of code injection techniques available and the dynamic techniques that we can employ to identify them. In this chapter, we take a deeper look at code injection but from the point of view of reverse engineering, learning how to locate the injected code, finding the location in the parent process where the injection happens, and finally learning how to debug the child process after injection.
API Logs and Breakpoints
A good first step before you start reversing a sample is to run it through an API logger like APIMiner, Cuckoo Sandbox, or any other sandbox for that matter. An API logger generates and logs all the APIs used by the sample, giving you an understanding of the main functionalities of the sample. Also, identifying various sequences of APIs in the generated logs allows you to locate the point in the sample execution where it transitions from the packer stub/loader code to the unpacked payload code, which greatly helps you while debugging the sample, as you will learn in the next section.
Armed with the API logs in hand, you can now set breakpoints on these Win32 APIs using your favorite debugger, allowing you to jump to specific points in the sample execution, allowing you to skip tons of other unwanted code. For example, if you want to jump straight to the point where code injection takes place, you can set breakpoints on all the APIs related to code injection, which we have covered in Chapter 10. We use this technique in the next set of sections to identify and locate the injected code and debug the child process after injection.
IEP: Injection Entry Point
As you learned in detail in Chapter 10, every code injection involves an injector process and a target process. The injector injects code into the target process. Often, the target process is a benign process that the malware can use as a host to execute its malicious code.
After injecting its malicious code into the target process, the injector needs to execute its injected code inside the target. The execution doesn’t need to start from the first byte of the injected code. The injected content doesn’t need to have executable code from its very first byte. If the injected code is a DLL module, the first bytes start with the PE header, and the executable code lies somewhere deep inside the PE file format. But where is the injected code located in the target process?

Injection process and the injection entry point
From a reverse engineering point of view, to debug this injected code in the target process, we need to locate the IEP and start our debugging process from this particular location. Since the IEP in the target process is determined by the injector processes, looking into and debugging the injector process can give us clues about the value of the IEP in the target process.
In the next set of sections, we learn how to locate the IEP by using two injection techniques as case studies. The concepts you learn to locate the IEP with these two injection techniques can be extrapolated to any other injection technique that can be used by malware.
Locating IEP with CreateRemoteThread
Let’s start with one of the most traditional remote code execution techniques, the one that uses the CreateRemoteThread API to execute code in a target process.
For understanding this technique, let’s use Sample-18-1 from our samples repo and execute it using the help of our dynamic API logging tool APIMiner. Make sure you add the .exe file extension to this sample before using it. This sample works by injecting its code into an instance of the notepad.exe process and then executes its injected code inside the notepad.exe process. To run this sample, make sure that you have at least an instance of notepad.exe process running on the system.

APIMiner API logs for Sample-18-1.exe
- 1.
The sample locates an instance of the notepad.exe process by iterating the list of processes on the system using the CreateToolhelp32Snapshot, Process32First, and Process32Next APIs.
- 2.
With the notepad.exe instance target process identified, the sample opens the process using NtOpenProcess API.
- 3.
With a handle to the target process obtained, the sample allocates memory in the target process by using the NtAllocateVirtualMemory API.
- 4.
With memory now allocated inside the target, the sample now uses the WriteProcessMemory API to write/inject its injected code into the target.
- 5.
With the sample now having injected its code, it executes the injected code in the target process using the CreateRemoteThread API.
Figure 18-2 highlights in the API logs file some of the APIs we have listed in the steps, that have been used by the Sample-18-1.exe during the injection process. Do note that APIMiner logs the NT version of the Win32 APIs, which are usually called by their non-NT Win32 wrappers. Whenever you see an NT API, mentally try to figure out the wrapper Win32 API that has invoked the API. You can also use Google to search for the Win32 wrapper APIs that call these NT APIs. For example, while debugging, you encounter the VirtualAllocEx API , which is a wrapper for the NtAllocateVirtualMemory NT API and allocates memory into the target process.
Armed with these APIs from the log files, we can track down the injected code using the debugger.
Before debugging Sample-18-1.exe, make sure that you have at least an instance of notepad.exe running, as the sample needs it to inject code into. Open Sample-18-1.exe using OllyDbg, and it starts the process and breaks/stops at the entry point of the sample. To know how to use the debugger to debug this sample, you can refer to Chapter 16.
As you learned from Chapter 10, the first point of code injection usually happens with the OpenProcess Win32 API, whose NT API version is NTOpenProcess. We can straight away start debugging from this point, by setting a breakpoint on OpenProcess and then continue debugging the code. Although our APIMiner API logs show NtOpenProcess as the API, we are setting a breakpoint at OpenProcess since we know that NtOpenProcess is a lower-level NT API that is invoked by the higher-level wrapper OpenProcess Win32 API. You can also set a breakpoint on NtOpenProcess, and that should also work.
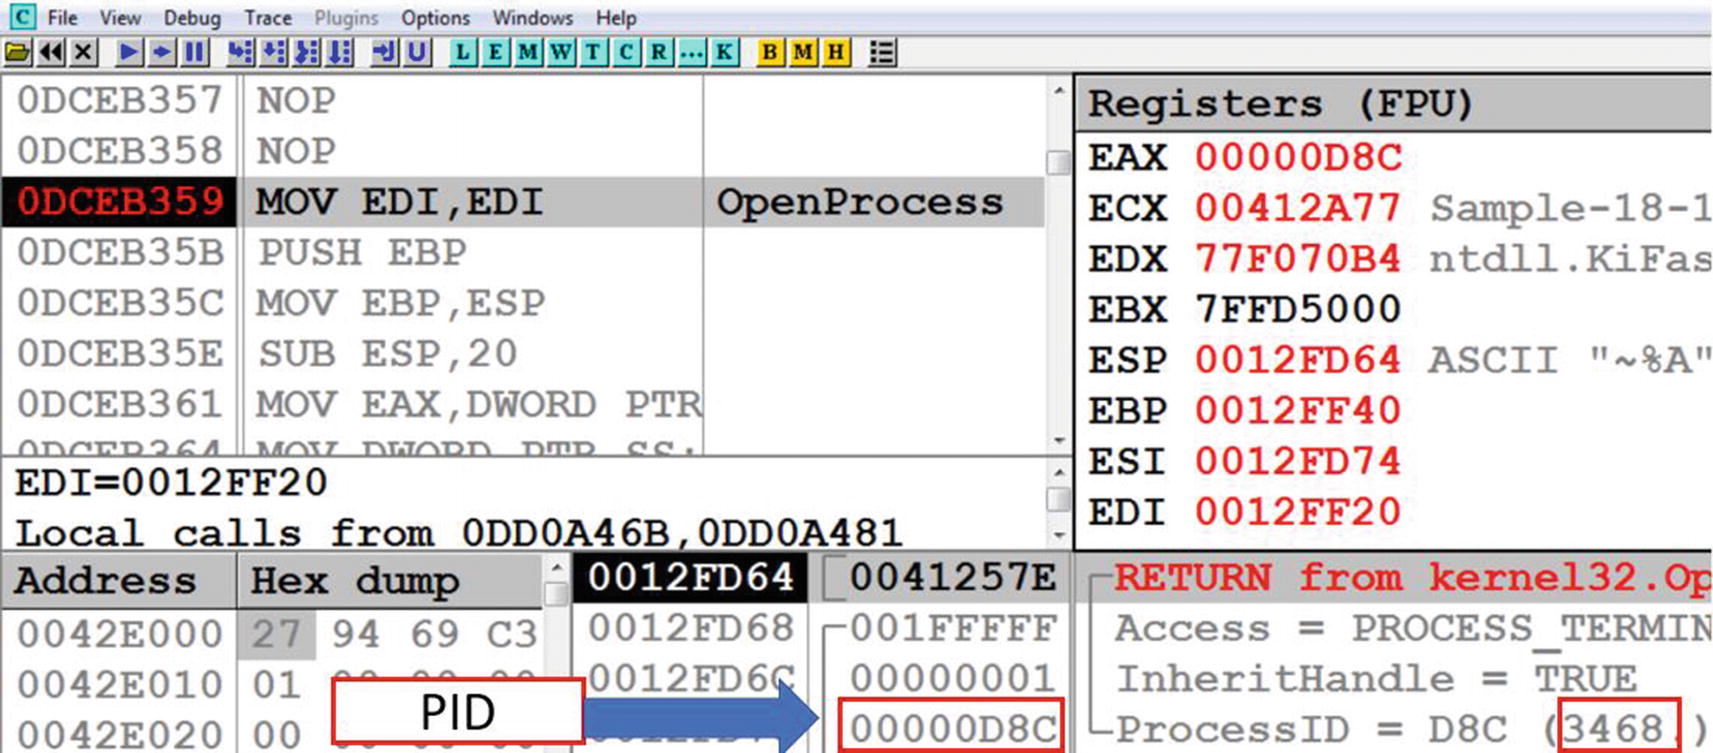
Debugger breaks at OpenProcess API on which we have set a breakpoint for Sample-18-1.exe
When the OpenProcess API is executed, it returns a handle to the process that has been opened in the EAX register. You can finish the execution of the OpenProcess API and return from inside this API back to the user code by using the key combination of Alt+F9. After returning to the user code, you can check the value of the EAX register. In our case, the value of the EAX register is 0x84, which is the handle of the process that was opened using OpenProcess. Make a note of both this process handle value and the PID, which on our system are 0x84 and 3468 respectively, as these values are used as arguments to other Win32 APIs called subsequently by the sample to carry out the code injection. Later, you use the same process handle value as arguments to VirtualAllocEx, WriteProcessMemory, and the CreateRemoteThread APIs.
As you can see in our API logs in Figure 18-2, the sample calls VirtualAllocEx(NtAllocateVirtualMemory, the NT version in APIMiner), which allocates a space of 500 bytes inside the target process. From where we previously left off after exiting OpenProcess, you can either single-step your way till you hit the CALL instruction, which calls this VirtualAllocEx API. Alternatively, you can set a breakpoint on VirtualAllocEx and run the debugger, and it automatically breaks when this API is hit, and you can then exit the API back to the user code.

VirtualAllocEx API called by our Sample-18-1
Step over this CALL instruction of VirtualAllocEx. The execution of VirtualAllocEx returns the address of allocated memory in the EAX register, which is 0x340000 for us. Make a note of the address allocated for you by noting the value of the EAX register after this API is invoked.
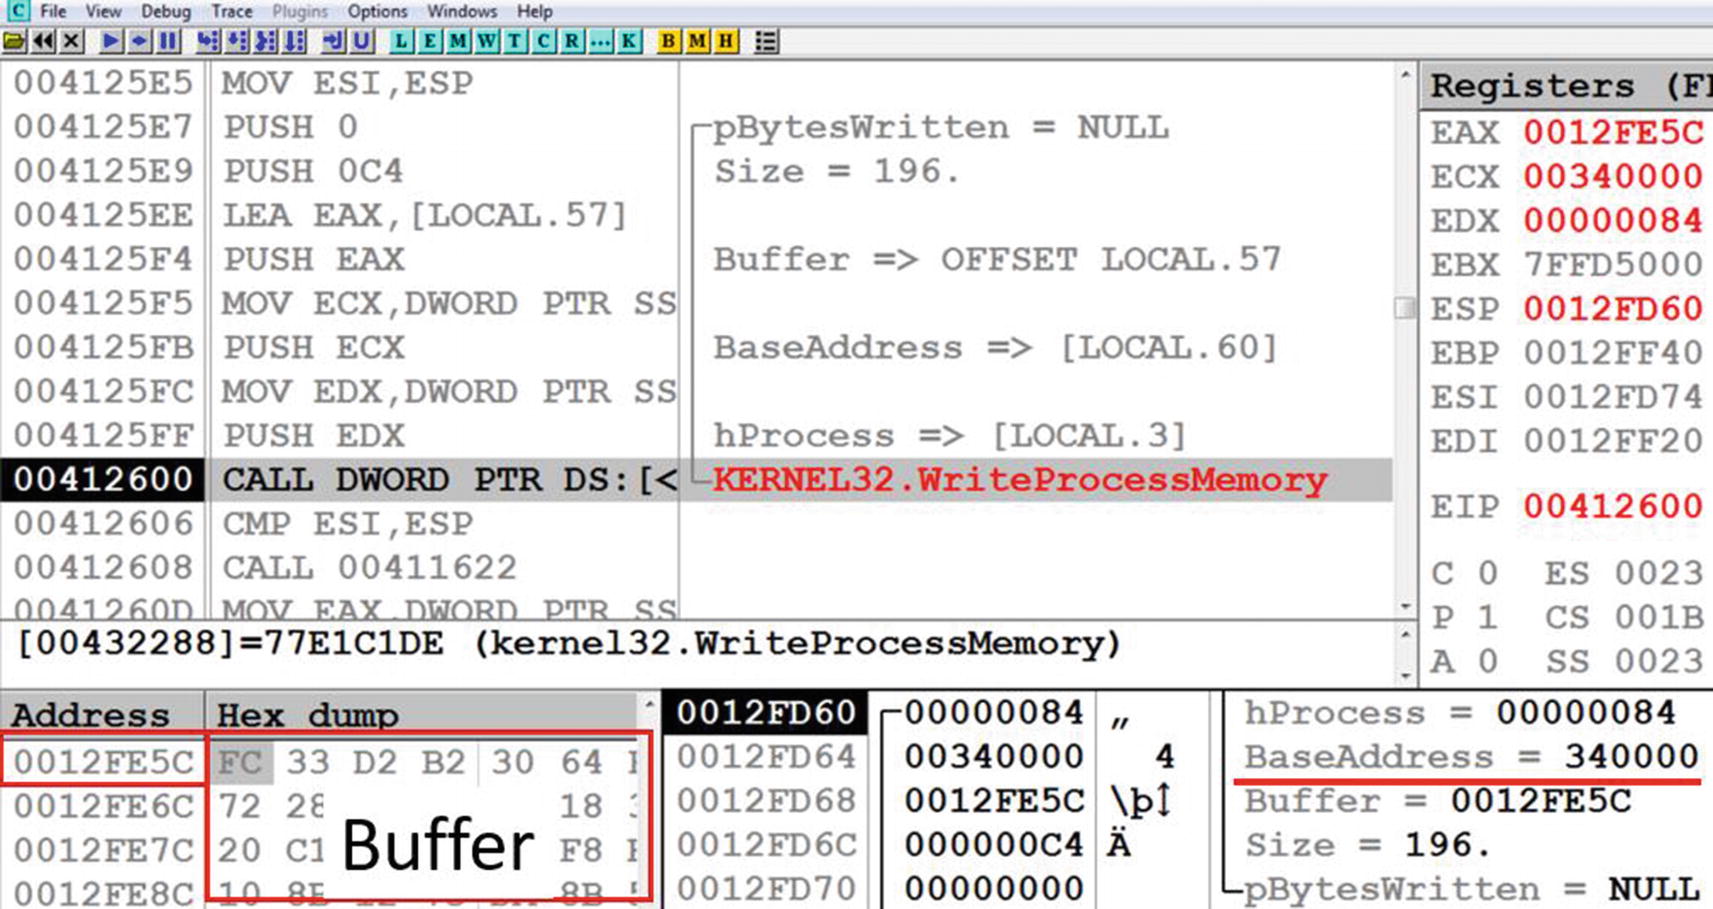
Sample-18-5 call WriteProcessMemory API to inject/copy code into the target process
If you further look at parameters of WriteProcessMemory in the stack, the first parameter is hProcess, which is the handle of the target process, which is rightly 0x84 as we obtained earlier. The next parameter is BaseAddress, which is the address in the target process where the API is going to write the injected code. If you see the value of BaseAddress, it is the one returned by VirtualAllocEx earlier (i.e., 0x340000). The next parameter Buffer holds the value 0x12FE5C, which is an address inside the injector process, which contains the code that needs to be injected into the target process. This buffer contains the code to be injected, and its contents can be seen in the OllyDbg memory window by going to the address, as shown in Figure 18-5.

Using Process Hacker to view the content of the memory allocated in target process where code was injected by the injector process
If you observe the content written to this address, it is the same as the contents of the address pointed by the Buffer parameter of WriteProcessMemory (i.e., 0x12FE5C), as seen in Figure 18-5.
In this sample, there is only one single memory block allocated in the target process, and that code was only copied over once. Hence you see only one call for VirtualAllocEx and WriteProcessMemory APIs. But when you are dealing with malware samples, there are multiple allocations of memory in the target process and multiple data copy operations, which you can easily identify by the multiple calls to VirtualAllocEx and WriteProcessMemory APIs.

CreateRemoteThread invoked by injector process to start a new remote thread in the target process to execute the code it earlier injected
The important parameters in the above API invocation are hRemoteProcess and StartAddress. hRemoteProcess is the process handle to the target process we obtained from the invocation to OpenProcess (0x84). StartAddress holds the address from where the new remotely created thread should start execution, which is 0x340000. From an analysis standpoint StartAddressis what we need and is the injection entry point (IEP) from which the injected code starts executing in the target process.
In this case, this StartAddress is at the start of the injected buffer allocated in the target process. But it need not always be the case, and the address of the first/starting instruction can be anywhere in the injected buffer
Now since we know the address of IEP, we need to find a technique to start debugging from the IEP in the target process. Do not step over or execute over the CALL instruction for CreateRemoteThread API since that execute the remote code, and the execution gets past IEP. We want to be in a position to start debugging right from the IEP instruction location. So do not further debug or execute any more instructions in the injector process Sample-18-1.exe in your OllyDbg instance.
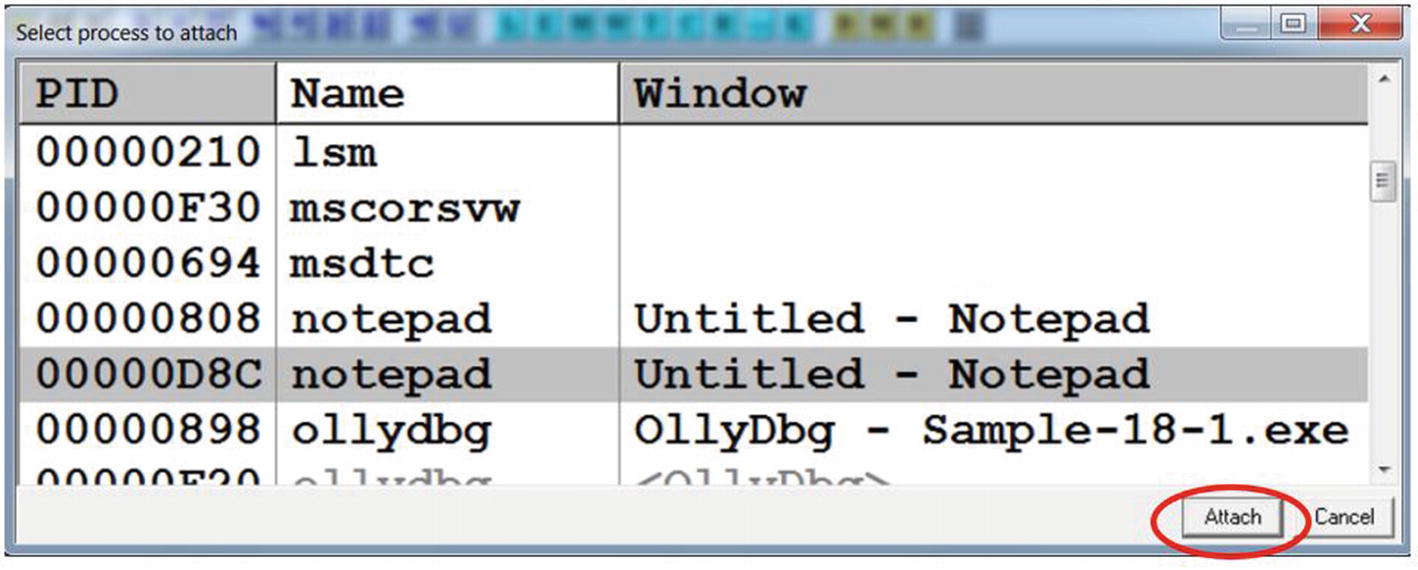
OllyDbg attaching to the target process so that we can debug the injected code
Sometimes debuggers may not be able to attach to the target process in case the target process has been opened for injection or is in a suspended state, as it usually happens with process hollowing. In that case, we need to try out a technique known as the EBFE trick, which we discuss later in this chapter.

Debugging from the IEP by setting the New origin here option in OllyDbg
As seen, now that the disassembler window shows us the code around the IEP, we can start executing it from the IEP instruction by right-clicking the instruction at IEP and choose the New origin here option, as seen in Figure 18-9.
This is the easiest way to start debugging from the IEP. Another option can be to set a breakpoint at the IEP and then go back to the first instance of OllyDbg, which is still debugging the injector process and then execute the CreateRemoteThread CALL instruction where we had halted before. After you execute the CALL instruction for CreateRemoteThread in the injector process, the debugger breaks at the breakpoint set at IEP in the target process. Now you are all set to debug the injected code line by line from the start of the IEP in the target process.
Locating IEP with Thread Context
Another method used by malware to execute code in a target process is by changing the context of a remote thread in the target process. A context of a thread is a structure that can store various information like the state of the registers, entry point of the main module of the process, and so forth. The context of a thread can be altered to change the execution flow of a thread/process.
To alter the context of a thread, the thread should be in a suspended state so that the task scheduler does not alter that context. With the target process’ thread suspended, the injector process retrieves the copy of the target process thread’s context structure by using the GetThreadContext API . Then the local copy of the context structure is altered as per the location of the injected code in the target process. The altered local copy of the context structure is copied back to the target process by using the SetThreadContext API .
Pseudocode to Show How the Context of a Remote Target process Thread Is Alterted
In the code listing, ThreadHandle is the handle to a suspended thread in the target process. The ContextStruct is a copy of the context structure of this remote thread, retrieved with the help of GetThreadContext API. Based on the type of injection used, the Eax/Eip/Rip field in the context structure is altered to point to the IEP located in the injected code in the target process. The Eax/Eip/Rip field in the context structure determines the entry point of the main module of the target process. The SetThreadContext API copies back the altered context structure back to the target process’ thread. The call to the ResumeThread API resumes execution of the suspended thread in the target process from the new IEP set earlier in the ContextStruct.
This kind of technique is commonly found in the process hollowing technique, also known as runpe technique , covered in detail in Chapter 10. Let’s now look at malware Sample-18-2.txt, which contains instructions to download the malware sample, which you can download and rename as Sample-18-2.exe. We reverse this sample to understand how to process hollowing uses the context to set the IEP and how we can debug such samples.

APIMiner logs for Sample-18-2.exe that uses process hollowing and alters the context of the remote target thread to set the IEP and execute the injected code
In the API logs, you can see a call to CreateProcessInternalW API. The API is used here to create a new process in the system but in suspended mode, as identified by its parameter values [creation_flags]4. In the sequence of APIs, NTUnmapViewOfSection unmaps the main module of the target process. Then a new memory region is created in the same memory region where the previous main module was located by using NtAllocateVirtualMemory API. Then this memory is filled/injected with new code using WriteProcessMemory. Then the sequence of GetThreadContext, SetThreadContext, and ResumeThread alters the context to the new IEP and then executes it.

Stack displaying the parameters of CreateProcessInternalW
We have marked some of the important parameters of CreatProcessInternalW in the image. The third parameter is the path of the executable from which the new process is created. This sample executes and hollows an instance of itself. Hence it creates a process out of its own executable. Process hollowing is meant to hide the code inside a system process like svchost.exe. So for most other malware cases, you see a new process spawned against a system program like svhchost.exe. But in this, the malware uses process hollowing to unpack the code inside its own hollowed process.
The next important parameter is the seventh one, which the creation flags. In this case, the value of the creation flags is 4, as we have already seen in the API logs from FIgure 18-10, which says the new process is created in a suspended mode, which is an indication of process hollowing. The eleventh parameter is a pointer to the PROCESS_INFORMATION structure , which is supposed to contain information regarding the newly created process. The structure is filled with information when the new process is created after the execution of CreateProcessInternalW API. Keep a note of the address of this structure since we are parsing it soon, which is 0xFE784.
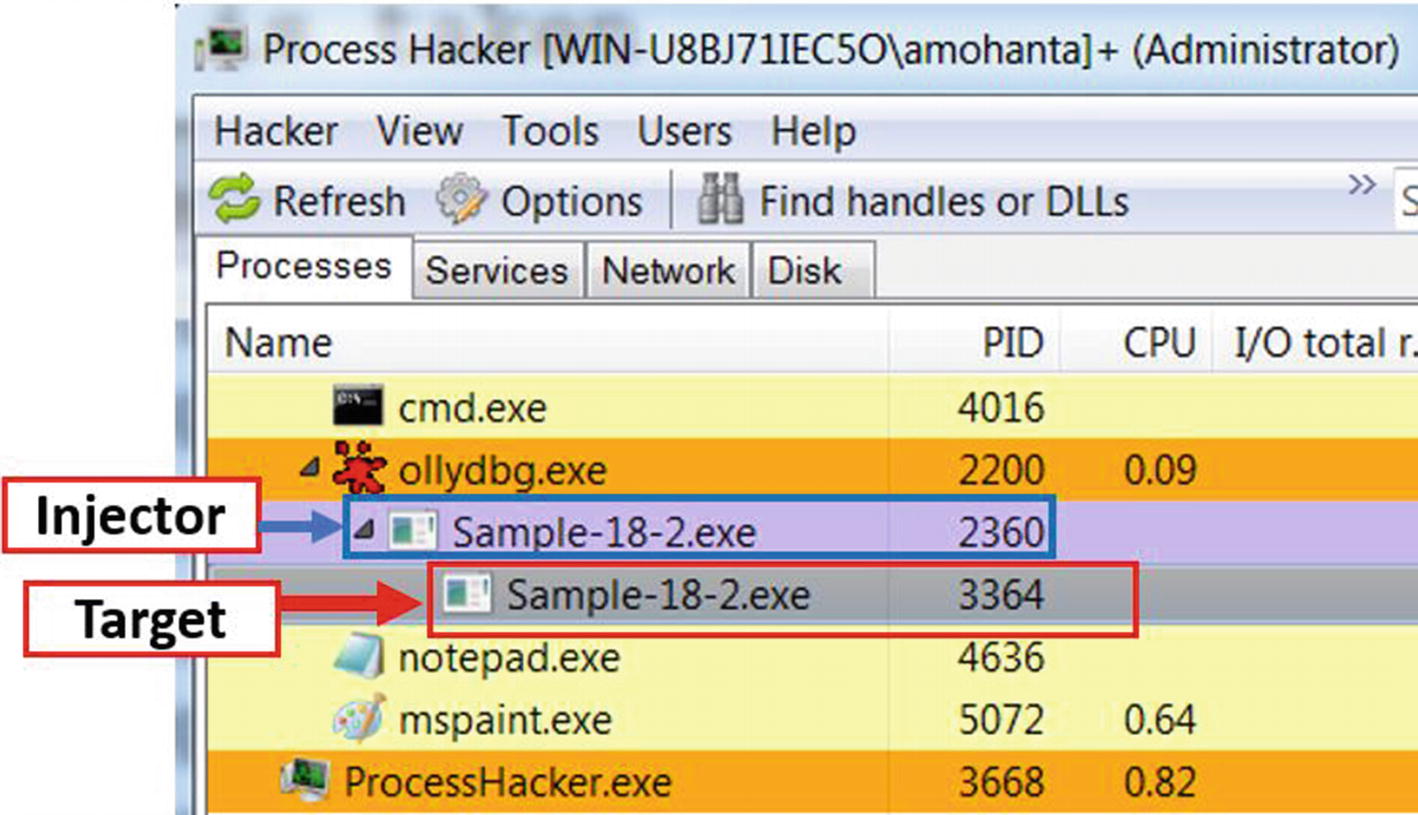
The parent/injector process and the child/target process seen in Process Hacker

Decoding/parsing memory contents as a particular structure using OllyDbg

PROCESS_INFORMATION structure parsed against the structure located at address 0xFE784, which we obtained earlier from the call to CreateProcessInternalW in Figure 18-11
Since this a newly created process, it has a single instance of thread in it. The ProcessID and ThreadID fields indicate the process ID and the thread ID in the newly created target process. The other two parameters, hProcess and hThread, are the handles to the suspended process and the thread in the target process, respectively. Note these handle values 0x9c and 0x98, as you see that these handles are used in subsequent API calls GetThreadContext, SetThreadContext, VirtualAllocEx, WriteProcessMemory, and so forth.

GetThreadContext API invoked by Sample-18-2.exe to get the thread context
As you can see, the GetThreadContext API takes two parameters, hThread holding value 0x98, which is the handle to the thread for which the context structure should be retrieved, which we earlier obtained and noted by parsing the PROCESS_INFORMATION structure in Figure 18-14. The other argument is pContext, which is the address of the local buffer that stores the context of the thread from the target process. The fields in pContext are filled after execution of the API. Note the address value of pContext so that we can parse its contents after execution of the API. The value of this pContext argument for us is 0xFE024, as seen in the screenshot.
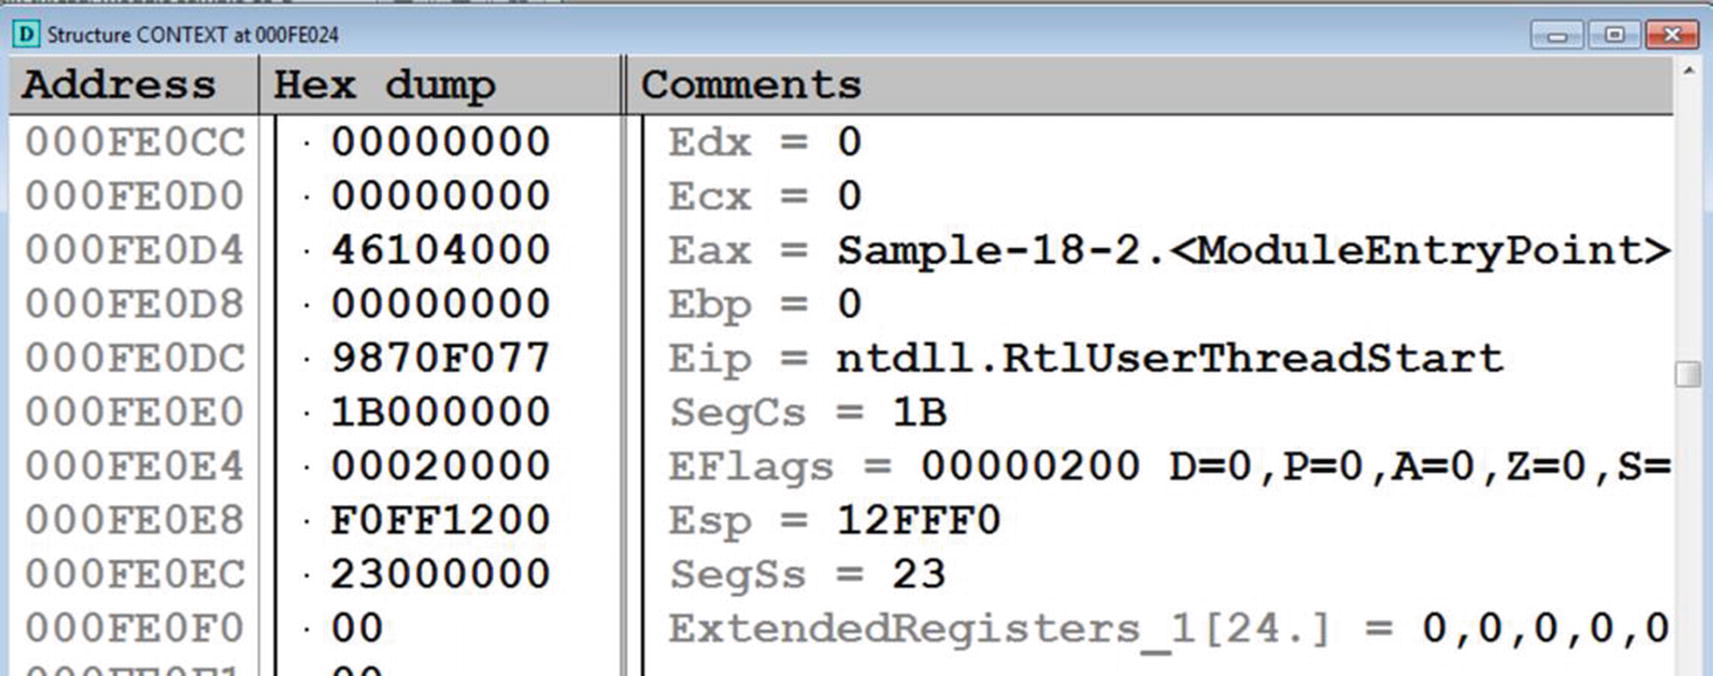
The pContent argument at address 0xFE024 parsed as CONTEXT structure using OllyDbg
Next in the set of API calls, as seen in Figure 18-10, we see a couple of NtAllocateVirtualMemory(VirtualAllocEx), NtUnmapViewOfSection and WriteProcessMemory, which are all steps in process hollowing process, all of which allocates new memory in the target process and injects/copies code into it. Step over through the code until you cross through these APIs and have a look at its arguments.

SetThreadContext API invoked, to set the IEP in the target process to point to the injected code

CONTEXT structure now altered to point to the IEP passed to SetThreadContext
The malware code preceding the CALL to SetThreadContext API alters the contents of the context structure. For verification, you can compare the fields of the structure with which we retrieved after executing GetThreadContext, as seen in Figure 18-18. The Eax field in the structure in Figure 18-1 is 0x46104000. In Figure 18-18, it has been altered by the malware to point to the IEP 0x41EF20.

Process Hacker dumps the PE header of the target process’s main module

PE Header from the dumped target process as seen in CFF Explorer
The next API invoked by the sample is ResumeThread, as seen in the API logs in Figure 18-10, which now resumes the suspended thread, which ends up executing the injected code from the IEP.

Debugging the injected code at the IEP in the target process
The EBFE Trick
In the examples shown earlier, we stopped debugging in the injector process at the CreateRemoteThread API in Sample-18-1.exe and at ResumeThread in Sample-18-2.exe, after which we attached a new instance of the debugger to the target process. Sometimes it can happen that the debugger is not able to attach to the target process mostly for cases where the target process is in a suspended state. How do we get around this problem where we can’t attach to the target process, but we need to still attach to it somehow and debug it using the debugger?
Let’s explore a technique called the EBFE technique that can help us to take control of the situation. The technique patches bytes in memory of the target process by using a tool like Process Hacker. We can patch the bytes at the calculated IEP to the hex machine code value EBFE. You will soon see the meaning of these bytes and how they are useful in debugging the target process and its injected code.
To explore the technique, let’s use Sample-18-1.exe and debug it up to the instruction that CALLs CreateRemoteThread API. It is after this point where we had earlier attached the target process to a new instance of OllyDbg debugger in our earlier analysis.

Patch the code at IEP in the target process to EBFE using Process Hacker
After editing these instruction code bytes in the process, we need to press the Write button that writes the edited contents back to the process’s memory.
Now come back to the OllyDbg/debugger instance for the injector process, and you can continue debugging it and execute/run over the CALL instruction to CreateRemoteThread API or even run/execute the complete injector process. If the injector process has a handle to the target process, it releases the handle. If the target process was earlier in a suspended state like in Sample-18-2.exe, it is now an active process.

Threads in the target process after inserting EBFE and continuing its execution
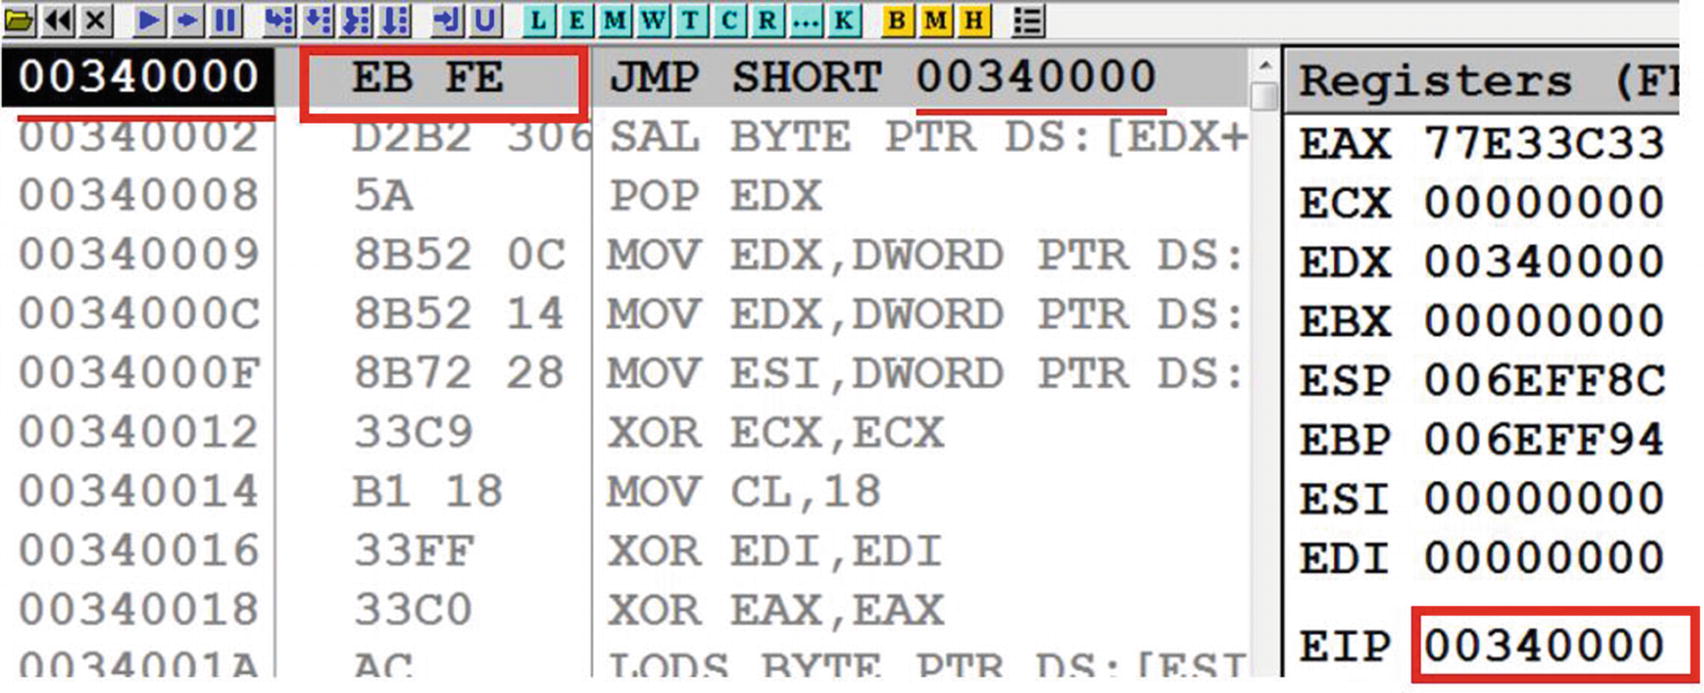
The IEP in the target process, as seen in OllyDbg that shows our EBFE code being executed by the target process thread.
If you look at the bytes of the first instruction, it is EBFE, which is the one we inserted and patched earlier. You see these instruction bytes EBFE in assembly means JMP 0x340000, which is its own address, or in other words, JMP <to_itself>. The jump instruction is a loop to itself and continues executing itself without moving forward to the next instruction. If this instruction was not there, the complete injected code would have been executed from the IEP, and we could not have got a chance to debug the injected code in the target process from the IEP. But since the first instruction EBFE, which we patched at the IEP, is busy looping over itself, we get a chance to attach to the target process and still debug from the IEP. Now we can patch the original bytes FC 33 in place of EB FE and then continue executing step by step from here.
Summary
Code injection is a common functionality used by most malware, a technique we discussed and explored in detail in Chapter 10, but from a dynamic analysis perspective. In this chapter, you learned how to attack the same problem but from the point of view of a reverse engineer. In this chapter, you learned how to locate the injected code using OllyDbg debugger. We covered how to locate the IEP in the target process, which is the first instruction in the injected code that is executed. You learned various techniques to debug this injected code from this IEP instruction address by using two different use-cases. We also covered the EBFE trick that helps us cover cases in which debugging a code injected target process may not be possible using the normal attach to process option in debuggers. With the techniques learned in this chapter, you can debug any code injection technique used by any malware that you come across.