
In previous chapters, we talked about malware dissection using static and dynamic analysis using different kinds of tools. Every tool and method has its pros and cons. You might conclude about a sample by performing a static analysis without even having to go for dynamic analysis. But there are chances where dynamic analysis may fail, and then you have to go for reverse-engineering the sample. Alternatively, you can also go for another technique called memory forensics, where you have a chance to analyze and determine if a given sample is malware or not without going for complex reverse engineering techniques. This chapter talks about how we can analyze and dissect malware using Volatility, a well-known memory forensics utility.
What Are Memory Forensics?
When malware executes, it can create certain processes, files, registry entries, install rootkits, and so forth. These malware artifacts can sometimes be destroyed by the malware so that an analyst can’t detect them and thereby figure out the presence of the malware. For example, a malicious process may terminate after code injecting into a legitimate process. Or a temporary file created by malware is deleted after it’s used. Using forensic techniques, you can retrieve this kind of information and data, although it was destroyed by the malware, thereby enabling us to identify malicious activity.
To perform forensics, you need two kinds of data: volatile and non-volatile. Non-volatile data is the data that is stored on a hard disk or permanent storage and is available even if the system is shut down. Non-volatile data can be retrieved from the hard disk. Volatile data is stored in the RAM or other transient memory. Volatile data is lost after the computer is powered off. Forensics involves the acquisition of data—both volatile and non-volatile—from a system and then working on the data offline. What we mean by offline is that you can obtain this data from a system and analyze this extracted data on any other computer without the presence of the computer whose data you extracted.
When we specifically talk about memory forensics, it involves the acquisition of the volatile data, which is the content in the physical RAM (see Chapter 4). The acquired volatile data is also called a memory dump .
Presence of rootkits and API hooking
Terminated processes
Files being used by the processes at the time of data dumping/acquisition
Registry entries created
Terminated network connections
Do note that you won’t be able to extract information from all the files used by a process in the memory dump, as it is not possible to store the entire file system in memory. You can only retrieve information on files that are currently in use by a process, or to use a technical term, you can say files that a process has open handles to.
Why Another Technique?
This is probably the most notable and useful need for memory forensics. As a part of an incident response team, if you are called to investigate an existing malware infection in a computer, the malware might have finished execution or carried out most of its tasks. You have now missed your analysis window to run tools like ProcMon, Wireshark, Process Hacker, and so forth. In such cases, memory forensics can be extremely helpful, and you can reconstruct the sequence of events inflicted by the malware.
Identifying code injection by malware with tools like APIMiner is super easy. But the same might be a lot harder if you rely on ProcMon and Process Hacker. As with APIMiner, the task is easy with a memory forensic tool like Volatility.
A lot of malware has anti-analysis armoring features that detect the presence of analysis tools like ProcMon, Wireshark, OllyDbg, Process Hacker, and so forth. On detecting their presence, the malware might exit or exhibit benign behavior to fool any analysis. By using a separate memory forensics VM with no analysis tools installed, you can now run malware, extract a memory dump on this VM, and analyze the dump to figure out the malware’s events and intentions, thereby circumventing any anti-analysis armoring by the malware.
For malware that provides a kernel-mode rootkit driver, it has been observed many times that while using a rootkit scanner, the system might crash. The reason may be due to the changes caused in the kernel by the malware, or it can be buggy kernel drivers from the scanners we use. Instead of using a scanner, taking a memory dump and using it to analyze the kernel data structures for any injected rootkits can be helpful.
Each tool has pros and cons. Sometimes you need a combination of tools and techniques to derive a conclusion from your analysis. It is also advisable to cross-check the output of various tools. Volatility, the memory forensic tools which we are going to use in this chapter, is a one-stop tool using which you can verify right from code injection to API hooking and rootkits.
Memory Forensics Steps
Memory acquisition
Memory analysis or forensics
The first step, memory acquisition , involves capturing the contents of the RAM using a memory capture tool, which creates a memory dump file. The second step, memory analysis or forensics, involves an analysis of this memory dump file obtained from the first step. In the next set of sections, let’s go through how to carry out both steps to analyze and identify malware.
Memory Acquisition
FTK Imager
Ram Capture
DumpIt
Ram Capturer
Memoryze
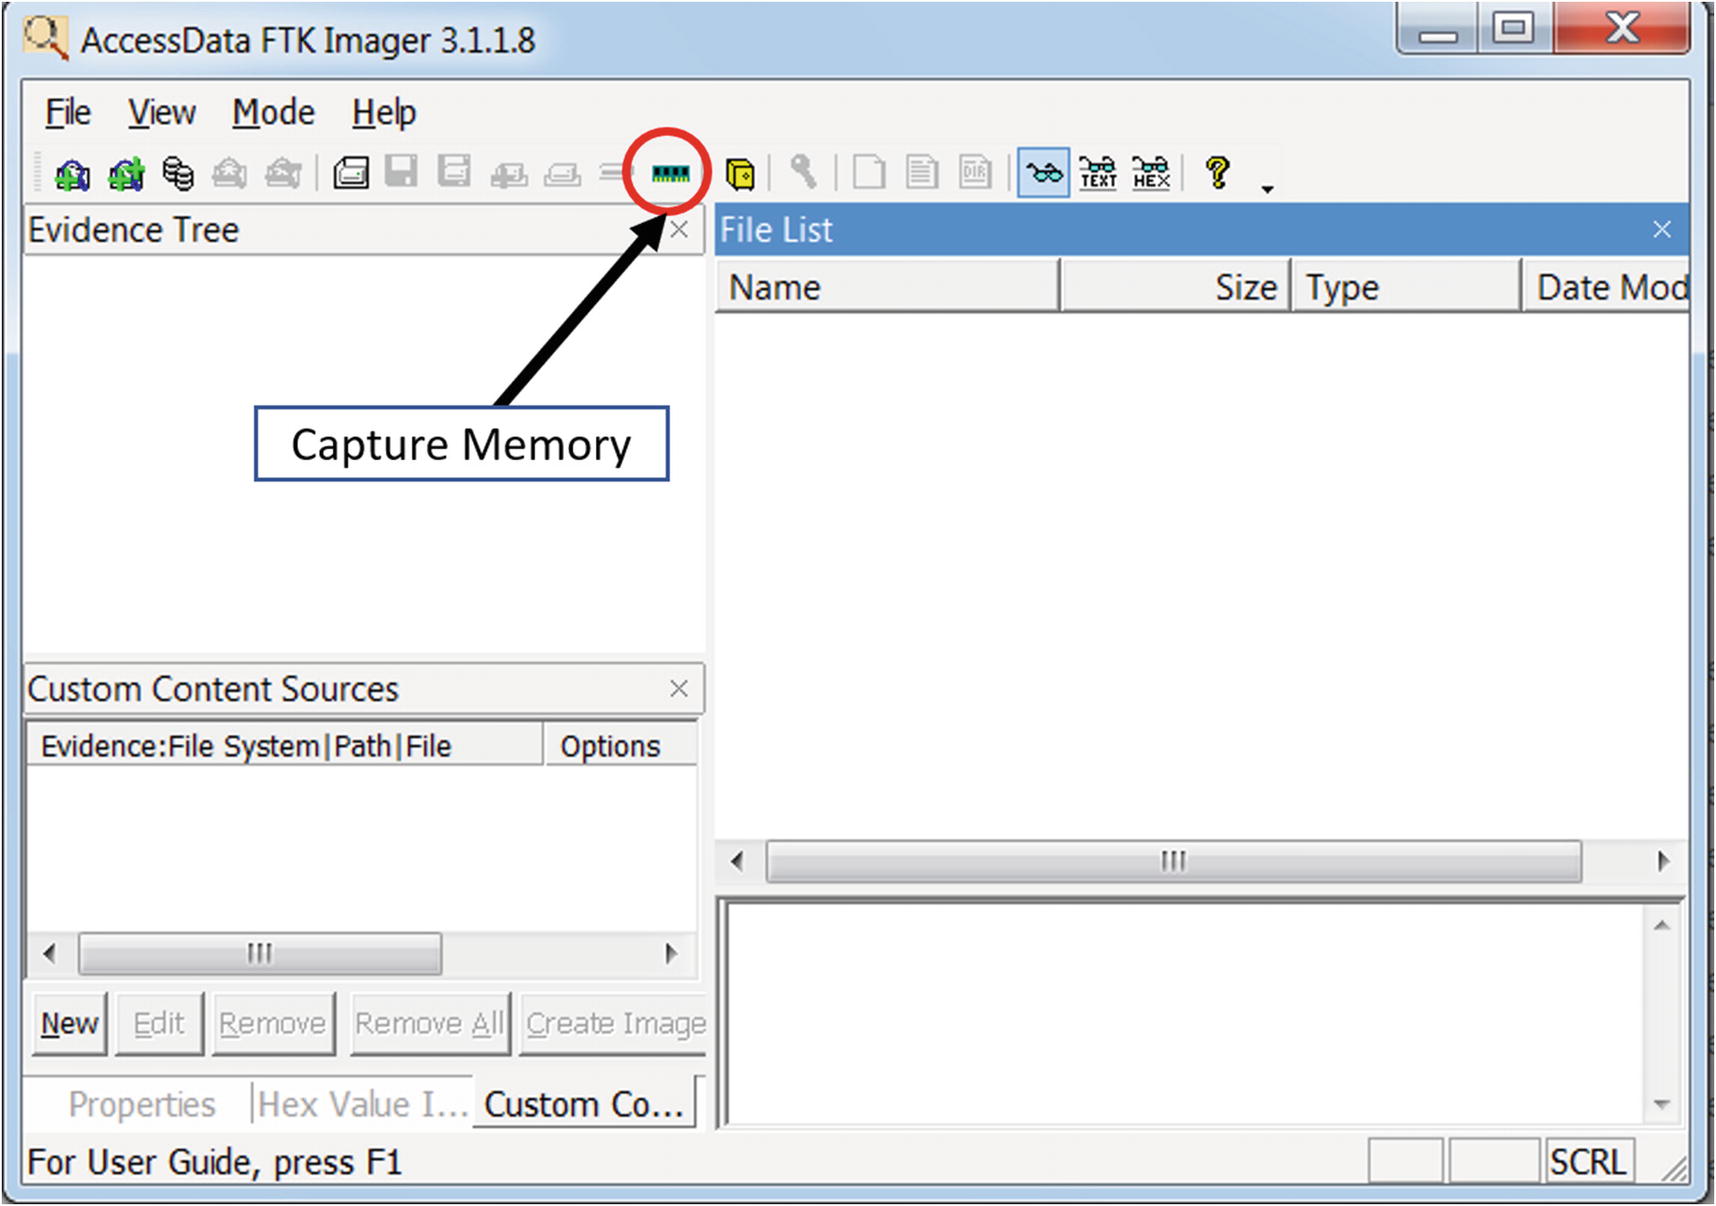
FTK Imager Lite tool to create a memory dump
You can create a memory dump by clicking the Capture Memory button. As an exercise, use this tool to capture a dump of your analysis VM. Once the dump is created, verify the presence of the dump file on the disk and also its size.
The memory dump file created has a special file format that can be understood by memory forensics tools. To analyze our dumps, we used a well-known open source memory forensics tool called Volatility. But before we get to use Volatility, let’s run some malware samples and create/download some memory dumps that we can dissect.
Sample-14-1.mem
Our first malware sample is Sample-14-1 from the samples repo, where it is named Sample-14-1.txt because it is a text file that holds the instructions that you need to follow to download the real malware sample.
Run Sample-14-1.exe inside your analysis VM for a minute or so, and then using the FTK Imager tool, create a memory dump.
We have already done the dirty work for you. We ran the malware Sample-14-1.exe in our analysis VM, created a memory dump called Sample-14-1.mem, and uploaded it for you to download directly. The URL link to download this dump file can be obtained from the file Sample-14-1.mem.zip.txt.
Creates a new PE executable file at C:Users<user>AppDataLocalsbjgwpgv.exe
Creates a new registry key called lrxsmbwu at HKCUSoftwareMicrosoftWindowsCurrentVersionRun with a value of C:Users<user>AppDataLocalsbjgwpgv.exe
Creates a new process svchost.exe in suspended mode and inject code into it using process hollowing. Various unpacked strings can be seen.
Creates a mutex named 2gvwnqjz1.
If you run the malware sample and generate a memory dump, the artifacts that you see may be different from what we listed.
Sample-14-2.mem
Similar to our previous dump Sample-14-1.mem, you can generate the dump by running the malware Sample-11-7-ssdt-rootkit and then using FTK Imager, create your own memory dump. Or you can download the memory dump that we generated and uploaded, which you can download from the URL specified in Sample-14-2.mem.zip.txt.
From the dynamic analysis we have conducted on Sample-11-7-ssdt-rootkit.exe, a notable artifact we discovered is that it installs a rootkit by inserting a kernel module rootkit.sys which then hooks the NtQueryDirectoryFile and NTCreateFile service functions in the SSDT.
Sample-14-3.mem
This dump was taken when downloading a file using Internet Explorer from www.softpedia.com/get/Internet/Browsers/Internet-Explorer-11.shtml. The sole intention of this dump is to help you to understand how to dissect and identify network connections using Volatility. The URL to download this dump is located in the file Sample-14-3.mem.zip.txt in the samples repo.
All the memory dumps generated in Sample-14-1.mem, Sample-14-2.mem, and Sample-14-3.mem have been taken on a fresh baseline snapshot of our malware analysis VM. What this means is that we executed the malware sample and then dumped the memory using FTK Imager. We then reverted the analysis VM to the baseline snapshot before executing the next malware and taking the memory dump again.
Memory Analysis/Forensics

systeminfo command to obtain information about the system
The operating system is Windows 7, the version is Service Pack 1, and the processor type is X86. These information bits can be combined and represented with a single notation Win7SP1x86, and we can call it ImageInfo. We use the ImageInfo in our various Volatility tool commands later, and whenever you see <ImageInfo> in the command, replace it with the notation you generated for your system, which in our case is Win7SP1x86.

Directory structure we are following for our exercises

Volatility help output shows various options provided by the tool for analysis

Redirecting the output of Volatility tool to a text file using the >> operator

The redirected output in Figure 14-5 can be viewed using Notepad++ editor
The screenshot displays the list of commands provided by the tool. Now Volatility commands are made available by the tool through plugins. Standalone vanilla Volatility displays only those commands which form the core Volatility plugins. For additional plugins, you need to use the plugin options. In the next few sections, we discuss some of the important Volatility plugins.
Volatility Command Format
Standard Volatility Command Format
The -f option specifies the entire path to the memory dump file that we are analyzing. The --profile option requires ImageInfo, which we derived earlier section (i.e., Win7SP1x86). You can also double confirm the value of ImageInfo by using the Volatility imageinfo command, as you learn shortly.
Some of the commands provide the option to extract the modules’ memory and files out of the memory dump. The extracted data can be dumped to files in a directory we specify using the -D <dump_directory> or --dump=<dump_directory> option.
Also, note that some of the commands or plugins are specific to a memory dump belonging to a particular type of ImageInfo. A command that works for Windows XP memory dump may not work for Windows 7 memory dump and vice versa. So you should always refer to the manual of the commands. You can refer to the commands in the Volatility wiki located at https://github.com/volatilityfoundation/volatility/wiki/Command-Reference.
Image Information

The various ImageInfos/Profiles suggested by Volatility for Sample-14-1.mem
The imageinfo command displays a lot of information about the memory dump. KDBG search is the technique used by Volatility to extract information about the dump. It also displays us the time when the memory dump was taken. But the most important information we should be concerned about is the suggested ImageInfos, which are displayed as Suggested Profiles(s). As seen, the command displays two possibilities for ImageInfo: Win7SP0x86 and Win7SP1x86. We need to select one of the two ImageInfos for the rest of the commands against Volatility for this specific dump. We go with the value of Win7SP1x86 as it matches the same value we derived earlier in this chapter with the systeminfo command in Figure 14-2.
In the next set of sections, let’s explore the commands one by one and analyze our memory dumps.
Listing Processes and Services
Some Volatility Commands to List the Various Processes in the Memory Dump
Command | Description |
|---|---|
pslist | Lists processes on system from which dump was taken |
pstree | Displays process list with tree view |
psscan | Lists killed and hidden processes |
psxview | Displays processes using various techniques |
svcscan | Lists installed services |
pslist
The Command Line for pslist Command on Sample-14-1.mem Memory Dump
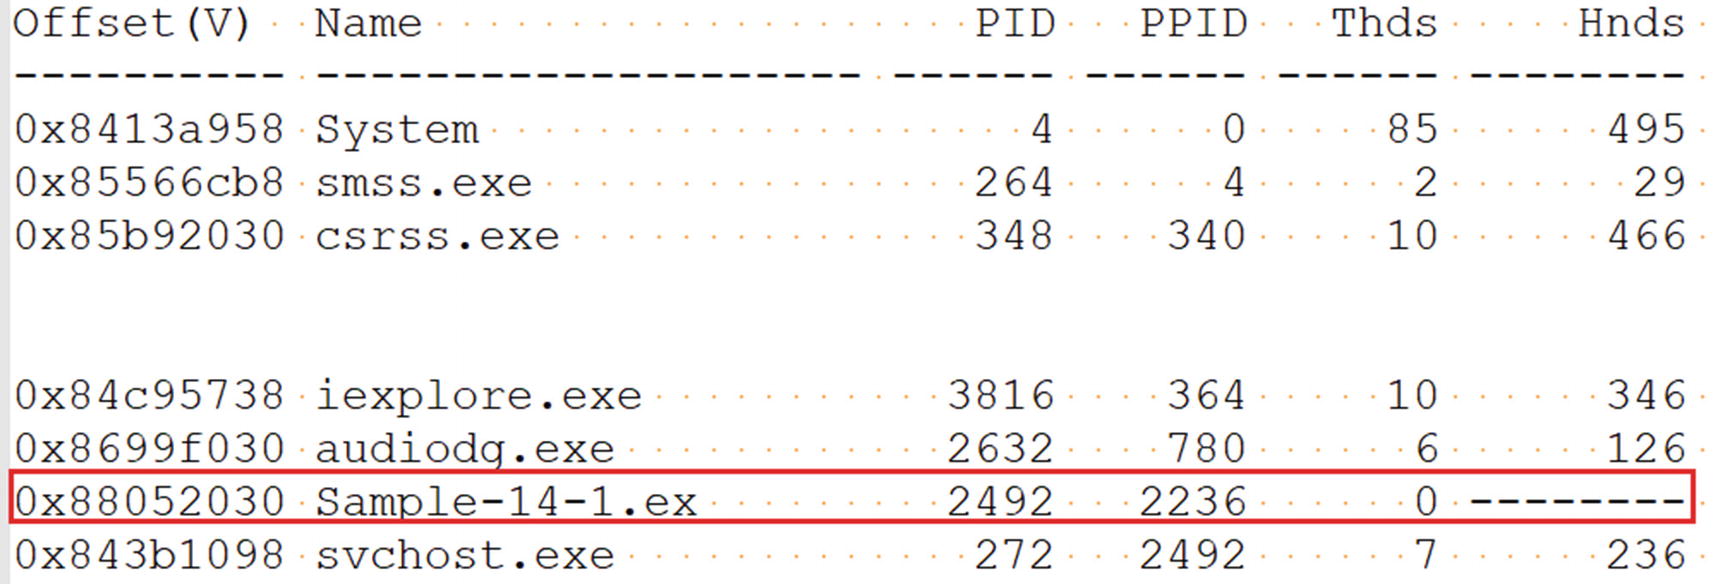
The output from pslist command against Sample-14-1.mem memory dump
Offset: The address of the EPROCESS structure
Name: The name of the process
PID: The process ID (PID)
PPID: The PID of the process’s parent process
Thds: The number of threads in that process (it is 0 if the process terminated on the system at the time the dump was extracted)
Hnds: The number of open handles in the process
Sess: The session ID
Wow64: Holds the value 1 if the process is 64-bit, 0 if 32-bit.
Start: When the process was created
In the section in which we downloaded/extracted the memory dump Sample-14-1.mem file, we explained that we extracted this memory dump from the system after we ran the malware Sample-14-1.exe. As you can see in the screenshot, the Sample-14-1.exe malware sample process with PID 2492 has terminated because the number of threads is 0.
pstree
The Command Line for pstree Command on Sample-14-1.mem Memory Dump
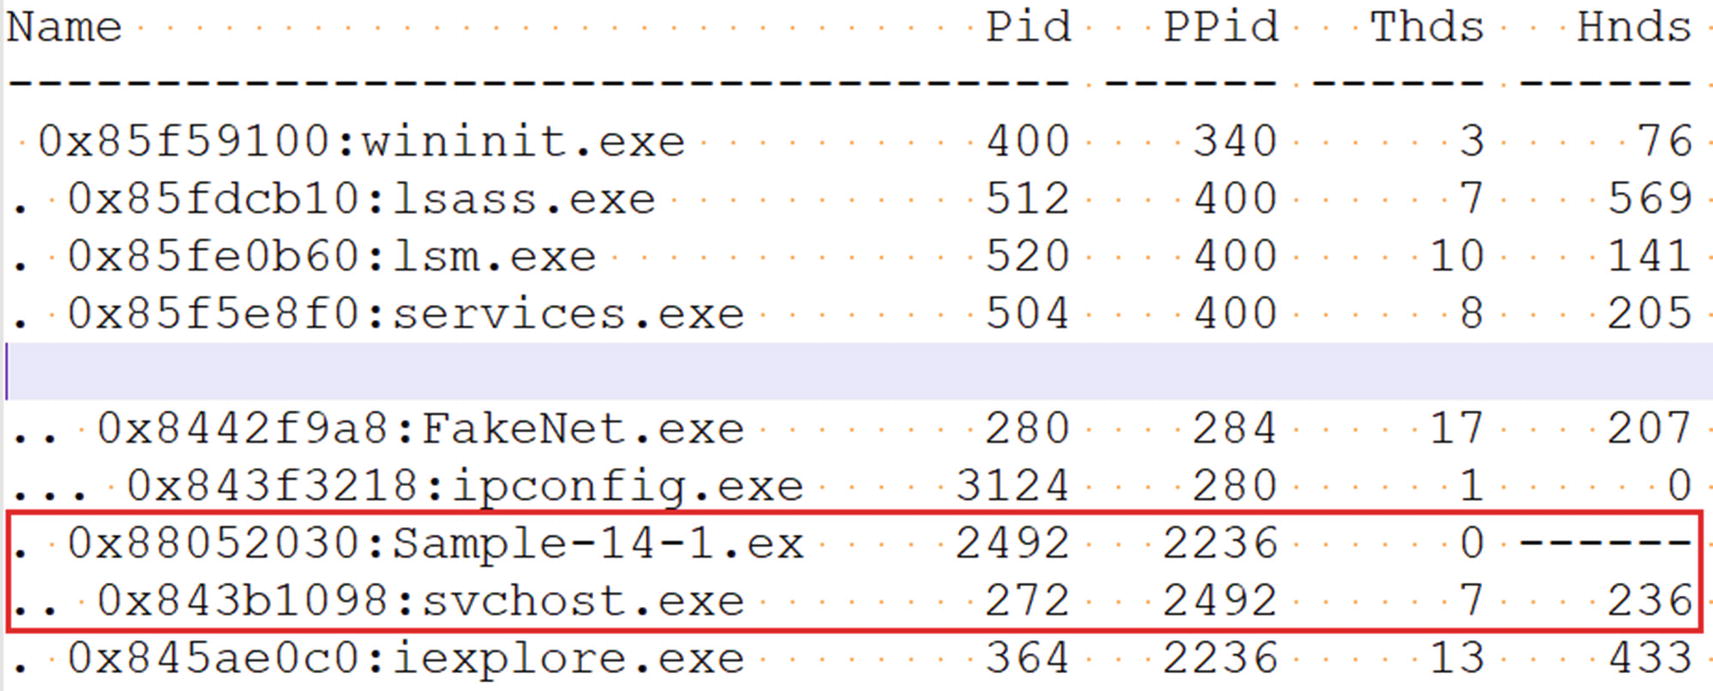
The output from pstree command against Sample-14-1.mem memory dump
Do you see anything suspicious here? The process svchost.exe with PID 272 is a child of our malware Sample-14-1.exe process. svchost.exe is a system process whose parent process usually is services.exe. The fact that some other process is its parent is enough to raise a red flag that Sample-14-1.exe is malware and that it has created a child process svchost.exe for the sake of some kind of stealth, probably involving code injection.
psscan
The Command Line for psscan Command on Sample-14-1.mem Memory Dump
psxview
The Command Line for psxview Command on Sample-14-1.mem Memory Dump

The output from psxview command against Sample-14-1.mem memory dump
There is another command, svcscan, which we haven’t tried in our exercises. We strongly suggest you try it out to check the output.
Virtual Memory Inspection
The memory dumps we acquired contains the entire contents of the RAM at the time of memory acquisition. A lot about virtual memory is present in the memory dumps. You learned the importance of virtual memory in previous chapters, where we used its contents for string analysis to analyze unpacked contents of a malware process, injected code, and so forth.
Windows assigns a structure called the VAD tree for every one of its processes. A VAD tree structure is made up of multiple nodes, which are again structures. Each structure contains information about a virtual memory block used by a process (see Chapter 4). The structure contains the memory block’s permissions and size, and so forth. All these structures combined make up the VAD tree, which is what we view from a high-level using Process Hacker.
Some Volatility Commands to List the VAD Tree and the Memory It Points To
Commands | Description |
|---|---|
vadinfo | Information about VAD tree nodes, including memory blocks, address range and their page permissions |
vadree | Displays tree view of the VAD tree |
vaddump | Dumps the contents of the virtual memory pages |
vadinfo
vadinfo Command on Sample-14-1.mem memory Dump to View Its vad Tree
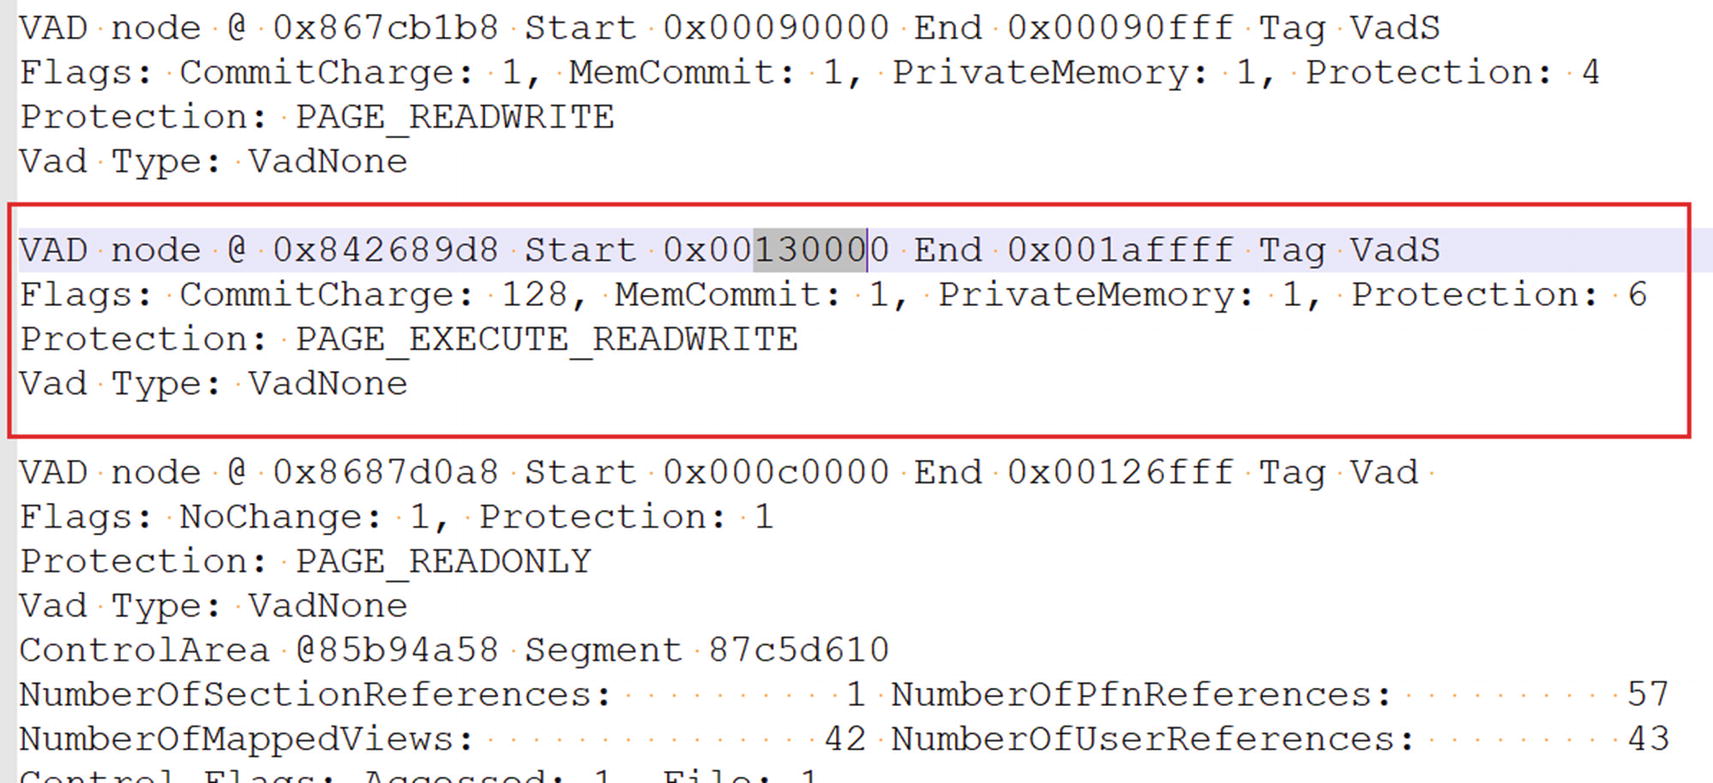
The output from vadinfo command that lists the vad tree for svchost.exe process
Start: The start address of the memory block
End: The end address of the memory block
Flags: Indicates the state of the pages in the block (e.g., if the pages are PRIVATE and in COMMITTED state)
Protection: Indicates the page permissions, (e.g., PAGE_EXECUTE_READWRITE)
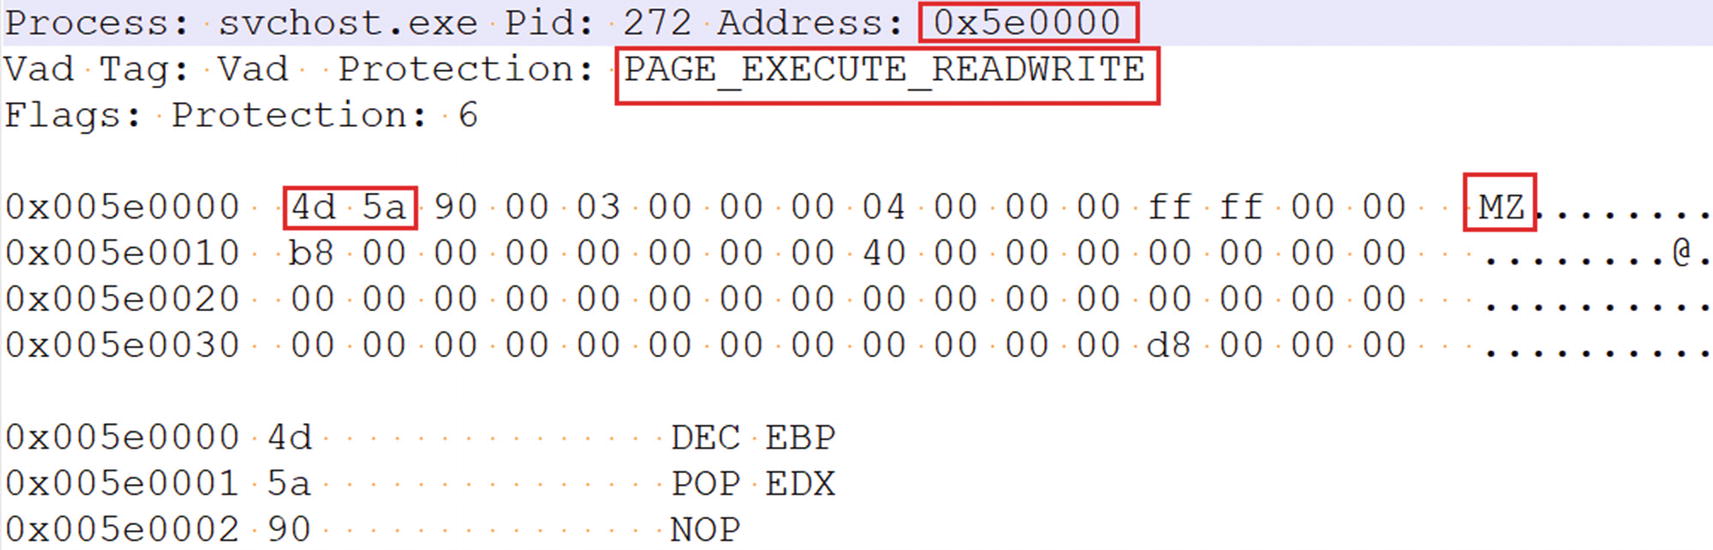
Do you see anything suspicious in the nodes for this process? As seen in the screenshot, we have highlighted the node, which does seem suspicious. As you can see in the highlighted memory block, it is PrivateMemory and has PAGE_EXECUTE_READWRITE(RWX) permission. In Chapter 10, you learned that these pages, which are both PRIVATE and have RWX permissions, have been allocated for code injection. The memory block from this VAD node makes a good candidate for further investigation.
vaddump
The vaddump Command to Dump the Memory Contents of Process PID 272 of Sample-14-1.mem

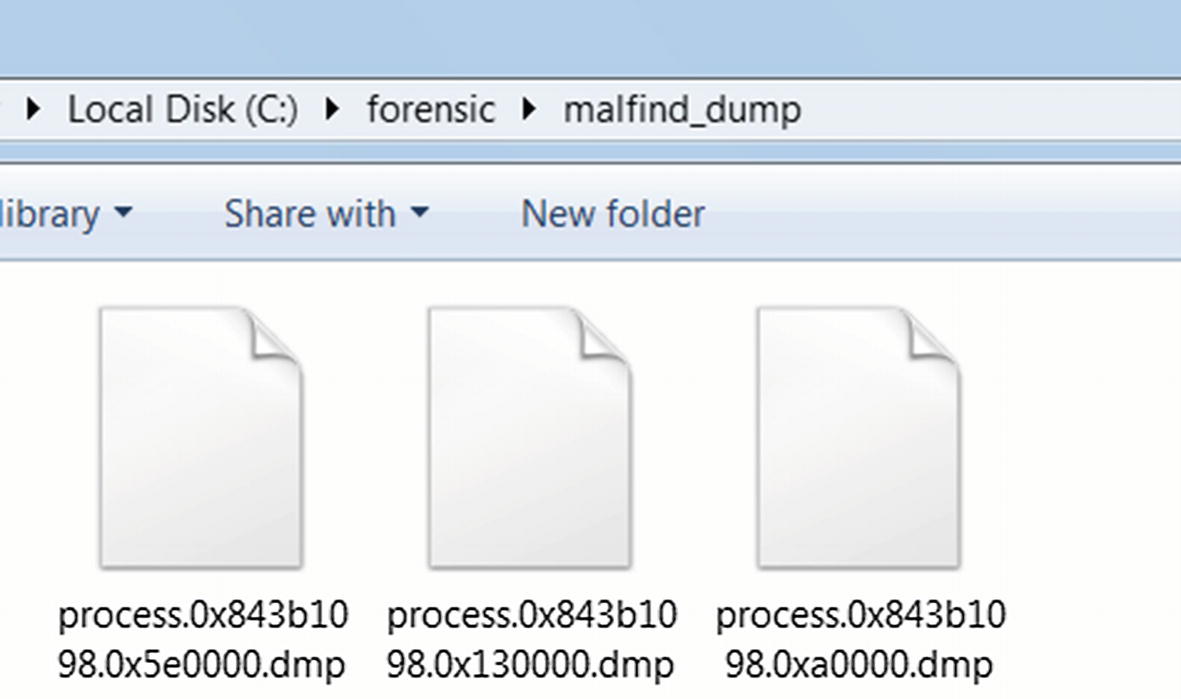
The memory contents dumped into various files using the vaddump command
You can also see that the memory block for the suspicious node we identified in Figure 14-11 has been dumped as well. As an exercise, go through the contents of this specific dump file by using the static string analysis tool BinText, as well as through all the other dump files and note down any suspicious strings that identify the malware and maybe even its type and family. Also, keep an eye out for deobfuscated strings like For base! that we obtained from our earlier dynamic analysis using Process Hacker and String Analysis.
Other Memory Analysis–Related Volatility Commands
Command | Description |
|---|---|
memmap | Shows mapping between physical and virtual memory |
procdump | Dumps the main executable process module |
memdump | Extracts all memory resident pages |
Listing Process Modules
In the last section, you saw different ways to list processes. We were able to list the contents of a process’s memory using various memory dumping commands like vaddump.
Commands That List and Dump the Modules of Processes
Command | Description |
|---|---|
dlllist | Lists the DLLs in a process’s memory |
dlldump | Dumps the memory contents of the DLLs to the disk |
ldrmodules | Displays hidden modules |
dlllist
dlllist Volatility Command to List All the Dll Modules Across All Processes
dlllist Volatility Command to List DLLs of a Specific Process Using the -p Option
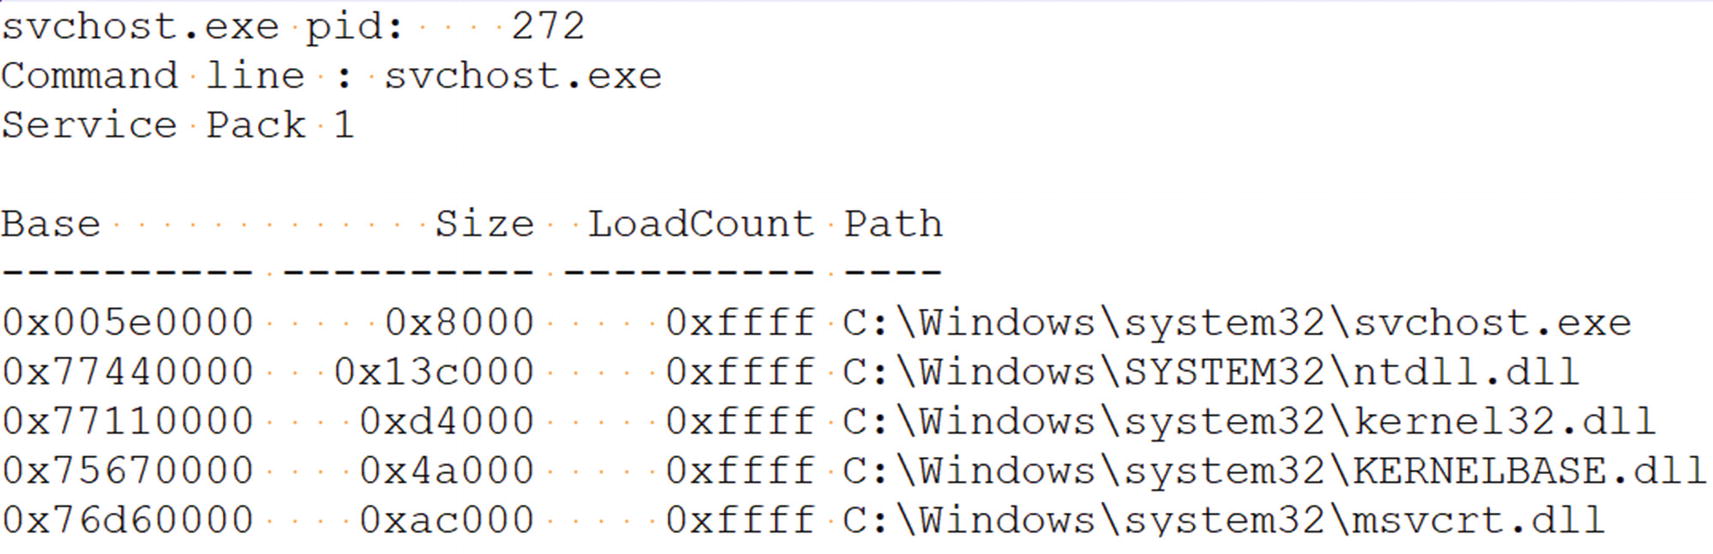
The DLLs listed by the dlllist command for our suspicious svchost.exe process
Base: The start address of the module.
Size: The size of the module.
LoadCount: The number of times a module is loaded and unloaded using Loadlibrary() and Freelibray(). The default value is
–1, which you can see in hex as 0xffff.
Path: The path to the module’s DLL file on the disk
dlldump Volatility Command to Dump the Memory Contents of DLLs to the Disk
For our Sample-14-1.mem memory dump, did we find anything suspicious through the dlllist command? Not yet. But with dlldump command and BinText we possibly can find some malicious strings. Earlier, we had a hunch that svchost.exe was likely to be the target of process hollowing by our main malware process Sample-14-1.exe. Let’s see if we can find related hints to confirm this.
ldrmodules
ldrmodules Volatility Command to List All DLLs Hidden or Otherwise

All the modules hidden or otherwise listed by ldrmodules for our suspicious svchost.exe process
The fields in the command output are similar to those in the output for the dlllist command in Figure 14-13. The InLoad, InInit, and InMem fields indicate the presence of the module in memory. The MappedPath field indicates if the module has a file on disk. Using these new fields, you can identify if some form of code injection was used or not.
Do you see in the screenshot that the InInit field is set to False and MappedPath field is empty because it could not find the svschost.exe module file path on disk. Don’t you think it is suspicious? Can you connect it to any malicious technique? The values for these two fields indicate that the svchost.exe module has been unmapped from the memory. We explained that the Sample-14-1.exe malware—against which we created this dump—creates a new process, svchost.exe, in a SUSPENDED state. Does it ring a bell?
All the hints point to process hollowing, where a malicious process launches another process in SUSPENDED state, in this case svchost.exe and unmaps the sections/modules in the svchost.exe process and maps its malicious code. You see the same hints for unmapping the modules in the ldrmodules output.
Listing Handles
There are several resources in the operating system which are represented as objects. Process, mutex, threads, files, semaphores, memory sections—everything can be treated as an object. An object you can consider as a form of metadata to represent that particular resource. A process or the kernel which needs to manipulate these resource objects first needs to do so through obtaining a handle (a kind of reference) to the object. The handle to an object is considered open if a particular process is still using it, in which case the handle stays in memory.
The handles Command to List All the Open Handles for Our svchost.exe Process

The open handles in our malicious svchost.exe process from Sample-14-1.mem
Offset: The virtual address of the handle object
Pid: The PID of the process that has the handle
Handle: The unique number/value to reference this handle
Access: The permissions to the handle
Type: The type of the object for which handle is open
Mutant
Thread
Key
Section
Directory
File
Process
Driver
Device
Volatility Command to Specifically List All Handles Belonging to a Specific Type
mutant
Volatility handles Command to Specifically List All Mutant Handles
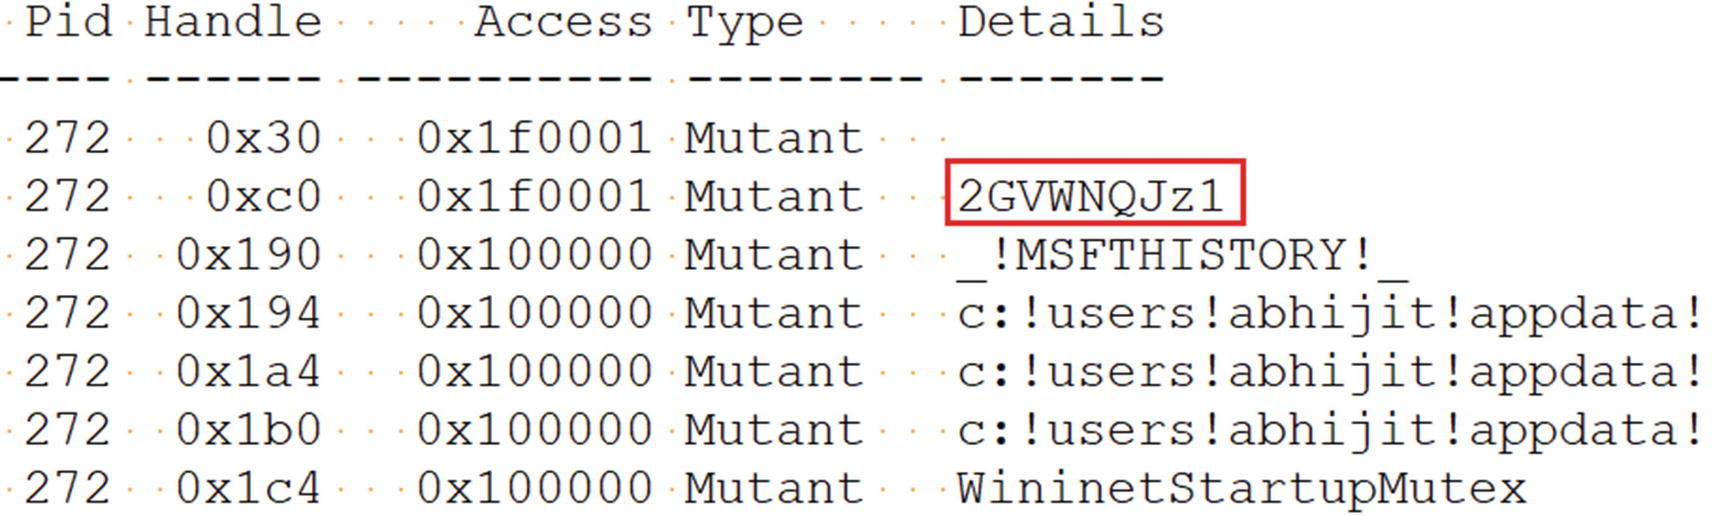
All open Mutant handles in our malicious svchost.exe process

The mutant handle we obtained 2GVWNQJz1 points to Kuluoz malware family
Scanning Registry
The Windows Configuration Manager, a Windows OS component, is responsible for managing the registry in memory. The Windows Registry is present in the memory and is represented by a structure named CHMHIVE. When we dumped the physical RAM earlier, we also dumped the registry from the memory into the memory dump file, which we can analyze now using Volatility. Volatility by its pool tag scan technique can identify and extract the registry information for us from the memory dump.

The protected system files that hold the Windows Registry on disk
The NTUSER.dat file stores registry data, located at C:Users<user name> tuser.dat. This file stores registry information that is specific to the logged-in user. ntuser.dat is a protected operating system file, and to view it, you need to enable Viewing Protected Operating System Files in Folder Options.
All these registry values from the files on disk are also present in memory in the CHMHIVE structure, which we can access by using Volatility.
hivelist
Volatility Command Hivelist to Specifically List All Registry Hives in the Dump

The registry hives information as printed by the hivelist Volatility command
dumpregistry
dumpregistry Command to Dump the Registry Hives to Files on Disk

The registry hives dumped as files using the dumpregistry Volatility command

Click Yes when Registry Viewer pops this window on startup

Click OK to continue opening the main Registry Viewer tool window
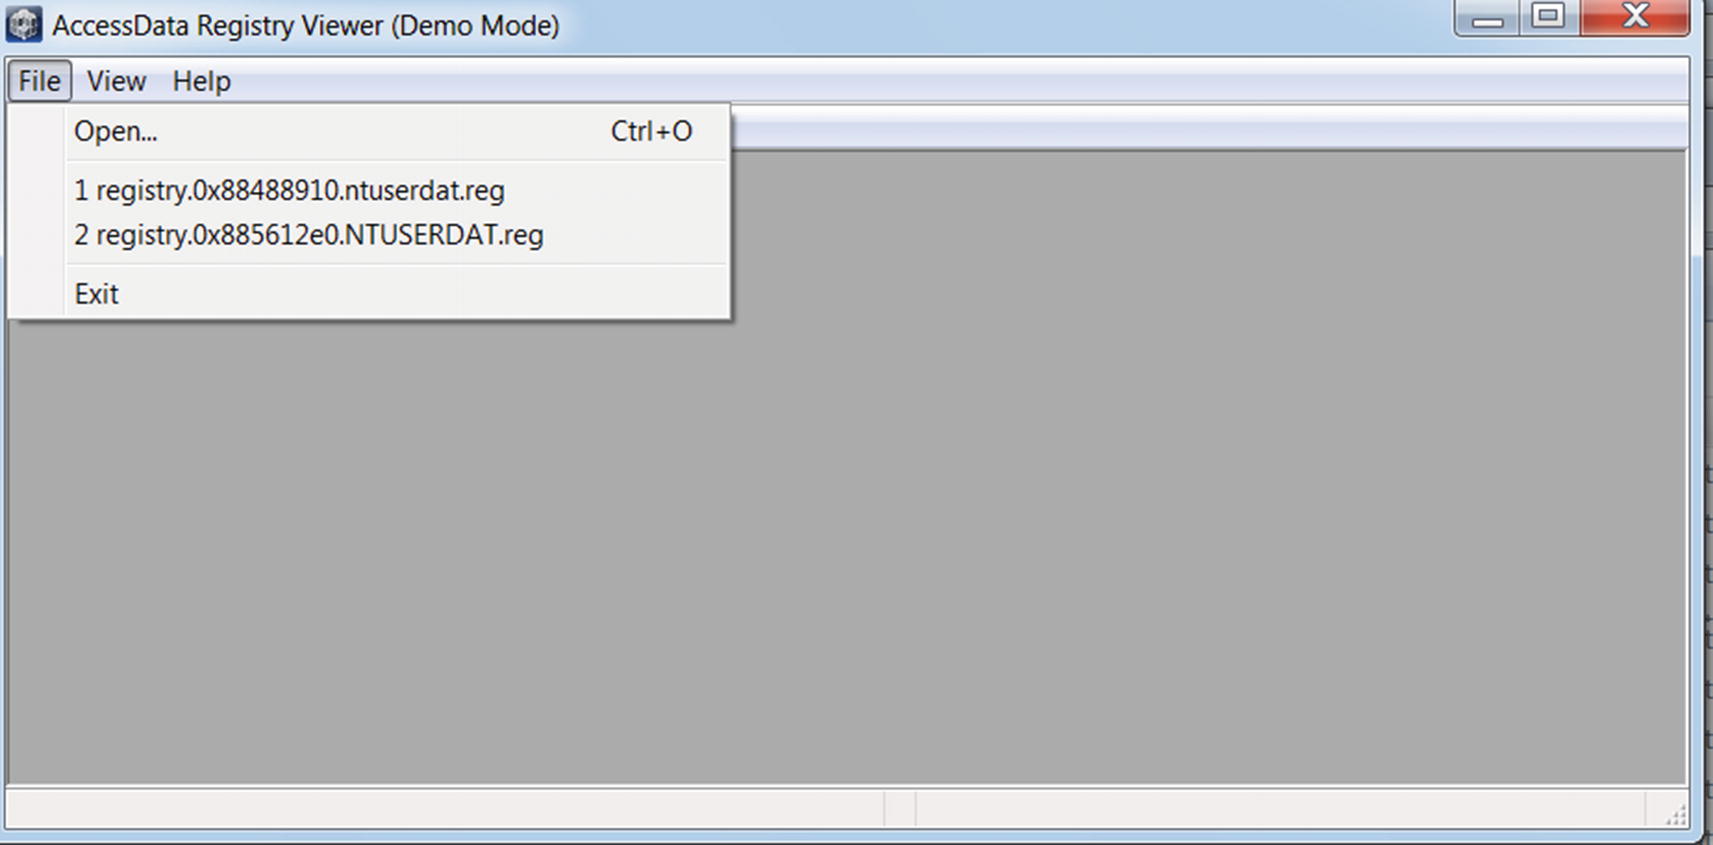
Main Registry Viewer window using which you can open the .reg registry files

Main Registry Viewer window using which you can open the .reg registry files
printkey
The whole previous process of dumping the entire registry using the dumpregistry command , and then opening it using Registry Viewer (all of this for viewing the Run entries set by malware) is way too cumbersome. You already learned the various Run entry persistence keys in Chapter 8, so you can use the printkey command in Volatility, which lets you view the registry key and its value.
printkey Command to Print Information About the RUN Key in Sample-14-1.mem Dump
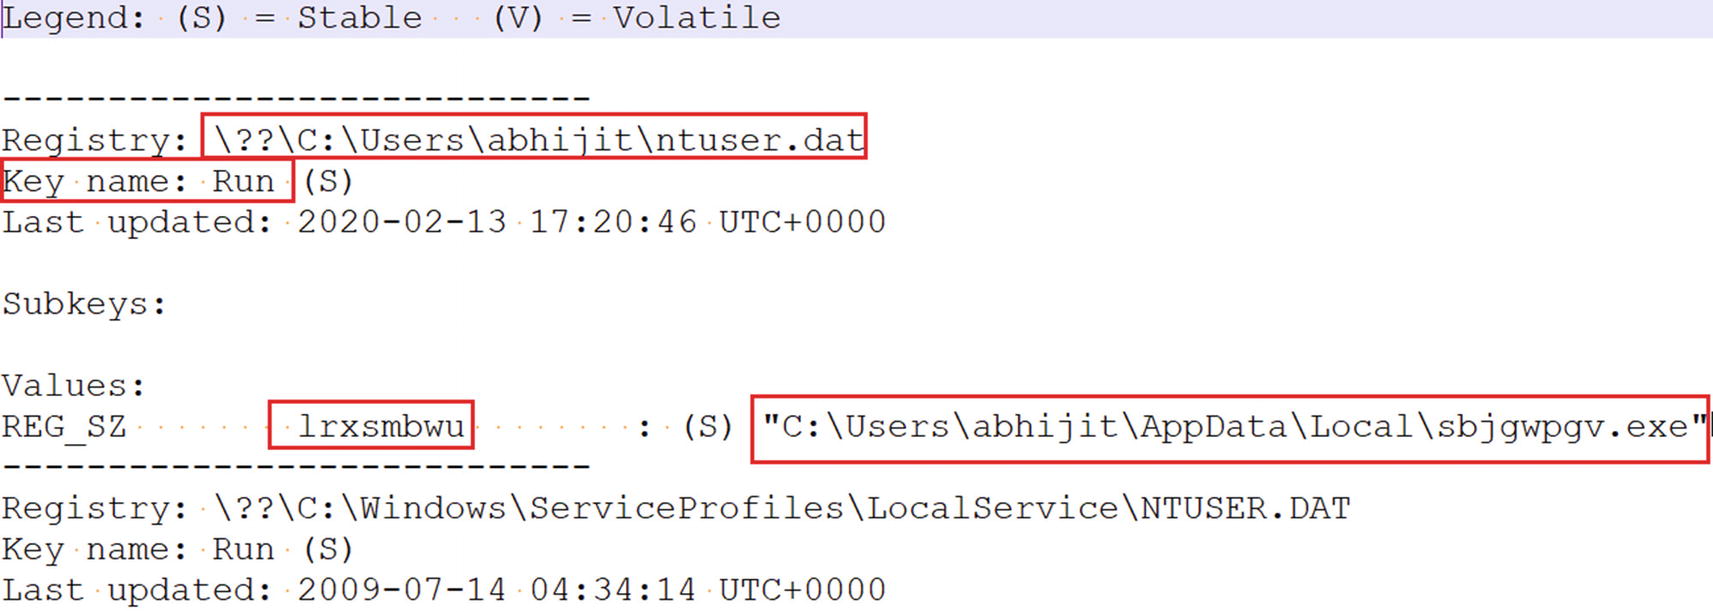
printkey shows a Run entry created by the malware in Sample-14-1.mem dump
Identifying Code Injection and API Hooking
Another wonderful function provided by Volatility is identifying code injection, which we can easily identify using a dynamic analysis tool like APIMiner as seen in Chapter 13. But it is harder to figure out if it’s happening using other tools, like ProcMon and Process Hacker. But Volatility has a nice plugin named malfind, which identifies injected codes.
The malfind Plugin
malfind Command to Detect Injected Code
The injected code output as seen from the output of malfind command
malfind Command with -D Option to Detect and Dump Injected Code to Disk
Multiple dump files containing injected code from the malfind command we used from Listing 14-19
These dump files are regular binary files and are prime candidates for string analysis using tools like BinText. Let’s look at one of the dumps (process.0x843b1098.0xa0000.dmp) using BinText, which holds content from the virtual memory location 0xa0000.
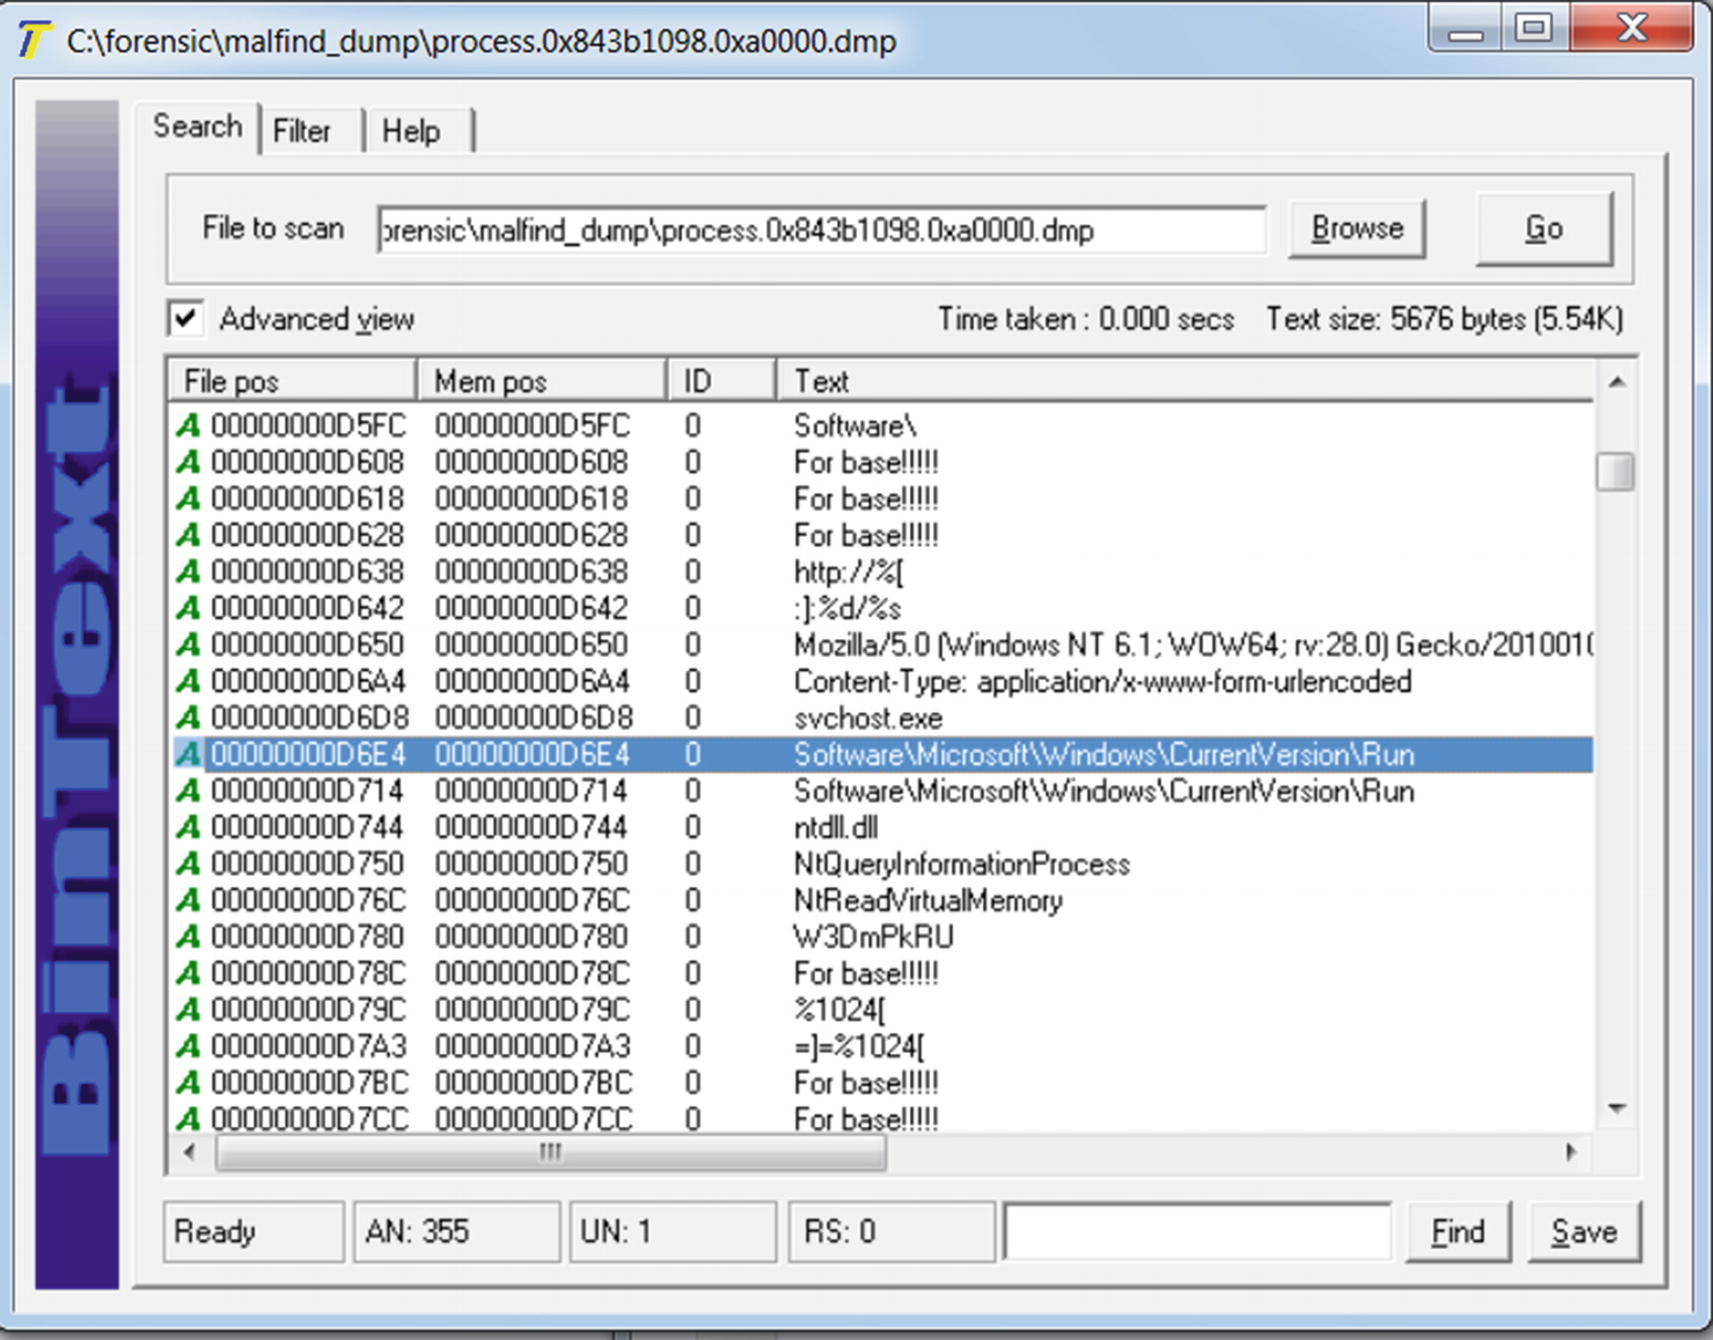
The strings from the malfind dump file that indicates the malware is unpacked
Detecting API Hooks
apihooks Volatility Command That Detects API Hooks
Do note that by running this command, you might find false positives or hooks created by some of the analysis tools, which aren’t malicious (and which we hope you don’t identify as malicious). So it’s better to first take a memory dump on a clean system before running a malware sample, and next run your sample and take a dump. You can then run the apihooks commands on both the clean and malware memory dumps and compare the apihooks outputs to weed out the false positives.
As an exercise, you can execute malware API hooking exercises from Chapter 10 and Chapter 11 and then acquire a memory dump of the system, and then run the apihooks command to detect the hooks.
Inspecting the Kernel
Volatility can scan the kernel and extract various data structures, allowing us to look at the loaded kernel modules, view the SSDT, and so forth. As a benefit of this feature, you can detect the presence of kernel-mode malware. For analysis, we use Sample-14-2.mem, which is the dump that we acquired after we ran Sample-11-7-ssdt-rootkit.exe. It is a rootkit that hooks the SSDT.
Scanning Kernel Modules
Volatility Modules Command That Lists All the Loaded Kernel Modules

Output from running the Volatility modules command from Listing 14-21
When analyzing malware that inserts kernel modules, listing the kernel modules may not give you enough information to identify the malware kernel module. The best way to figure it out is to first acquire a memory dump on a clean analysis VM before running the malware. Next run the malware and acquire a memory dump. You now have 2 memory dumps: one clean and the other with the malicious information. Use the Volatility commands to list the kernel modules on both the clean and malicious memory dumps and search for differences in the loaded kernel modules between the two outputs, which reveals to you the names and the locations of the kernel modules loaded after running your malware. In our case the kernel module loaded by our malware sample is rootkit.sys located at C:hidden ootkit.sys and is located at address 0x920ca000.
moddump Command That Dumps the Contents of All Kernel Modules to Disk
moddump Command That Dumps the Contents of the Specific rootkit.sys Module
Scanning SSDT
Volatility ssdt Command to List the Contents of SSDT

Output from running the ssdt command from Listing 14-24
Every row in the entry is an entry in the SSDT table; for example, in the first row of output, the first entry in the SSDT (i.e., entry 0x0000) is for the NtAcceptConnectPort service function, which is located in the ntoskrnl.exe kernel module at address 0x82c8dc28.
Similarly Entry 0x0042 is for the Service Function NtCreateFile and is located in rootkit.sys at address 0x920cb190. This is suspicious. But why? If you remember from Chapter 11 all the NT service functions in the kernel are located in the ntoskrnl.exe or win32k.sys kernel modules. But NtCreateFile which also is an NT Service Function is located in rootkit.sys according to the output, which is suspicious and indicates that it has been hooked.
Another technique to figure out hooked SSDTs is similar to the technique we explained in the previous section. Obtain two memory dumps: one clean without running the malware and the other after running the malware. Run the SSDT commands on both these dumps and compare the two outputs. If you see that the SSDT entries in the malicious dump output point to a different location in comparison to the clean dump’s output, then it indicates the presence of SSDT hooks.
Network Communication
Volatility Commands That Lists Network Activities from the Dump
command | Image version | Description |
|---|---|---|
connections | Windows XP | Active TCP connections |
connscan | Windows XP | Finds terminated connections |
socket | Windows XP | Displays listening sockets |
netscan | Windows 7 onward | Finds TCP and UDP connections |
netscan Volatility Command to List the Network Connections from the Dump

Output from the netscan Volatility command ran on Sample-14-3.mem
The output displays that a connection has been established between 192.168.159.130, which is our local analysis VM address and 23.57.113.23 using iexplore.exe, which is the process for Internet Explorer. Similarly, you can use the same command to list the various network connections initiated by the malware processes we run. You can figure out the connections initiated by the malware processes by using the process name and PID of the malware processes obtained from the Owner and Pid columns, respectively.
Command Line for Bulk Extractor Tool to Extract Packet Captures for the Network Connections from the Memory Dumps
Memory forensics cannot be restricted to malware analysis. Volatility supports many other commands and plugins that are useful to track down forms of attacks. We recommend that you go through other commands supported by Volatility documented in the Volatility wiki.
Summary
Malware forensics is another useful analysis technique in the fight against malware. It is especially useful, especially in incident response situations where we can be called to dissect malware in infected systems. In this chapter, you learned the various steps needed to carry out memory forensics, which involves forensics of the system’s memory. You learned how to dump the contents of the system RAM using various tools like FTK Imager. By using the acquired dumps, you learned how to analyze and dissect them using Volatility, the famous open source memory forensics tool. Using Volatility, we dissected real-world memory dumps acquired after running malware samples. With hands-on exercises, you learned various commands provided by Volatility to obtain various malicious artifacts that helped us conclude that the samples used were malicious. You also learned how to use Volatility commands to dissect the kernel memory to figure out the presence of any malware kernel modules and rootkits.