
Signature-driven detection of malware has various problems—obfuscation, packing, encryption, especially if you are trying to apply these signatures on static malware files, all of which makes most signatures useless. To make things more complicated, malware is getting more complex every day, making not just detection hard, but even analysis and debugging super hard. To deal with a lot of these detection difficulties, anti-malware solutions, including antiviruses, also look at the behavior of processes on the system, looking for anomalous and malicious activities and events that indicate any signs of malware infection on the system.
One such dynamic behavior-based detection technology that is not just used by malware analysts but by pretty much all anti-malware solutions today are malware sandboxes. In this chapter, we talk about why malware sandboxes are used, and we go through the various components that go into implementing them.
What Is a Malware Sandbox?
A malware sandbox is a controlled and isolated environment that executes a sample program, to record all the activities conducted by the sample processes under execution. The recorded events and activities from the sample processes are then sent back to the user of the sandbox, who can then analyze the events for malicious activity. In most cases, a sandbox is implemented as a virtual machine, but one can also create a sandbox system using a physical system, which is then called a hardware malware sandbox .
Processes and threads
Registry
Files and directories
Networking
Services
Synchronization
Systems
UI

High-level overview of the sample submission and analysis logs retrieval process

Most commercial security solutions make use of a cluster of VMs across multiple physical hypervisors to handle the load of analyzing multiple samples parallelly
Why Malware Sandbox?
Value, purpose, and detection efficacy improvements
Dynamic behavior-based threat identifications are such an important piece in identifying if a sample is malware or not, that pretty much every cybersecurity anti-malware solution makes use of a sandbox. Sandboxes have turned the table not only when it comes to improving detection efficacy of anti-malware products, but also aiding analysts while they dissect and debug samples.
Controlled and safe analysis environment
Sandboxes provide a controlled, isolated system using which one can observe the activities of a sample without fear of infecting the host and other systems outside the sandbox VM.
Speed and efficiency with automation
Used by almost every anti-malware detection solution today, sandboxes are automated. Anti-malware solutions push samples to the sandbox VM for analysis and pull back the analysis behavior results when the analysis is done. This automation made possible with the help of sandboxes, helps in speedily analyzing samples, thereby improving detection efficiency.
Used by analysts and reverse engineers for debugging malware
A sandbox is not confined to anti-malware detection solutions. It is used widely by analysts and reversers also for analyzing and reversing malware samples. Previously, we used APIMiner to obtain API logs for malware samples for sample analysis and reversing. Tools like APIMiner are nothing but API loggers that make the core of a malware sandbox. Instead of APIMiner, you can instead use a malware sandbox like Cuckoo, which you can install in your lab environment, to which you can submit your samples for analysis and obtain the API logs back.
Sandbox In Your Security Architecture
A sandbox is a super important piece in any anti-malware detection solution. Vendors are not only using on-premises physical appliances to run sandboxes but are also leveraging the power of the cloud to run them, giving them a globally accessible sandbox solution that their threat prevention products can use from around the world.
Network security products
You learned in Chapter 23 that file extraction is an important part of an IDS/IPS. Vendors that use network security products like Firewalls/IDP/IPS are known to make use of file extraction to extract files transferred across the network in packets and submit these samples to sandboxes for analysis.
Endpoint threat prevention products
Similarly, endpoint agents and endpoint data recorders and even some endpoint protection products are known to leverage sandboxes to submit samples obtained on the host for advanced analysis using sandboxes.
Email Security products
The emails we receive are rife with a multitude of attachments, some of them sent by malicious actors containing malware attachments. Email security products constantly monitor emails, extracting attachments from them, and carrying out analysis on them, including submitting them to sandboxes.

Security products that integrate and use sandbox in their Security Architecture
Sandbox Design
Guest sandbox VM
Host agent/controller
Guest agent/controller
- Monitoring agent
API Logger
Memory dumper
Deception agents
Communication channel between the host and guest agents
High-level overview of the components in a sandbox and how they interact
Sample Analysis Workflow
- 1.
The sample is submitted to the host agent for analysis.
- 2.
The host agent analyzes the file statically to determine the OS and the environment setup needed inside the sandbox VM to analyze the sample. For example, if the sample is a PE32 executable, it needs a sandbox VM running Windows. If it is an ELF executable, it needs a sandbox VM running Linux. We talk more about this later.
- 3.
With information on the type of VM needed from (3), the host agent finds a free guest sandbox VM from its cluster. If a VM is not free, it waits for one to be free.
- 4.
Once the host agent has obtained a free VM, it reverts it to its base pristine snapshot and resumes the execution of the VM.
- 5.
Now with the guest sandbox VM up and running, the host agent establishes a communication channel with the guest agent running inside the guest sandbox VM.
- 6.
With the communication channel established, the host agent transfers to the guest agent the sample file from (1), requesting it to run the sample and return the behavior log results.
- 7.
The guest agent now runs the file sample and inject it into its monitoring agent, which is usually a DLL. The monitoring agent consists of various components like an API Logger and Memory Dumper, which logs various information about the APIs the sample uses and dump memory from the running sample processes.
- 8.
The log and dump related data obtained from (7) are picked up by the guest agent and sent back to the host agent either via the same communication channel that it established in (5) or by any other medium.
- 9.
The guest agent now returns the behavior analysis logs and data to the caller who submitted the sample.
And that’s how it is done! In the next set of sections, we dissect the internals of the various sandbox components and go through the details of what it takes to implement a full-fledged sandbox.
Guest
The guest, or the guest sandbox VM, is the heart of the sandbox engine. This is the VM where a sample is executed and monitored for its behavior. The sandbox VM is something that is usually set up one time at the time the sandbox engine is deployed and then snapshotted to be used later to run samples for dynamic analysis.
Guest Setup
Based on various factors, including the type, the format of the sample, a sandbox engine deployment usually consists of multiple guest sandbox VMs, each catering to different sample needs. Based on the operating system target of a sample, you can have sandbox VMs running Windows, macOS, and Linux.
Based on specific file types your security product is designed to analyze, you might also need various tools installed inside each of the sandboxes VMs. For example, if your sandbox engine is expected to receive and analyze Microsoft Office files, it requires that you install tools like Microsoft Office and other such related tools that can be used to run and execute these files. If you have PDF files that need to be analyzed, you might want to install tools like Adobe PDF Reader, Foxit Reader, and so forth inside the sandbox OS that can open these files. And so on. The type of file and its context decides the OS of guest sandbox VM and the environment and tools installed in it.
Guest VM Mimicking End-User Systems
In Chapter 2, we spoke about how you should set up your analysis VM to mimic regular end-user systems. The same reasons dictate why you should set up your guest sandbox VM to mimic regular end-user systems. Most malicious threat actors are aware that sandboxes are used by most anti-malware vendors to analyze their malware’s dynamic behavior. To thwart any such dynamic analysis inside sandboxes, threat actors code various armoring (covered in Chapter 19) and anti-analysis features inside their malware. These armoring features aim to detect if the sample is under analysis inside an analysis VM or inside a sandbox VM. Then, it exhibits benign clean behavior or exits early, leading to behavior log collection that does not indicate any malicious activity, misleading analysts, and detection.
To thwart any such armoring techniques and prevent the malware from figuring out that it is being analyzed inside the sandbox VM, we need to set up the OS and also the environment inside the OS of the sandbox VM to mimic the OS, hardware, and environment of a regular end user. If you can fool the malware sufficiently enough into thinking that it is running inside a victim’s computer, the malware exhibits its intentions, and we can extract the malicious behavior logs from inside the sandbox VM, thereby helping us detect the sample as malicious.
Keyboard and mouse movement
A regular end-user system has the user use the keyboard and mouse for various activities on the system, but a sandbox VM system is an automated analysis system (the exception is interactive malware sandbox—you can read about it on the web), with no user present to use the keyboard and mouse. Malware exploits this absence of keyboard and mouse movement in the sandbox VM as an armoring feature. To counter this, a lot of sandboxes simulate mouse cursor movement and keyboard strokes inside the sandbox OS, to fool the malware into thinking an end-user is using the system.
Hiding analysis tools and libraries
Most end users don’t install any malware analysis libraries, frameworks, and tools, but such tools are installed in both analysis VMs and sandbox VMs. Malware is known to search for the presence of such libraries and tools as an armoring feature. You must try to hide the presence of these tools inside your VMs. One such mechanism that you can use is to rename the tools and libraries since most malware tries to search for them using their names.
Hiding API Logger agent
The API Logger is the heart of the behavior logging mechanism inside most sandboxes. It works by injecting itself into the malware process so that it can hook the malware’s Win32 APIs and log them when the malware uses these APIs. Malware is known to search for the presence of such agents inside its memory space as an armoring feature. While designing your API Logger agents, you might also want to hide your presence, wiping out any memory structures that super easily identifies the presence of your agent. Malware also hunts for the presence of any hooks in the APIs, but more advanced techniques to hide one’s presence on the system requires you to use frameworks like Binary Instrumentation (covered in Chapter 25) using which you can thwart armoring techniques from malware.
Randomize directory and file names
Malware threat actors are also known to identify the directory naming structure and the file name patterns used by the agents and other tools inside the sandbox VM of anti-malware products. To thwart such attempts, you can randomize the locations, names for the directories and files used by your host agent, monitoring agent, and other tools that you use inside the sandbox.
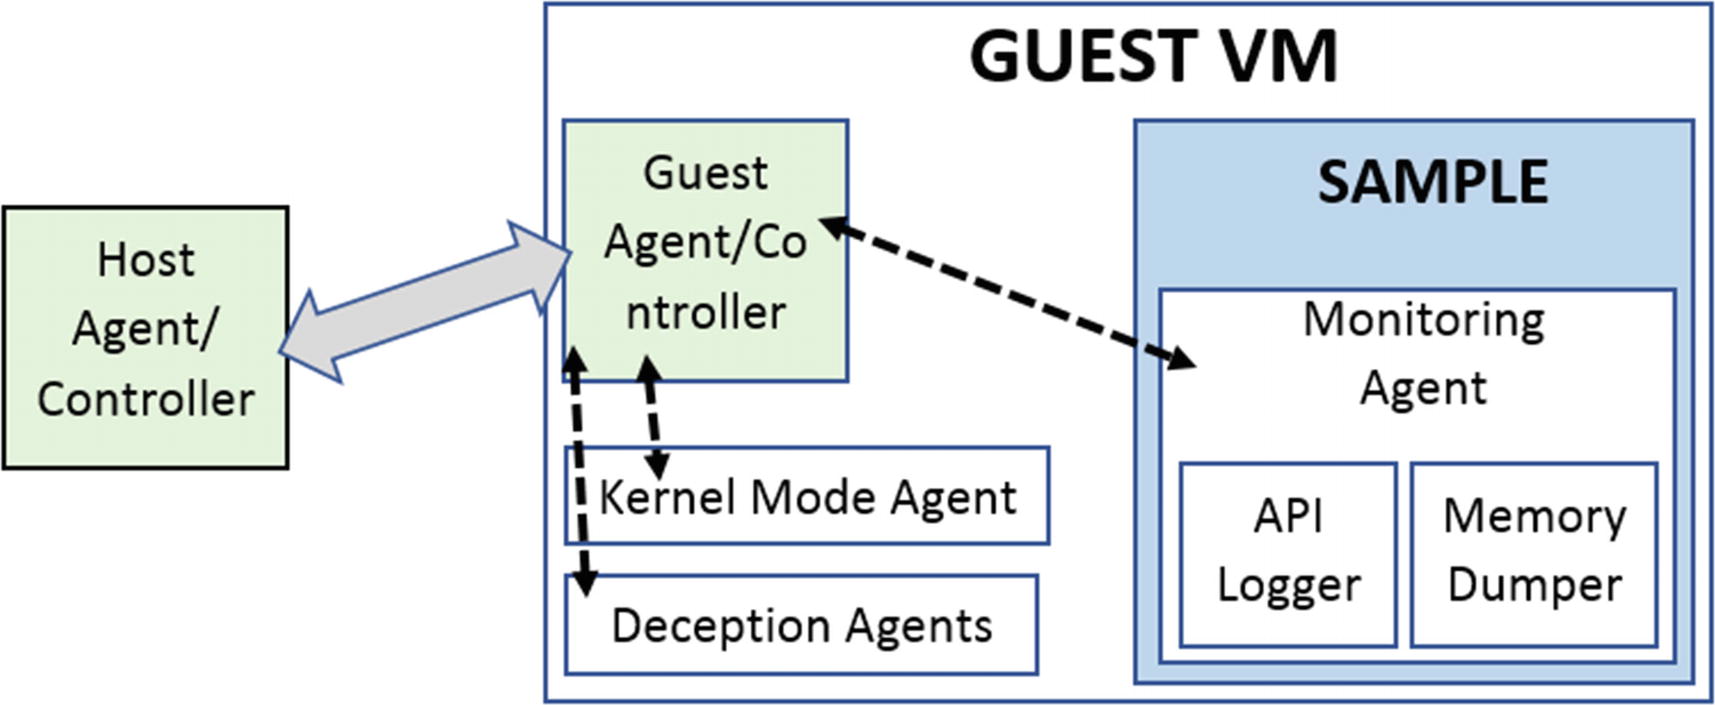
Host and Guest Agents
A sandbox design consists mainly of two agents/controllers that communicate with each other to run samples inside the guest sandbox VM and then retrieve the dynamic behavior logs and data back to the host/caller for analysis. One agent sits inside every sandbox VM, and the other sits outside the sandbox VM or on the host, which we call a guest agent and a host agent, respectively, also illustrated by Figure 24-4.
The host and guest agents can be implemented in various languages. Some of them use C to implement both agents. Some use Python. Others use Go. Some use a combination, where for example, the host agent is in Python, and the guest agent is implemented in C. Now, let’s go through the workflow of these agents.
Host Agent
- 1.
On startup, it needs to make sure that it brings up all the sandbox VMs in its cluster and continuously needs to make sure that they are in a state where they can be used. VMs can hang, crash, and so forth for various reasons, and the host agent makes sure they are always all up and running .
- 2.
Some sandbox products task their host agent with the job of creating and maintaining base VM snapshots for their VMs. The host agent on bootup, starts all the sandbox VMs and then snapshot them, and continue to make sure these snapshots are in place.
- 3.
On receiving a sample file for analysis, the host agent analyzes the sample statically to figure out the OS, the type, and the environment of the sandbox VM needed by the sample for its execution. For example, if it receives a Windows PE executable, it uses a Windows guest sandbox VM to run the sample, similarly for Linux and macOS, illustrated by Figure 24-5.

Host agent dispatching files to different types of sandbox VMs based on various factors like the format of the file
- 4.
With the target type VM figured out the host agent searches for the next free VM in its cluster. Once it obtains a free VM, it restores the VM to its base snapshot, resumes/starts the VM. Once it is up and running, it establishes communication with the guest agent inside the sandbox VM, and then hands over the file to the guest agent for execution.
The host agent also sends various parameters and requirements regarding the execution of the sample file. For example, almost all sandboxes use timeouts for the execution of a sample, so that they don’t execute forever. They can pass this timeout value to the guest agent so that the guest agent can terminate the sample once the timeout value is hit and send the logs back to the host agent.
- 5.
With the sample now submitted to the sandbox VM for execution, the host agent waits for the execution and analysis to complete, after which it extracts/downloads the behavior logs and data from the sandbox VM.
Guest Agent
- 1.
Based on the type of the file, requirements of the file, and the user-defined conditions and parameters, the agent first sets up the environment of the OS. For example, it might want to make sure that other agents and detection modules are running in the system; the kernel-module monitoring agent is running if needed and so forth.
The host agent usually covers a lot of the sandbox environment OS setup while it sets up the VM, and are included as a part of the snapshotted VM. So, the part where the guest agent must set up the OS environment may not be necessary for every single case. But sometimes it is needed for cases like inserting and setting up the kernel-module monitoring agent since, by default, not every execution of a sample needs it to be inserted.
- 2.
With the sandbox, VM OS environment set up, and with the type of the sample file and execution environment figured out, the guest agent executes or opens the file. To execute the sample, the guest agent usually makes use of helper programs, which are usually tasked with executing the sample and inserting various agents like the monitoring agent into the sample process.
For example, if the sample file is an executable, the helper program has to run the sample and inject the monitoring agent into the process, using one of the code injection techniques we covered in Chapter 10.
If the sample file is a Microsoft document file, it has to open the file using Microsoft Word program, enabling various debugging and analysis facilities inside Microsoft Word. It then injects the monitoring agent into the Microsoft Word process. This can be illustrated in Figure 24-6 .

Based on the type of the sample file, host agent executes/opens the sample using various techniques, and then inserting the monitoring agent to observe and log its activities
- 3.
With the sample running and various monitoring agents and other agents observing the sample for various behaviors/events, the guest agent waits for the sample to finish execution.
The guest agent usually uses a default timeout value or a user-supplied timeout value to stop the monitoring process of a sample (i.e., if a sample doesn’t shut down on its own). You can’t run and monitor a sample forever! There is no global standard for default timeout values. Some vendors use 10 seconds, 15 seconds, 30 seconds, 1 minute, 5 minutes, and so forth. It can vary based on the effectiveness of the sandbox vendor’s monitoring agent, the type of file, and can be overridden by the user who submits the sample for analysis.
- 4.
Once the monitoring phase of the sample is complete, the guest agent collects the behavior log information and data from the monitoring agent and other agents on the sandbox OS. It sends all the collected logs and data to the host agent, which can then report it back to the user/caller who submitted the sample.
Monitoring Agent
Like we explained in the previous section, the monitoring agent is the component that is inserted into the process space of the sample to be monitored. It is usually implemented as a DLL library that is injected into the sample process using one of the various DLL Injection techniques we covered in Chapter 10.
To inject the monitoring agent DLL, the guest agent usually takes the help of a helper program. For example, if the sample is a native PE executable file, the helper program starts/executes the sample in SUSPENDED mode, injects the monitoring agent DLL, and then resumes the suspended sample process(refer to Chapter 10 on how code injection works).
The monitoring agent DLL itself is made up of various functional components, but the two most well-known components are the API Logger and the Memory Dumper.
API Logger
API Logger works by hooking all the Win32 APIs used by the sample process and logging info if any of the Win32 APIs are invoked/called by the sample process. It logs the names of the Win32 API and the various parameters passed to the API. Some good examples of an API Logger are APIMiner and Cuckoo Monitor.
Memory Dumper and Dynamic Unpacking
We know that most malware samples are packed and usually unpack themselves in memory when run. The unpacked content holds a wealth of information about the malware sample, even containing enough details to not only help us identify if the sample is malicious but also classify it. We explored this technique of analyzing malware using its memory contents in Chapter 13 and Chapter 15. The same technique is also used by sandboxes using the Memory Dumper module in the monitoring agent.
The Memory Dumper module is usually implemented in conjunction with the API Logger, and it works by dumping the contents of the sample’s memory at various stages of its execution. The dumped memory contents, if extracted at the right points of the sample’s execution, contains the unpacked contents of the malware’s memory. The dumped memory is then extracted out to the host agent, where we can analyze the dumps for malicious strings using signatures like YARA.
Kernel-Module Monitoring Agent
The monitoring agent DLL we spoke about earlier is all user space, and the API Logger works by hooking Win32 APIs in user-space. But sometimes malware is implemented with armoring techniques that detect that it is hooked/monitored by a monitoring agent DLL, resulting in inadequate logs or rather logs that don’t indicate maliciousness.
In cases where not enough logs are obtained, many sandboxes re-analyze the sample by instead using a kernel-module monitoring agent module that logs information on the behaviors exhibited by the sample process, including process and thread creation events, file events, network events, and registry events. While these events are much more high level and not as granular as the Win32 API usage logs that you obtain from the user-space API Logger, it works as a good last resort to identifying the malicious behaviors exhibited by the malware sample when executed.
ProcMon and ETW
Obtaining behavior-based information about a sample doesn’t always have to come from an API Logger. Just like the kernel-module monitoring agent, some other user-space tools and techniques can obtain high-level events that describe the behavior of a running process. For example, some sandboxes are known to use ProcMon to log events from the sample execution. Similarly, others are known to use ETW, an event tracing technique on Windows to log behavior events of the sample process. But do note that these techniques log behavior information at a high level, which is not as granular and descriptive as Win32 API usage logs that you can obtain from an API Logger.
Deception and Other Agents
Sandboxes also use various other techniques to monitor the sample for any malicious activities. Some of these techniques use deception mechanisms to identify malware. Honey File and HoneyProcs are some of these deception technologies that use decoy files and decoy processes inside the sandbox VM, which, if accessed by the executed sample inside the sandbox, possibly indicates that the sample is malicious. We talk about Honey Files and HoneyProcs in Chapter 22.
Communication Channel Host <-> Guest
The host agent submitting the sample to the guest agent for analysis
The host agent communicating to the guest agent various config settings and sample execution attributes, including user-supplied parameters needed to execute the sample.
The guest agent returns to the host agent, the analysis log, and various data collected from the monitoring process.
All the communication usually happens via a network connection established by the host agent with the guest agent. Most, if not all, sandbox VMs have networking enabled, using which the guest agent can listen on specific ports for incoming connections. The host agent connects to the guest agent on these ports, thereby establishing a two-way communication channel with it, which can exchange all the data we specified.
The host and guest can use other communication mechanisms, like serial ports opened inside the guest VM using the hypervisor-provided communication frameworks and mechanisms, but the most well-known method is TCP/IP-based network socket communication.
Logging Technique: Files vs. Streaming
Now in the section on monitoring agent, we explored how the agents log various behavior information like API logs, events, memory dumps for the executed sample, inside the guest VM, which needs to be extracted out to the host for further analysis and dissection. But how does the monitoring agent and the other agents log this data inside the sandbox VM?
Dump all the logs, event information, and memory dumps to files on disk, which then the guest agent picks up and transfer to the host agent via the communication channel established between them.
The monitoring agent and the other agents don’t dump any logs to disk and instead directly transfers it to the guest agent via some inter-process communication technique, which the guest agent then transfers to the host agent.
The first technique is the easier technique. It is easy dealing with files. But this technique has a drawback, where certain malware is known to hunt for such log files and delete them, thereby erasing any information/traces of it. Also, some other malware like ransomware might cause damage to these log files if they encrypt them, again destroying all the logs extracted about the ransomware sample.
To counter the situation, sandboxes are known to implement technique no (2), where the monitoring agents instead establish an inter-process communication with the guest agent, thereby avoiding any attempt by the malware to destroy the logs.
Writing Detection on Sandbox Results
In previous sections, we covered how the sandbox runs samples, and monitor and log its various behaviors and events, and then return the behavior results, memory dumps, and other data back to the caller who submitted the sample.
Once the logs are returned from the VM, start the next stage where you analyze it for maliciousness. Throughout the book, we used APIMiner to log API traces for various malware samples, and then inspected the API logs generated to identify any malicious sequences of API calls. The same concept applies to analyze sandbox API log results as well. If you can convert these API logs to signatures based on various malicious sequences of APIs that malware use, we can apply these signatures on the API logs, to identify and classify the same as malware.
As an example, you learned in Chapter 10 that a sequence of APIs like CreateProcess, VirtualAllocEx(), and WriteProcessMemory carried out against a remote process indicates code injection and thereby indicates malicious behavior. Converting such API sequences into signatures and automating the application of such signatures against the API log trace output from the sandbox, helps us easily catch malware that uses code injection using this sequence of APIs. You can similarly convert other malicious sequences of APIs into such signatures.
Similarly, the Memory Dumper modules in sandboxes extract the contents of the sample’s memory at various stages of its execution. The extracted memory contents can then be analyzed for malicious strings to identify if the sample is malicious and even classify the sample. We can also write YARA rules against these memory dumps, as we did in Chapter 22.
Machine Learning Using Sandbox
Machine learning has made its way into every modern software, and so it is the case of cybersecurity. It is widely used to build threat detection models in combination with sandboxes.
Huge labeled sample sets of clean and currently trending malware samples are programmed to be fed into sandboxes to obtain API logs. The obtained API logs across the sample sets are then extracted for various features. The features extracted out of the API logs can be API calls made, the sequence of API calls made, and the parameters used with the API calls. These extracted features are then fed into various machine learning algorithms to build baseline models, which are then deployed to detect malware on the system. Now when a new sample is received for analysis by the detection product, it is run through the same sandbox to obtain its API logs, which are then extracted for its features. The extracted features are then run against the baseline models that were built and deployed earlier, which classify if the sample is malicious or clean.
Now, machine learning models are not 100% accurate in correctly classifying if a sample is clean or malicious. There is a false-positive and a false-negative rate like almost every other detection technique. But the main effectiveness in using machine learning to identify malicious samples doesn’t depend too much on the algorithm, but rather on the features extracted out of the sample. If the sandbox is capable of correctly executing and analyzing the behavior of the sample and extracting all the API calls made by the sample, this can help us build better features. It's these unique features obtained from samples that help the machine learning algorithms differentiate between a clean and malicious sample. The worse the features obtained, the worse the detection rate. The focus should be on better feature extraction. The algorithms we have today to build these models are fine.
Now how much ever you strive to improve these models, there’s going to be some false-positives and false-negatives always. That’s inevitable. This is where combining this detection technique with other detection techniques is important. Memory dump analysis, in combination with YARA signatures, is one such detection technique that you can use to improve overall detection accuracy and efficacy. Similarly, antivirus engines can be used as well. Static properties like Signer Info can help you classify if a sample is clean or not. You can also combine various network-related detection engines to further provide additional context and information. The list goes on. Multiple detection techniques all need to work in a seamlessly integrated fashion to provide high accuracy detection results.
Summary
Malware sandboxes have become a super important piece for almost all detection products today that deal with malware files. In this chapter, we cover what a sandbox is and why it is of great value today as a detection technique. We cover how sandboxes are integrated into various detection products like network security products, endpoint agents, and email security products. We cover the workflow involved in submitting malware samples for analysis to the sandbox. We then get into how a sandbox is designed and the various components it is made up of. We also cover the API Logger and other such behavior monitoring techniques that can observe and log the various behaviors exhibited by a sample. We finally cover how one can write detection on the log results returned by the sandbox and also combine it with machine learning algorithms to automate and speed up detection.