
You pick up almost any software, and it communicates over the network for one reason or the other. Even something like software updates happens over the network and is a form of network communication. The same applies to malware, as we have covered in Chapter 9. The use of network communication for malicious activity extends to a timeline that precedes command-and-control (CnC) communication by the malware. Even before the malware file is delivered to the victim, you might have an exploit delivered to the victim, multiple malicious exchanges before the final malware payload file is transferred over the network. Similarly, you can also have emails carrying malicious attachments. All use the network for its communication.
To detect any malicious network communication, there are many security products: firewalls, intrusion prevention systems, intrusion detection systems, email security products, and so forth. Even host-based anti-malware solutions listen to network communication to/from the host to monitor for the presence of malware on the host. All these different security products serve different needs, and a good defense in depth solution needs a combination of products to protect our systems.
Of all these network monitoring products, intrusion detection systems (IDS) and intrusion prevention systems (IPS) are one of the oldest and one of the most deployed solutions. There are various IDS/IPS in the market, all the way from commercial paid products to free and open source ones like Suricata and Snort.
In this chapter, we cover the basics of various internal aspects of IDS/IPS and what happens on the inside to get this complex software working. We also cover the basics of Snort/Suricata rule writing that can get you started on writing rules to detect various types of network communication using Suricata.
Network Traffic Flow
North-south traffic
East-west traffic
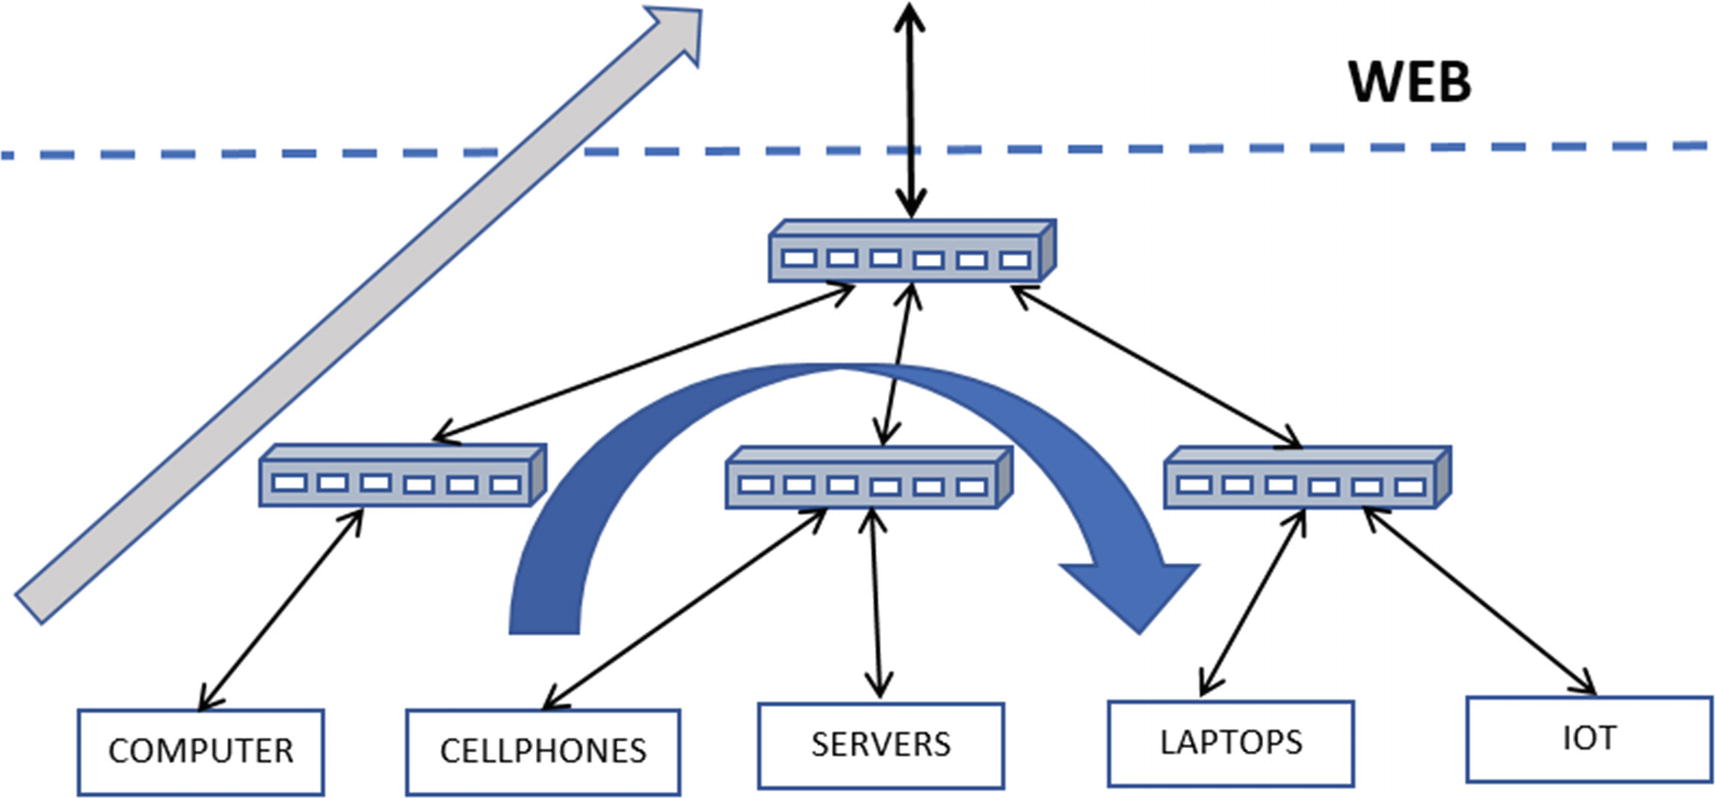
Rendition of north-south traffic flow in gray and east-west in blue
North-South Traffic
In Figure 23-1, north-south traffic refers to traffic flowing between your internal network and the external network. Often, the external network is the Web, but this is not necessarily true. The term internal depends on what you define as internal to you, can be one small subnet, one department, one block, one zone, or it can be your entire enterprise’s network. Anything other than the internal network that you have defined is the external network.
In malicious network communication, the external network is the Web, and north-south traffic corresponds to all the traffic flowing between your enterprise/office and the Web.
From a malicious traffic perspective, this is the kind of traffic that usually carries network connections that involve CnC from the malware infected on the systems to the attacker and their servers on the Web. It also includes other malicious traffic, including malicious exploits coming into the network, scans from the web into your internal network, emails coming into your network from the web carrying malicious payloads, links, and attachments and so forth.
East-West Traffic
Keeping in mind the definitions of an internal network and an external network, east-west traffic involves traffic that occurs between hosts within the internal network or in other words within your enterprise.
From a malware traffic perspective, this is the medium of traffic that carries malicious traffic from attackers who are trying to move around your internal office network, trying to infect other machines within your enterprise, scanning and scoping other machines in your network, probing for information from other machines on your network and so on. Since this malicious traffic involves moving laterally on the network, rather than moving up/down to/from the web, the technique used by attackers to move around laterally inside your network is called lateral movement.
Network Traffic Analysis
Communication visibility
Network and device health visibility
Resource and device visibility
Malicious activity identification, including exploitation identification, malicious infection identification, recons, and any other malicious activity
Not all kinds of traffic analysis require the exact same kind of analysis solutions. Depending on the analysis needs, the solutions might vary, and so its complexity. For example, simple visibility on the communications between various devices on your network might just need simple NetFlow logs and nothing more, which can be achieved using flow logs extracted from switches on your network. But on top of the, more complex communication visibility reports, including the type and information on the data that is exchanged between the devices, might need deeper inspection into the contents of the packets and dissection of the protocols used by them.
A deeper inspection into packets, including dissection of the protocols used by them, is called deep packet inspection (DPI). DPI is a must if you are looking to identify malicious network traffic, be it exploitation identification, malware CnC, recon identification, and so forth. DPI is used by almost every network security product today, including firewalls, IDS, IPS, and so forth.
Network Security with IDPS
IDPS, an acronym for intrusion detection and prevention systems, is among the oldest network security solutions available in the cybersecurity world. An IDPS aims to detect or prevent intrusions on the network by malicious actors. Pretty much every IDPS solution uses DPI to dissect the contents of the packets, parse the protocols used by them, including application layer protocols, extract various fields from the protocol data, and inspect these fields for maliciousness. The extracted information is then inspected internally by the IDPS using a rule language and signatures provided by the user, or it can log all this dissected network packet information to log files or other ingestion mechanisms using which we can analyze and search for the presence of any maliciousness.
IDS vs. IPS
An intrusion detection system (IDS) is pretty much the same as an intrusion prevention system (IPS), barring some minor extra functionalities in the IPS. An IDS like the name suggests only aims to detect and alert the users about the presence of an infection. An IPS, on the other hand, not only detects and alerts the user of an infection but also tries to prevent the infection. That’s pretty much all the difference between these two.
Components-wise, IDS and IPS are the same, except some minor extra features in the IPS that allow it to function differently. The main function differentiation comes in the form of its ability to pick packets of the wire, analyze it and then either throw it away or release it back onto the network wire if it deems the packet to be benign.
IDS: traffic Feed Mechanisms
An IDS works to detect and alert about any malicious activity on the network. To do this, the IDS must be fed packets from your network that it can decode and analyze. To supply packets from your network to your IDS, there are two known methods: SPAN and TAP.
SPAN

Mirroring packets in switches using SPAN ports
Now one of the advantages of SPANs is that almost all commercially available switches or at least most of the notable ones come with an built-in ability to span traffic out via a SPAN port they provide. This advantage means that you walk into any location where you want to deploy your IDS, and the location has a switch (which pretty much every network does), and you have a way to get the packets from the customer’s network to your IDS from these built-in SPAN ports on the switches. You don’t have to buy any additional hardware to get packets from the network to your IDS.
TAP
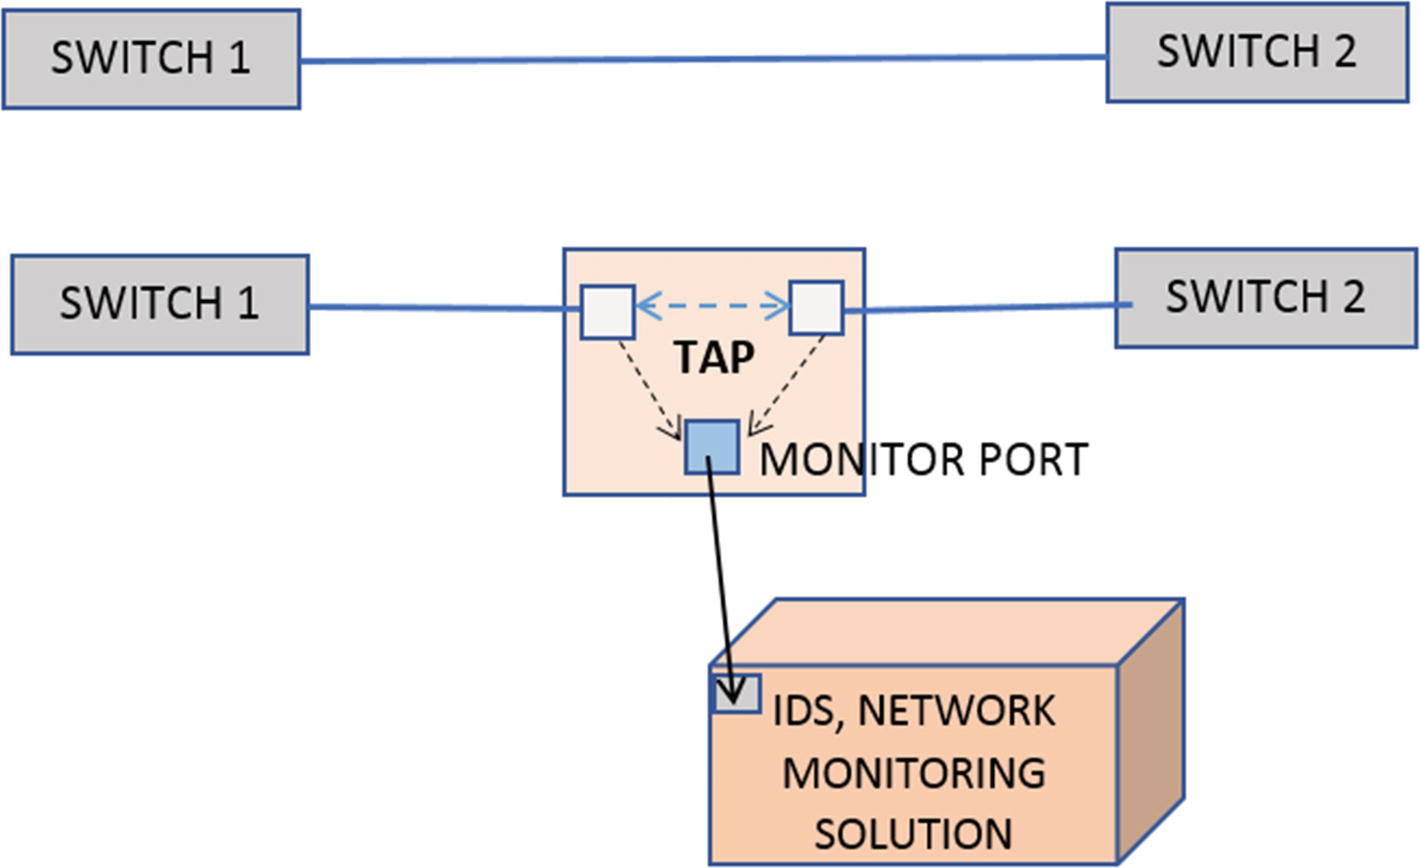
TAP copying packets into its monitor port which can then be fed into IDPS
Again the point to note is it is a separate hardware device, which needs to be separately purchased and installed in the network to get a copy of the traffic feed for your IDS analysis. In contrast to this, SPAN comes built-in with most, if not all, switches.
SPAN vs. TAP
One of the advantages of SPANs is configurability. With switches, you usually configure multiple VLANs for your enterprise based on various factors, like department, zones, buildings, and so forth. With switches, you can specifically SPAN traffic out for specific VLAN or ports on the switch, making it highly configurable from a perspective of fine-tuning the traffic you want to mirror out to your network monitoring solutions like IDS. This flexibility is not available with TAPs.
Another advantage of SPANs over TAPs is availability. You don’t have to buy new hardware when you walk into the enterprise network to deploy your IDPS solution. Most switches come with the SPAN feature built-in.
While the paints a rosy picture for SPANs, it has its drawback and some major deal-breaking ones. SPAN is a feature built-in into the switches, and sometimes when the switch is oversubscribed, spanning ends up taking too much CPU to the extent that it can drop packets. This becomes visible in your IDS as packet loss, which is painful for your IDS to deal and leads to lower detection accuracy and efficacy. TAP, on the other hand, is a pure passive physical device and can handle copying packets out to the monitor ports at full network load without any loss. This makes it perfect for network monitoring solutions and for compliance where you need perfect unadulterated data.
IPS Traffic Feed
There are multiple ways in which you can feed your IPS with traffic. An IPS like the name suggests prevents Intrusions. Preventing intrusions means the IPS should have the ability to receive the actual packet from the network and not a copy of it so that the IPS can analyze the packet, and if it finds it to be malicious, it can drop/throw the packet away. But instead, if the IPS receives a copy of the packet instead of the IDS as described in the previous section, it is pointless to throw the packet away since the real packet still be traveling on the network to its destination.
To provide the IPS with the actual packet and not its copy, one can pass packets inline through an IPS through various methods, which we have discussed. Running an IPS is something also called running an IDS in inline mode, a terminology that you come across often and is good to remember.
iptables and Netfilter
iptables is a popular firewall on Linux that allows users to define rules to govern what packets can be received/forwarded/sent by the system and which ones should be dropped. iptables works by interacting with the Netfilter framework, which is packet filtering hooks iptables registers into. Every packet flowing through the kernel’s networking stack trigger these hooks, allowing programs like iptables to process these packets against the rules it holds, making sure they conform to those rules, based on which it can either allow the packet or drop it or allow it to flow through other chains and so forth.
Now using client libraries that interact with the Netfilter framework and iptables Rules, software applications like IPS can insert itself into the packets flow through the kernel’s network stack, basically receiving the actual packet, which it can then analyze and then return a verdict to Netfilter and the kernel subsystem, asking it to either drop or allow the packet to flow through, thereby achieving inline mode.
Peer Mode or Bridging
Peer mode works very similarly to inserting a tap in your network, basically peering two network ports. Think of peer mode like you have a cable that is carrying all the packets to and fro on the network. You now split the cable (literally) and break it into half. You now take an IDS which has two ports, and you plug in the two ends of the split cable into the two ports of the IPS.
With the setup, the IPS now acts like a simple bridge system peering the two ports, almost as if the split cables are connected as a single cable like it was before. Packets arriving at one port are copied over to the other port and vice versa.

IDPS setup in inline peer mode, discards and throws away malicious packets while copies clean good packets to the peer port

Major modules that make up an IDPS and the flow of packets through them
As you can see in the figure, packets are flowing in either direction—left-to-right and right-to-left. The blue packets are clean packets, and the red packets are malicious. Once the packets from one direction enter the IPS on one end, it discards the malicious red packet, and out the other end comes clean blue packets only.
Pseudo IPS = IDS + Pseudo Inline
We know that the IDS is not an inline device, basically only getting a copy of the packets. But by combining with other inline network monitoring solutions, the IDS can work in a kind of pseudo inline mode. To make this work, the other Inline network monitoring solution receives the actual packet, but it sends a copy of the packet to an IDS that is connected to it. The IDS process and inspect the packet and send back a verdict to the network monitoring solution, which can be something like ACCEPT, REJECT, or more, based on which the network monitoring solution either further allows the packet it holds or drop it. From the IDS perspective, all it sees is a copy of packets from the network, very similar to how it works in SPAN mode.
Deployment Quirks for IDPS Sensors
Deployment of an IDPS inside an enterprise’s network depends on various factors like the number of subnets, number of switches, the flow of traffic, locations inside the network that need to be monitored, monitoring of north-south or east-west traffic or both and so on.
Based on various factors, you might have to deploy multiple IDS instances across the network so that the IDS has visibility into all the zones and locations it intends to monitor. Alternatively, you can have a single IDS instance, but you then must pick up the network traffic feed from multiple locations and switches that you want to monitor, aggregate them, and then feed it to the IDS.
But you have to keep in mind that an IDS usually has a maximum resource capability it can handle, which can be either a maximum number of packets per second or bandwidth. If the total network feed that needs to be monitored by the IDS exceeds the limit of a single instance of an IDS, you need multiple instances of the IDS, with the traffic feed split among them.
Another point to keep in mind is that most often, with IDPS deployments, you are blind to traffic from a lot of other subnets at the enterprise. The main reason is that a lot of subnets under many switches in the network have most of the communication within their subnet under their switch, which is all Layer 2 forwardable. But if your IDPS deployment uses a SPAN feed location at an upper-level switch, your IDPS never sees these lower-level switch traffic, which is confined to those subnets under those switches, unless devices in those subnets talk to devices up and outside their subnet. To capture all this traffic, you need to make sure you SPAN traffic from all these switches as well and have them sent to your IDPS.
Also, while deploying your solution, being aware of the network topology of the enterprise where you are deploying, and making sure that your IDPS receives all the traffic from all the zones and subnets that you intend to monitor is very important.
IDPS Components
An IDPS is a complex piece of software that consists of multiple moving parts. Most of the components in an IDPS are pretty modular and have a set task or functionality that they conduct on incoming packets, after which they pass on the packets and its corresponding output from its processing to the next component, and so on.
Figure 23-4 shows the main components that make up an IDPS and the flow of packets through them. In the next set of sections, we briefly go through the mains components that make up an IDPS and the tasks they carry out for the smooth functioning of an IDPS.
Packet Capture Module
Any IDPS requires packets from the network that they can dissect and analyze. Most often, when people think of packet capture, the first thought is that it has to come from a port or interface on the system. This is not entirely true. An IDPS just needs the traffic feed. How it gets it is immaterial. It can either be straight from the IDPS device port, which is connected to the cable on the network. It can be a packet capture file (PCAP) on the disk, which the IDPS can read. It can be a custom technique that has been developed into the IDPS where another packet monitoring solution can directly feed packets into the IDPS, and so on.
Now capturing the packets live off the wire is the most common method with an IDPS, as that’s the whole point of an IDPS. There are many packet capture methods/frameworks available that are used and implemented by an IDPS packet capture module, which listens to packets coming into the network interfaces/ports on the IDPS device.
The main goal of whatever capture method the packet capture module uses is to capture packets by dropping as little as possible and with low CPU overhead. Most high-speed networks can have a traffic feed in the range of millions of packets per second and tens of gigabits in bandwidth. The packet capture method should be able to obtain the packets arriving at the network port or the network interface card (NIC), and with as low an overhead as possible on the kernel and the system and make the packets available for the rest of the IDPS to process.
To exert as little overhead as possible many packet capture frameworks implement a zero-copy technique that uses their kernel modules that helps them to copy/access the packet for the IDPS, bypassing as much of the kernel’s networking stack as possible, thereby hugely reducing system and kernel overhead and keeping CPU consumption low. Some of the frameworks that allow you to do this are PF_Ring, Netmap, and specific modes in AF_Packet.
AFPacket
PF_RING
Netmap
DPDK
NFQ
PCAP files
Other custom methods, many of which are commercial and paid
Apart from the packet frameworks, there are various other commercial vendors who provide custom network interface cards that aim to target high-bandwidth networks, promising low CPU overhead while maintaining low packet loss.
Now once the packet capture module in the IDPS obtains the packet, it might have to extract as much information about the packet as possible from the packet capture framework that it uses. Many times, the packet capture framework might carry out some preprocessing on the packet, extracting certain meta-information about the packet, before handing off the actual packet to the IDPS. It is important for the packet capture module to get as much of this metainformation about the packet it receives from the packet capture framework. Some of this information can be VLAN information, packet timestamps, flow hashes, and so on. This metainformation is used by various other components later in the IDPS as they process the packet.
Packet Layer Decoding
The Packet Capture module from the previous section passes on the packet it receives to the next stage of the IDPS, which for most cases, is the decoders module, which mainly consists of Layer 2, Layer 3, and Layer 4 decoders. Without going into the depths of the packet structure, a packet consists of multiple layers, with each layer consisting of a header and data associated with that header. For example, a TCP packet consists of a data link layer (i.e., Layer 2, Layer 3, which is the network layer consisting of the IP protocol, and Layer 4, which is the transport layer consisting of the TCP header and its payload).
The layers we mentioned here are very large in number and can vary based on the underlying physical network that is used. For example, depending on whether your device is connected to a physical wired ethernet network or the wireless Wi-Fi network, you can have different Layer 2 protocols. The wired physical ethernet result in packets that use Layer 2 protocols belonging to the 802.3 set of standards. Similarly, if one were to use the Wi-Fi as the underlying physical network, the Layer 2 protocols use protocols from the 802.11 standards. The list doesn’t end here. There might be other multiple layers sandwiched in between these other layers, an example being one that carries VLAN information.
From an IDPS perspective, depending on the underlying physical network for which the IDPS receives packets, the IDPS needs to support decoding multiple types of Layer 2 protocols, and it does so by implementing multiple decoders in its decoder module.
The decoder module parses the packet across the layers. First, the appropriate Layer 2 decoder parses the packet, which dissects the Layer 2 header. The Layer 2 header also contains information on the protocol used in the next upper Layer 3 of the packet. With the protocol in Layer 3 now figured out, the Layer 2 decoder passes on the packet to the next appropriate Layer 3 decoder. Similarly, it continues to Layer 4 and so on, till all the layers are peeled and decoded to obtain all the information from the packet.
The layer peeling and decoding happens sequentially with one layer’s decoder acting as a feeder to the next layer decoder. All the extracted fields from the various layers, like the IP addresses, TCP fields are stored in the packet for use by the subsequent modules of the IDPS.
TCP Stream Reassembly Module
One of the most widely used Layer 4 protocols for communication is TCP. TCP protocol works by breaking up into segments the stream of upper-layer data (Layer 7) bytes provided by software applications we use like the browser, email clients, and so forth, and puts each of the broken-up segments into the TCP layer in multiple packets. The TCP stream reassembly module in the IDS once it receives these TCP packets reassemble the TCP segments from all the TCP packets in the flow back into the continuous byte stream. It was originally on the sender’s side.
Now the TCP stream reassembly module has to deal with various idiosyncrasies while dealing with reassembly of TCP segments. For example, many operating systems’ network stacks create TCP segments and, then, later on, while receiving TCP segments from other devices, reassembles them in specific ways. For example, if it has two segments that overlap each other, it might merge them overlapping data in the segments based on various rules which might be specific to that OS. Another OS might do the same thing differently. The TCP stream reassembly module similarly needs to know the target OS the packet is headed to, and carry out reassembly of the TCP segments by mimicking how the target OS that has received the packet has done it.
These are various other idiosyncrasies as well that it must deal with while carrying out reassembly, all of which you learn and encounter as and when you start deploying on multiple networks around the world. Every network and the various operating systems used on the network has its quirks, and it’s something we IDPS developers have to deal with on a case by case basis. There is no written document documenting all of these quirks.
App Layer Parsing
The app layer is the application layer, which sits at Layer 7 of the packet. If Layer 4 is TCP, the TCP Stream Reassembly module reassemble the TCP segments into a continuous byte stream, which now becomes the Layer 7 data. If Layer 4 is UDP protocol, then its payload is Layer 7 data. Layer 7 data contains data that is specific to application layer protocols like HTTP, SMTP, DNS, SMB, and so forth.
The dissection of the application layer protocols in the Layer 7 data is carried out by the IDPS through app layer parsers implemented in the IDPS to which the Layer 7 data is fed. Based on the well-known protocols used by malware and malicious threat actors currently, you want to add support for parsing new protocols in the IDPS. Some of the well-known protocol parsers which are present in most IDPS solutions are HTTP, DNS, FTP, SMTP, IMAP, POP, SMB, and TLS. The list of parsers supported by IDPS is larger than the one we mentioned here, and it depends on the type of network protocols seen on the network the IDPS is tasked to protect.
For example, if the IDPS is targeted to monitor industrial solutions, then it needs SCADA protocol parsers for protocols like MODBUS, ICS, DNP, and so forth. If it is tasked to protect healthcare networks in hospitals, then it needs to implement parsers for medical communication protocols like DICOM, HL7, and so forth. If the job is to monitor IoT devices, the list of protocols for which parsers are needed is huge. For IoT, you want to support many of the UPnP/ZeroConf protocols.
Now the protocol list we mentioned is in no way extensive. On top of all the many hardware and software vendors might develop and implement their proprietary protocol for communication between their software and devices. Every domain has its own set of protocols, both standard, and proprietary. If your IDPS is tasked to monitor and protect those hardware and software applications, you might have to implement parsers for these new protocols. There is no limit to the kind of Layer 7 application protocol parsers that an IDPS needs to support. The more you have, the better it is, especially when it comes to selling your IDPS product to potential customers.
Now the app layer parsing module in the IDPS parse the app layer data, dissecting it and storing the information present in various fields of the app layer protocol to be used later by the IDPS in the subsequent modules like the detection engine and the logging module.
Detection Engine
The detection engine is the heart of the intrusion analysis process inside an IDPS. So far, all the modules and components focused on dissecting the packet payload, extracting various information, and storing this information. The information stored now is put to use by the detection engine. The detection engine primarily works by means of a signature/rule engine that takes user-supplied rules and runs it against the various information and fields extracted from the packet from the previous modules.
The rule engine we mentioned is no different from the other signature modules and the YARA rule engine we discussed in Chapter 22. Now the rules that match on the packets in this module might be logged as an alert, or if the rule specifies that the packet that matches on it should be thrown away, as in an IPS, the packet is discarded basically preventing the transmission of the packet to the target system.
Logging Module
The logging module is usually the final module in the module pipeline of the IDPS. When we speak about logging, we are not just talking about the logging of the alerts from the various rules that match in the detection engine. These days IDPS combines themselves with SIEMs for advanced data analytics and behavior-based threat identification. Data analytics for behavior-based threat identification requires data on all aspects of the network communication inside the enterprise, logging information of all the packets, the protocols, the hosts communicating, and so forth. To make behavior-based identification happen, the IDPS logs all the various metainformation about the packet and its app layer data as well, which can then be consumed by other analytics and correlation engines for data crunching and threat identification.
Also, the Logging module usually is implemented to support various kinds of output log formats, including custom log formats, JSON format, and so forth. Also, it normally supports outputting the log data into various data sources like files on disk, Redis, Unix sockets, Syslog, raw TCP sockets, and so forth. This level of configurability allows various data analytics engines to directly plug themselves into the log output mechanism of the IDPS, aiding the seamless ingestion of the IDPS logging output. This is also how a vast majority of security products interoperate, by feeding on the output of other security products
Rule Language
We earlier spoke about how the Detection module in the IDPS has a rule engine that is run against the packet payload and any of its meta-information extracted from the various packet decoder and app layer parser modules. The rule engine is the heart of the detection module, and it works by ingestion rules written by us users. Almost every IDPS has a rule language that it supports, using which we can write rules for the rule engine of the IDPS.
Now the expressiveness of an IDPS’s rule language and the type and number of keywords it supports is decided by how well the packets can be dissected by that IDPS decoders and app layer parsers, and how much meta-information can be extracted from the various field of the packets and the app layer of the packets. The more fields the IDPS decoders and parsers extract out of the packet, the more keywords and features the rule language can expose, which we users can then use to write fine-tuned micro granular rules to match on incoming packets.
Later in this chapter, we get our feet wet writing rules using the Snort/Suricata rule language and play around with some PCAP files to understand how it all works together.
Suricata IDPS
Suricata is an open source network IDS/IPS and Network Security Monitoring engine, developed by the Open Information Security Foundation (OISF), a nonprofit organization.
We have already compiled and installed Suricata version 5.0.2 in Chapter 21, and we are going to make use of that setup for all exercises later in the chapter. In the next set of sections, we set up the config file needed by Suricata and talk about how to tweak some of the config options that we need for our various exercises. We also learn how to run Suricata against a PCAP file on disk and observe some of the output information given out by Suricata for the PCAP that it analyzes.
Yaml Config
Suricata, like most other software, needs various config options to run, and it does so by means of a yaml config file, which you can pass the Suricata in the command line. We have attached a sample suricata.yaml config file in our samples repo that you can use. Download this config file and put it inside a folder. We be using it to run our various exercises.
the Section in the Suricata Yaml Config That Let’s You Selectively Enable/Disable app layer parsers Inside Suricata
the Eve-Log Output Logging Section in Our Suricata.Yaml Config, That Shows That Eve Logging Is Enabled and Output Metainformation in Json Format to a Regular File eve.json
You Can Individually Enable/Disable Logging of Metainformation for Various Protocols in Eve-Log, As Seen for HTTP Which Is Enabled
As an exercise, go through the various options in the suricata.yaml file, have a look at all the app layer parsers that are enabled/disabled. Also go through the eve-log subsection and verify the various app layers parsers that have been enabled for logging under eve-log.
Running Suricata in PCAP File Mode
Suricata, like most other IDPS, is mainly run in live mode against packets coming on the network interface. But in our exercises here, we instead use Suricata by making it read packets from PCAP files on disk. Now that we have our suricata.yaml config setup from the previous section, let’s take Suricata for a spin.
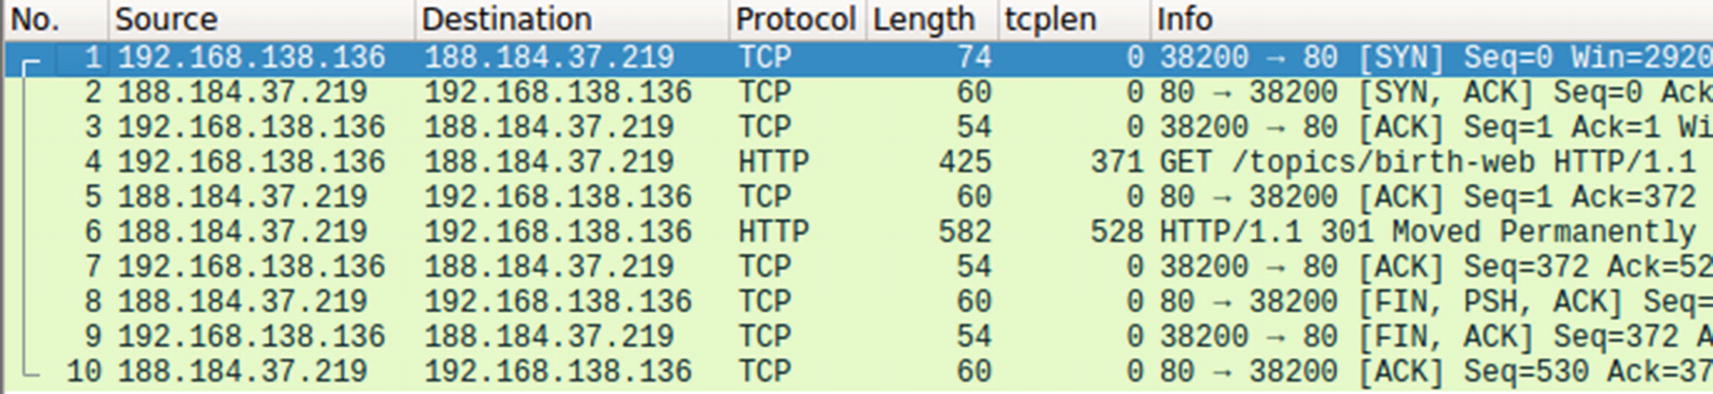
Our Sample-23-1.pcap contains a HTTP request in Packet #4

The eve.json eve-log output for Sample-23-1.pcap shows a json record corresponding to the HTTP request in Packet #4 in the pcap
You can play around with various kinds of PCAPs containing different app layer protocols and verify the various metainformation logged by Suricata for those protocols.
Rule Writing with Suricata
Suricata, like most IDPS, supports a rich rule language that write rules. When fed to Suricata, these rules are consumed by and used by its detection module to inspect against the packets and the metainformation extracted from the packet and its payload. If any of the rules match against the packets and any data associated with it, Suricata takes appropriate action against the packed as defined by the action in the rule.
Now the rule language syntax used by Suricata is largely borrowed from the notable Snort IDS rule language. But although it derives its syntax and majority of its keywords from Snort’s rule language, the semantics of the language and the keywords might vary. Also overtime Suricata has evolved with the addition of new keywords and syntactic updates that aren’t available and differs from the Snort rule language. For a lot of the keywords and rule language features present, the rules written for Suricata should work for Snort and vice versa, as long as you don’t use some keyword or rule syntax that is specific to either IDPS.
Basic Rule Structure
Basic Structure of Suricata Rule Language
These first seven fields in the listing are necessary for every Suricata rule. Apart from these seven fields, a Suricata rule must also contain a keyword called sid, which we cover in a short while.
ACTION
The Various ACTIONS Made Available by Suricata Rule Language
ACTION | Description |
|---|---|
alert | Logs an alert for a rule if it matches. |
pass | If a rule with this action matches, Suricata doesn’t alert on the packet for any rules that matched on it so far and also skips matching any other loaded rules for that packet. |
drop | Drops the packet. Used when Suricata is run as an IPS. Also logs an alert for the rule. |
reject | All the reject actions are an IPS feature, where when a rule with this action matches, Suricata sends an active rejection of the packet. If the packet on which the rule matched is a TCP packet, Suricata sends a TCP RST packet to the sender of the packet on which it matched. For all other types of packets, it sends an ICMP-error packet. |
rejectsrc | Same as reject action. |
rejectdst | Works the same as reject, except that the active rejection packet is sent to the destination of the packet on which the rule matched. |
rejectboth | Works the same as reject, except that the active rejection packet is sent to both the source and destination of the packet on which the rule matched. |
PROTOCOL
The Various Layer 3 And Layer 4 Protocols That One Can Specify In the PROTOCOL Field Of A Suricata Rule
tcp | tcp-pkt | tcp-stream | udp | icmpv4 | ip | |
icmpv6 | icmp | sctp | ip | ipv4 | ipv6 | ip6 |
the Suricata Command to Run to Obtain the List of Various App Layer Protocols That You Can Use in the PROTOCOL Field of a Rule
The various Layer 7 app layer protocols obtained from running the command in Listing 23-5, that one can use in the PROTOCOL field of a Suricata rule
http | ftp | smtp | tls | ssh | imap | smb |
dns | enip | dnp3 | nfs | ntp | dcerpc | ftp-data |
tftp | ikev2 | krb5 | dhcp | snmp | modbus |
SRC_IP and DST_IP
The SRC_IP field contains the IP address that should match on the source IP address of the packet, while the DST_IP field corresponds to the destination IP address of the packet.
These fields provide you an expressive way to specify IP addresses. It not only allows you to specify single IP addresses but also multiple IP addresses. You can also specify negated IP ranges, and you can make multiple combinations to expressively specify IP addresses that the rule should match. An added advantage of these fields is that it also allows you to specify subnet ranges using the CIDR notation.
Variables That You Can Define in Suricata.yaml File That You Can Specify in a Rule for SRC_IP and DST_IP fields
Some Samples Examples That You Can Use for SRC_IP and DST_IP
SRC_PORT and DST_PORT
Very similar to SRC_IP and DST_IP, these fields allow you to specify port values that should match on the source and destination port values of packets. The syntax and the expressiveness of these fields in a rule follow the same format as SRC_IP and DST_IP fields, including the availability of specifying vars in the yaml config file, that you can then specify as values for these fields in the rule.
Do note that port numbers are a feature that is present in certain protocols like TCP and UDP, and the rules that you write with specific port numbers should target packets that are carrying Layer 4 headers that support port numbers.
DIRECTION
This field takes one of the 3 values: ->, <-, or <->. This field specifies the direction of the packet for the SRC_* and the DST_* fields that the rule should match on.
Some Sample Rules Exercises with Different DIRECTION Values
Rule 1 says that it should match on packets whose source address is 192.168.10.1, and the destination address is 10.8.0.1. Rule 2 says the opposite of Rule 1. Rule 3 says, “I don’t care about the direction, and I’ll match in either case.” So, for our packet, Rule 1 and Rule 3 match, but Rule 2 won't’ match as expected.
IP-Only Rules
It is incorrect if we said that if we write a rule with just the seven fields from the section, a rule is useless. A lot of rules are written with only these seven fields set and an additional field in the keywords section called sid. No other keywords. It’s ACTION, SRC_IP, SRC_PORT, DIRECTION, DEST_IP, DEST_PORT, and the keyword sid. That’s it! These rules are called IP-only rules.
In the malware world where you have malicious servers pop up and go down every day, security companies write IP-only rules containing IP addresses of malicious servers, so that they can detect any communication happening from hosts on the network to these malicious servers, thereby hinting at a malware infection on the host.
Also, an added advantage of IP-only rules is that the Suricata detection engine efficiently handles them, since they are only matched on the first packet of a flow, thereby reducing rule inspection overhead for subsequent packets, making it the ideal choice to write rules that aim to purely detect communication-based on IP addresses.
Keywords
The real juice in a packet is in the internals of a packet with various details spread across its various fields, across app layer data, and so forth. All these fields are exposed via the Suricata rule language via various keywords, and this is what is used by most rule content developers to write expressive rules to match on packets flowing through the network.
Structure for Specifying Keywords in a Suricata Rule
sid Keyword
sid is the one keyword that is needed in every Suricata rule. It needs a value, and the value holds the signature ID which is a numeric value that is unsigned and 4 bytes long, that uniquely identifies the rule. Every rule loaded into Suricata should have a sid whose value is unique in the list of rules loaded. If another signature uses a sid value that is already used by another rule which Suricata has loaded, Suricata discards the new rule containing the duplicate sid value.
Let’s Take It for a Spin
Now that we have got a basic understanding of the structure of a Suricata rule, let’s now get our hands dirty by writing a few of them.
Exercise 1: IP-Only Rule
As an exercise, let’s use the PCAP from our samples repo Sample-23-1.pcap, and open it using Wireshark. Wireshark is probably one of the most important tools for Suricata/Snort Rule Writers. Wireshark provides support for parsing a wide variety of protocols and provides a very intuitive visualization of the packets. With its extensive search and filtration options, one can easily dissect a large PCAP to find specific information present in various fields of the packets contained within the PCAP.
Sample IP Only Rule to Match on the First Packet of Sample-23-1.Pcap
Command to Run Suricata Against Sample-23-1.Pcap with Exercise.Rules Rules File
Exercise 2: Content Keyword
Now the real juice is in the actual data exchanged between hosts and which is present as a payload in the packets exchanged between the hosts. The payload of the packet is the raw payload that is part of either the TCP or UDP protocol. Suricata makes available this payload for matching by the rule engine, via the content keyword of the rule language.

Figure 23-8.
Sample Rule That Matches on Packet Payloads That Contain the String Mozilla
Copy the rule to exercise.rules rules file and re-run the command from Listing 23-10. Before you run the command, clear the contents of fast.log file or better yet delete the file to get rid of any old alerts, since new alerts from Suricata are appended to the fast.log file. You can now run the command and verify the output in fast.log, which should contain an alert for the rule.
Exercise 3: Case Matters and Keyword Modifiers
Sample Rule That Matches on Packet Payloads That Contain the String Mozilla
Now delete fast.log and re-run the command from Listing 23-10. Do you see an alert for this rule? No we won’t. Why is that? With the rule we are instructing Suricata to match on the pattern mozilla exactly case-by-case, and that’s how Suricata takes it. But none of the packet payloads in Sample-23-1.pcap contains the string mozilla. Instead, one of the packets, Packet #4 from our PCAP, contains Mozilla, with a capital M.
When you specify a content keyword in the Suricata rule, by default, it is consumed by the rule engine as case-sensitive, unless specified otherwise explicitly. If you want a pattern to be matched in a case-insensitive manner, you have to modify the content keyword via another keyword, which signals the Suricata rule engine to parse that content keyword and later on match it against the packet payloads in a case-insensitive manner.
Sample Rule That Does a Case Insensitive Match for the Pattern Mozilla
Now copy the rule into exercise.rules and re-run Suricata. You should now see an alert in the fast.log file. Voila!
Exercise 4: Matching on App Layer Buffers
Low performance
It needs to search for the content pattern on the entire packet payload. On top of that, it needs to match on every single packet of the flow. Many times, the content that you are searching for is present in specific portions/fields of the packet and is present only in a few packets of the flow. You don’t need to search every single packet and definitely not the full payload of a packet.
Normalization
The content payload of a packet is what we call a raw buffer. Most TCP payloads are app layer payloads that might be encoded in certain ways. Decoding it to a universally normalized content format provides rule writers content that is bound to be in a standard format. Decoding normalization is done by app layer parsers inside Suricata or any other IDPS for that matter. Suricata makes available these normalized content via various buffers, which it then exposes to the rule writer via various app layer-specific keywords.
Can be easily evaded
Attackers often split their payload across multiple packets. For example, consider the string mozilla. An attacker can split this string into two parts moz and zilla and put it in two separate packet payloads. A Suricata rule that tries to match on the content mozilla like the one we wrote in Listing 23-14 fails to match on either of the packet payloads since the full pattern is not available in each of the packet payloads. This is easily solved with app layer parsers which buffer the content and make available the full field value mozilla to the detection engine for matching.
Sample Rule That Specifically Searches for Mozilla in the http User Agent Field
Now copy the rule to exercise.rules file and run Suricata, and you now see an alert for this rule. The rule uses the http_user_agent keyword which acts like a modifier to the previous content keyword, like how nocase modifies the behavior of the previous content keyword. When the rule engine encounters this rule, instead of searching for this content mozilla on every packet’s payload, it specifically search for it only against the user-agent header value of HTTP requests only, greatly improving efficiency and improving accuracy.
Other Keywords
Suricata supports various keywords that can be used to match on every aspect of a packet. With the support of app layer parsers and the data exposed by them through various rule language keywords, you can write highly performant and accurate rules to match on almost any kind of packet payload content flowing through your network.
Covering every single keyword provided by Suricata is out of the scope of this book. You can learn more about the Suricata rule language covered in the Suricata User Guide. You can also refer to the SNORT Users Manual, which also covers the Snort rule language in detail. Do note that there are some syntactic and semantic variations between the Snort and Suricata rule languages, but otherwise, they are largely similar.
Suricata Command to List All the Keywords Exposed by Suricata Rule Language
The important thing about working with any IDPS or Suricata is that you need to know all the features provided by the IDPS and its rule languages to make its features and power. As malware analysts, the network aspect of a threat is of the utmost importance, and most infections can be caught by thorough network packet inspection. The same goes for writing rules. Try writing as many rules as possible, picking up different PCAP files with different protocols. Practice makes perfect.
Suricata also provides various options to profile rules for performance, so that you can write efficient rules. Writing efficient rules is of utmost importance, a point we covered in Chapter 22 as well. If an IDPS rule is inefficient, it can lead to bad performance, which can lead to packet loss, which can lead to missed detections, which finally leads to undetected infections on the network and even missed prevention if you are running it in IPS mode.
Summary
An IDPS is one of the oldest available network security solutions, that is an important piece of a defense-in-depth security design. In this chapter, we started by learning about the various traffic zones like north-south and east-west traffic that defines how an IDPS is deployed in enterprises. You learned the difference between an IDS and an IPS and how each of these receives packets using various mechanisms like SPANs and TAPS. We explored the various internal components of an IDPS and how they function internally and interoperate with other components to dissect and identify malicious network traffic. Finally, we explored Suricata IDPS and, with various hands-on exercises, got our hands dirty writing rules for Suricata IDPS.